| Param | Original file | Final file |
|---|---|---|
| Filename | modeM0/AS1G06_028T01_9000000890_06601cztM0_level2.evt | modeM0/AS1G06_028T01_9000000890_06601cztM0_level2_quad_clean.evt |
| Size (bytes) | 135,360,000 | 6,851,520 |
| Size | 129.1 MB | 6.5 MB |
| Events in quadrant A | 858,039 | 20,516 |
| Events in quadrant B | 919,984 | 20,828 |
| Events in quadrant C | 969,998 | 20,499 |
| Events in quadrant D | 1,232,640 | 19,149 |
| Mode M0 | |||
|---|---|---|---|
| Quadrant | BADHDUFLAG | Total packets | Discarded packets |
| A | 0 | 3559 | 1 |
| B | 0 | 3715 | 1 |
| C | 0 | 3905 | 1 |
| D | 0 | 4808 | 1 |
| Mode M9 | |||
|---|---|---|---|
| Quadrant | BADHDUFLAG | Total packets | Discarded packets |
| A | 1 | 251318637792 | 0 |
| B | 1 | -1 | -1 |
| C | 1 | -1 | -1 |
| D | 1 | -1 | -1 |
| Mode SS | |||
|---|---|---|---|
| Quadrant | BADHDUFLAG | Total packets | Discarded packets |
| A | 0 | 34 | 0 |
| B | 0 | 34 | 0 |
| C | 0 | 34 | 0 |
| D | 0 | 34 | 0 |
| Quadrant | Total seconds | Saturated seconds | Saturation percentage |
|---|---|---|---|
| A | 1711 | 2 | 0.116891% |
| B | 1711 | 6 | 0.350672% |
| C | 1711 | 16 | 0.935126% |
| D | 1711 | 19 | 1.110462% |
Noise dominated data is calculated using 1-second bins in cleaned event files. If a bin has >2000 counts, and if more than 50% of those come from <1% of pixels, then it is considered to be noise-dominated and hence unusable.
| Quadrant | # 1 sec bins | Bins with >0 counts | Bins with >2000 counts | High rate bins dominated by noise | Noise dominated (total time) | Noise dominated (detector-on time) | Marked lightcurve |
|---|---|---|---|---|---|---|---|
| A | 1711 | 1711 | 0 | 0 | 0.00% | 0.00% | 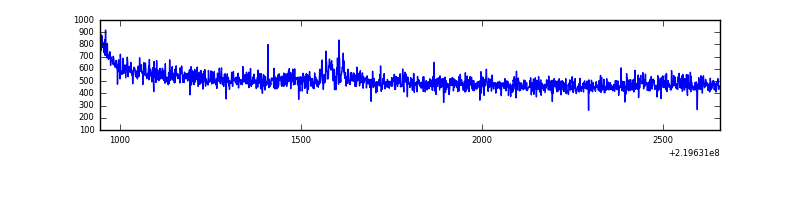 |
| B | 1711 | 1711 | 0 | 0 | 0.00% | 0.00% | 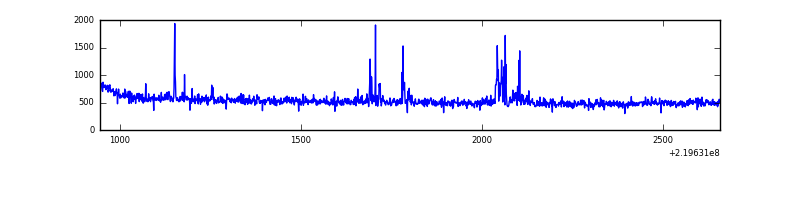 |
| C | 1711 | 1711 | 11 | 11 | 0.64% | 0.64% | 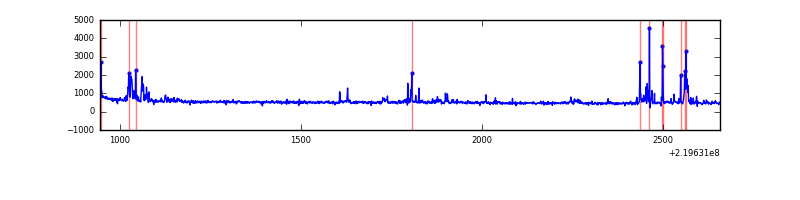 |
| D | 1711 | 1711 | 8 | 8 | 0.47% | 0.47% | 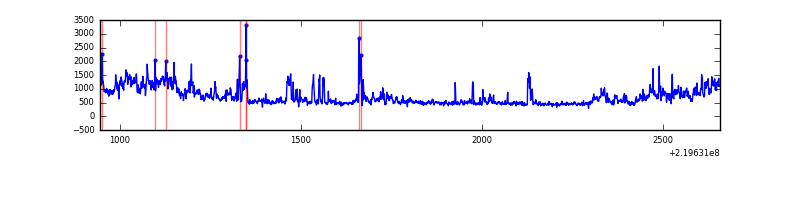 |
Top three noisy pixels from each quadrant. If the there are fewer than three noisy pixels in the level2.evt file, extra rows are filled as -1
| Pixel properties | Quadrant properties | ||||||
|---|---|---|---|---|---|---|---|
| Quadrant | DetID | PixID | Counts | Sigma | Mean | Median | Sigma |
| A | 8 | 15 | 11106 | 237.54 | 218 | 214 | 45.9 |
| A | 15 | 239 | 4601 | 95.67 | 218 | 214 | 45.9 |
| A | 12 | 194 | 2122 | 41.61 | 218 | 214 | 45.9 |
| B | 4 | 81 | 24522 | 552.94 | 224 | 220 | 44.0 |
| B | 0 | 219 | 11679 | 260.72 | 224 | 220 | 44.0 |
| B | 0 | 229 | 9909 | 220.45 | 224 | 220 | 44.0 |
| C | 9 | 247 | 102978 | 1983.2 | 217 | 219 | 51.8 |
| C | 3 | 9 | 16885 | 321.65 | 217 | 219 | 51.8 |
| C | 13 | 61 | 1660 | 27.81 | 217 | 219 | 51.8 |
| D | 8 | 195 | 200521 | 3728.44 | 213 | 207 | 53.7 |
| D | 2 | 63 | 191681 | 3563.9 | 213 | 207 | 53.7 |
| D | 13 | 137 | 14383 | 263.86 | 213 | 207 | 53.7 |
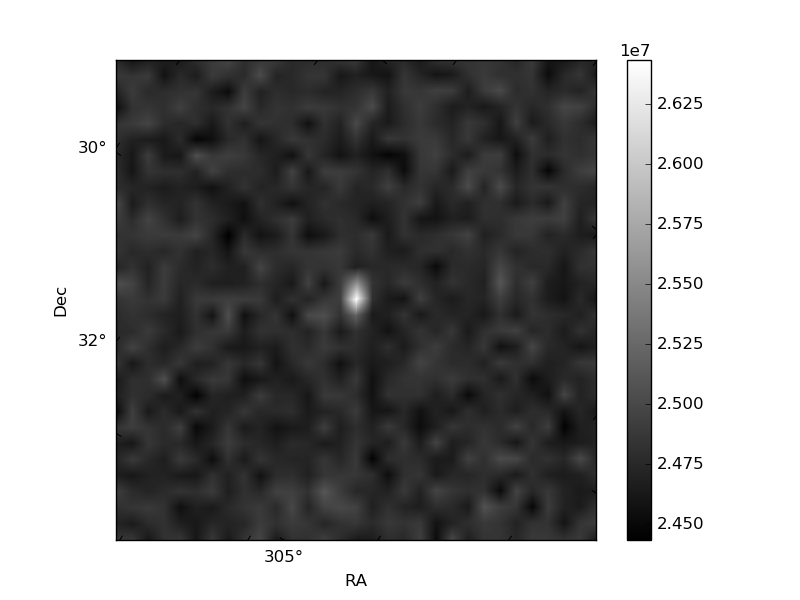
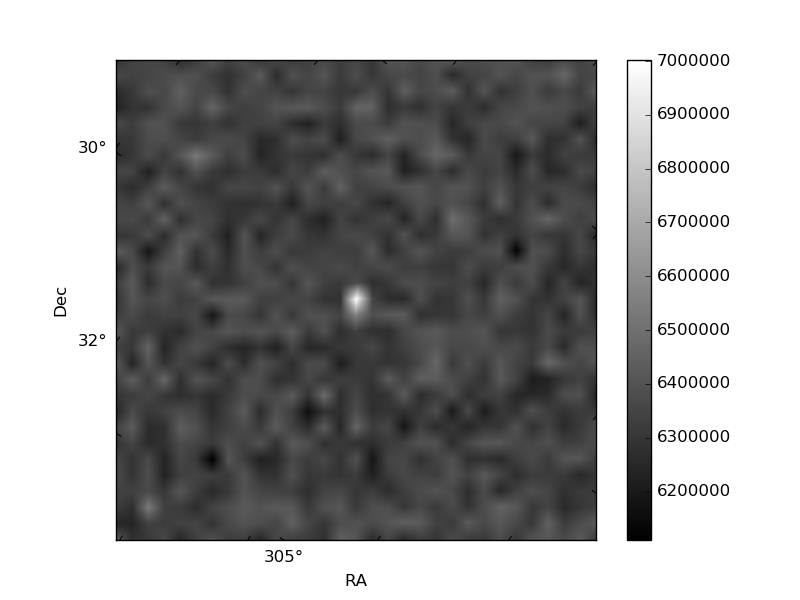
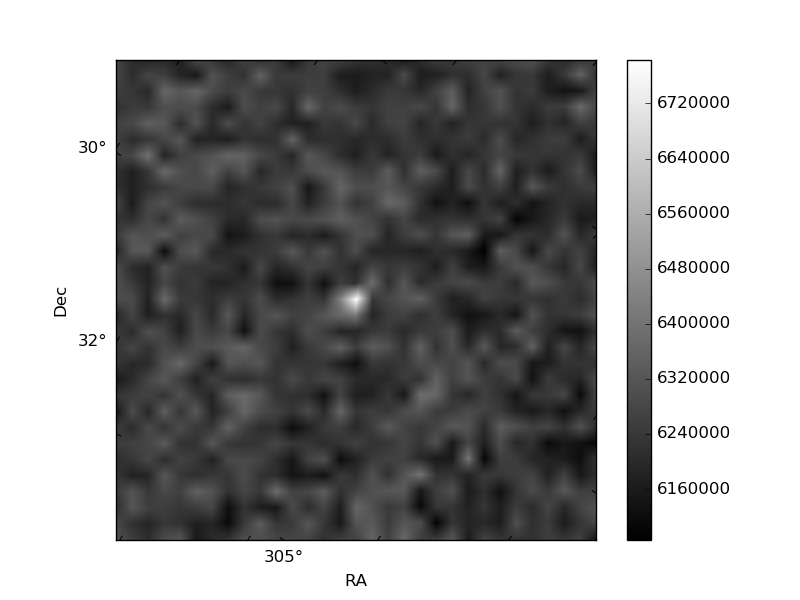
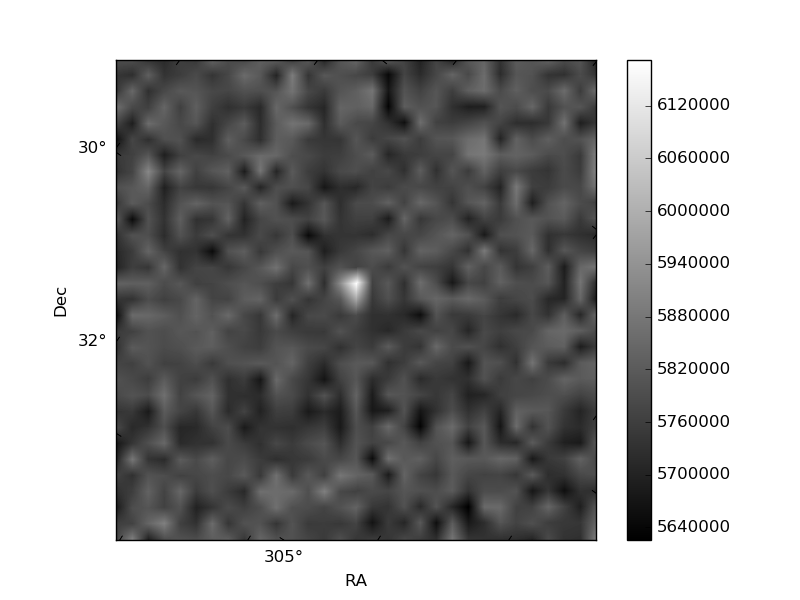
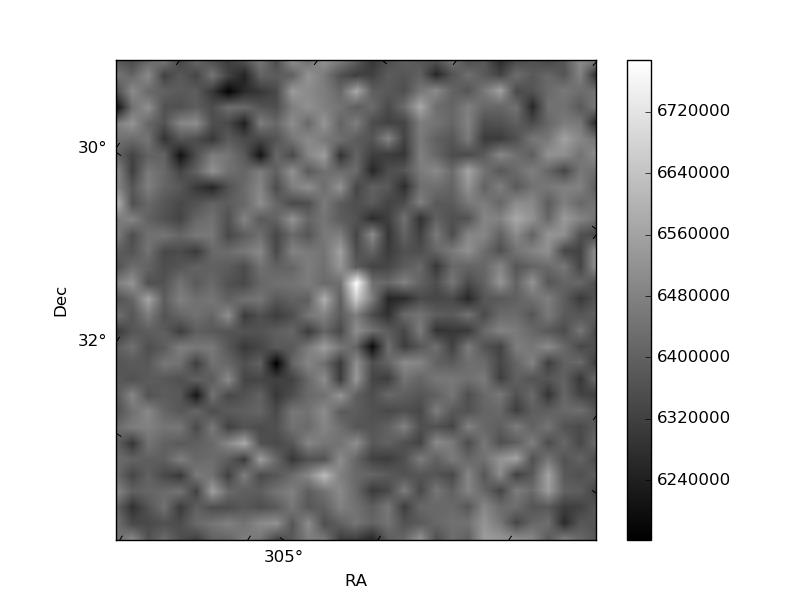
Histogram calculated using DETX and DETY for each event in the final _common_clean file
| Quadrant A | 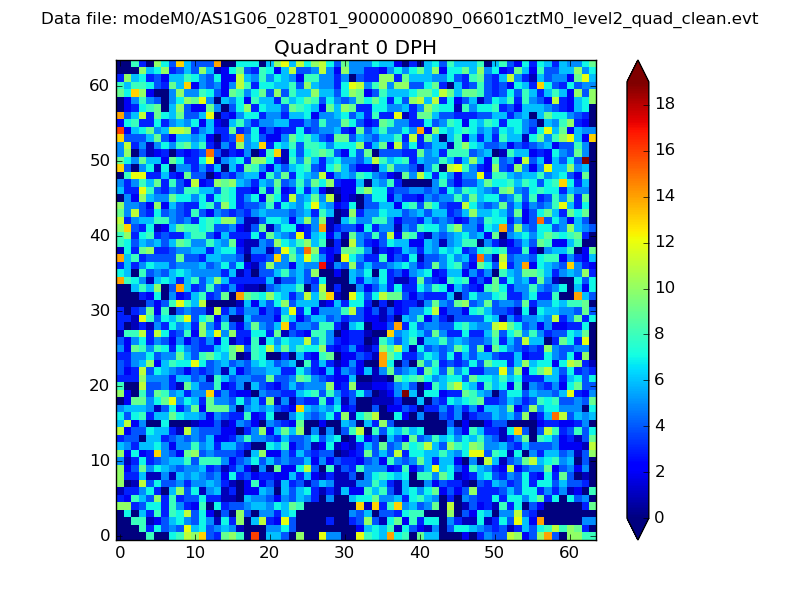 |
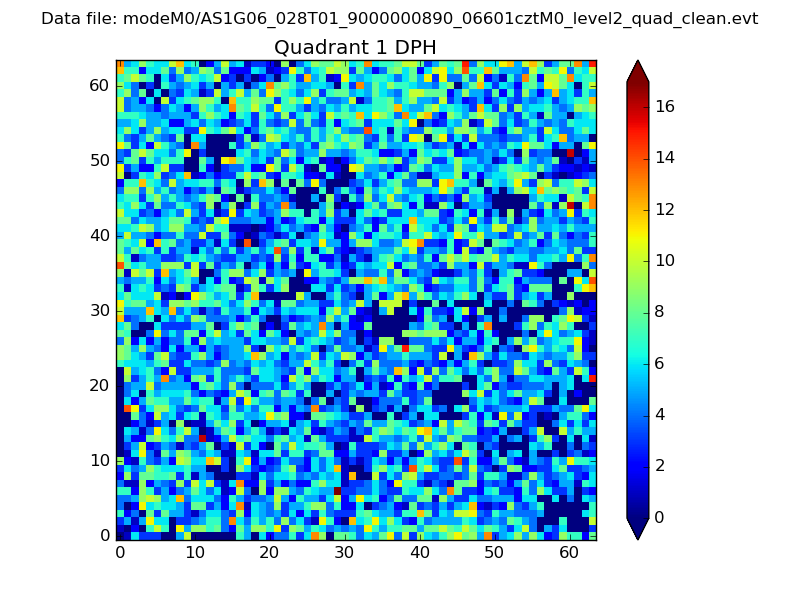 |
Quadrant B |
|---|---|---|---|
| Quadrant D | 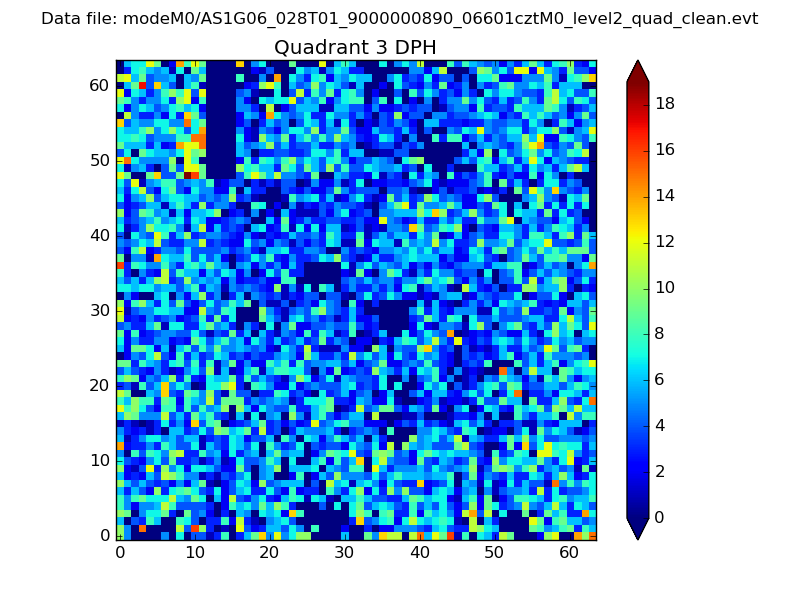 |
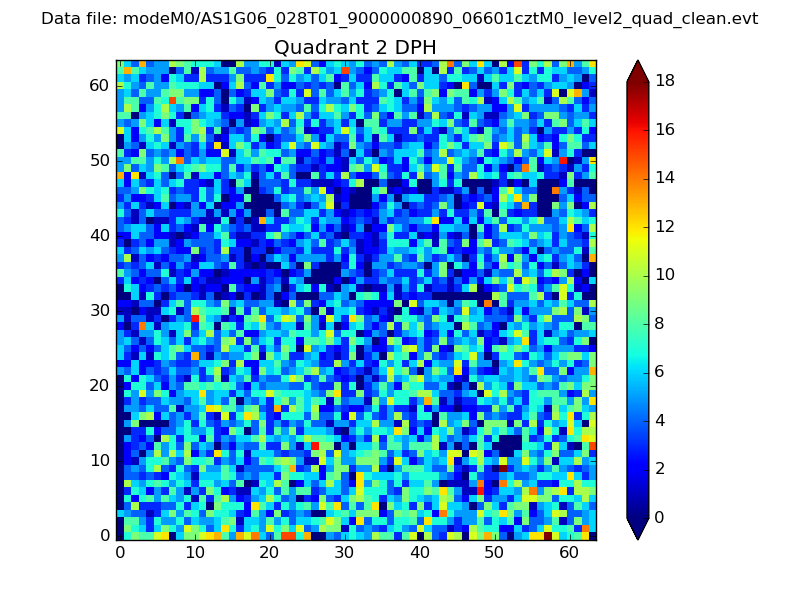 |
Quadrant C |
| Plot type | Count rate plots | Images |
|---|---|---|
| Comparison with Poisson distribution Blue bars denote a histogram of data divided into 1 sec bins. Red curve is a Poisson curve with rate = median count rate of data. |
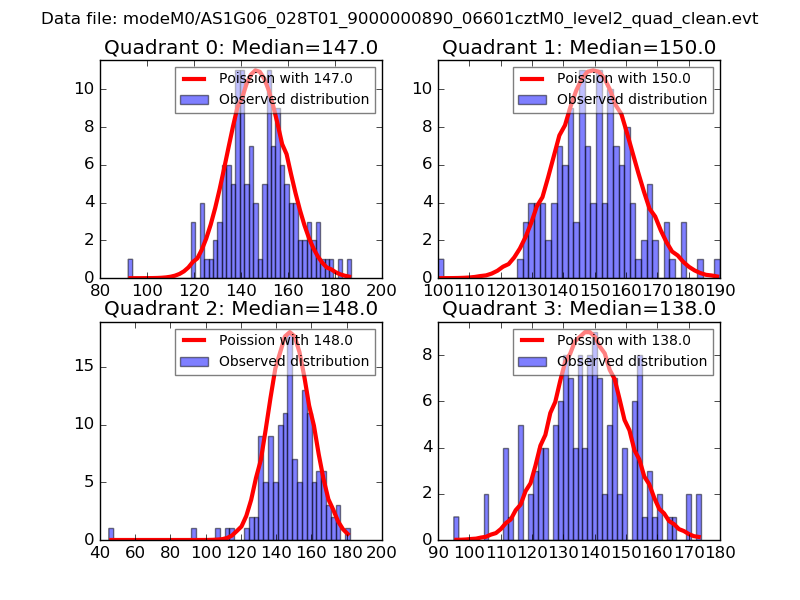 |
 |
| Quadrant-wise count rates Data is divided into 100 sec bins |
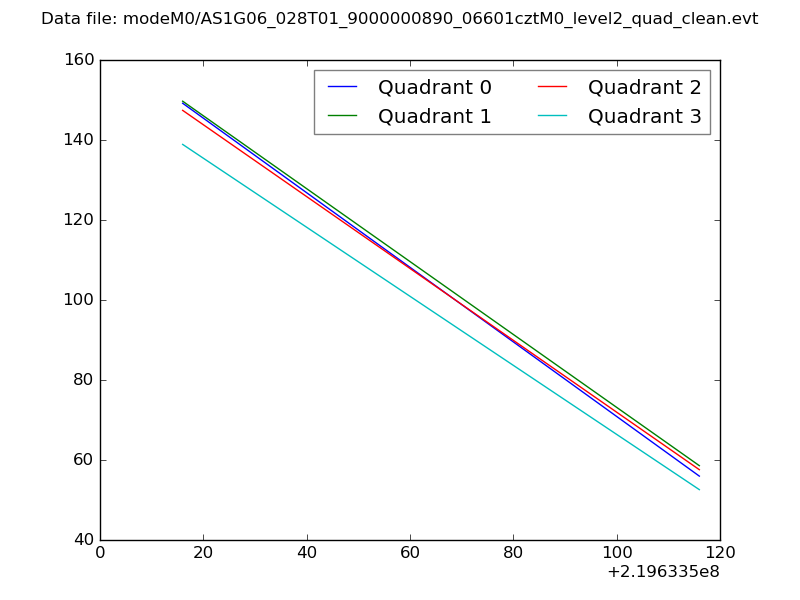 |
|
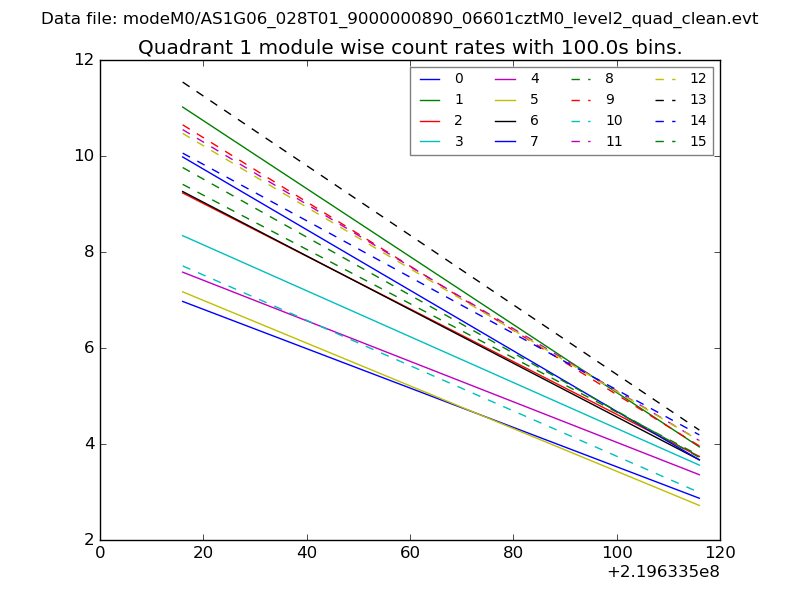
| Module-wise count rates for Quadrant A Data is divided into 100 sec bins |
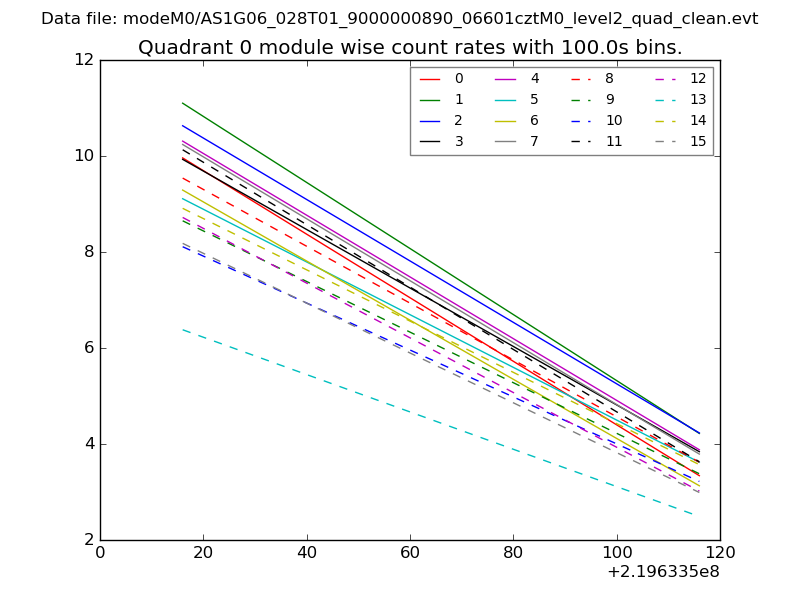 |
 |
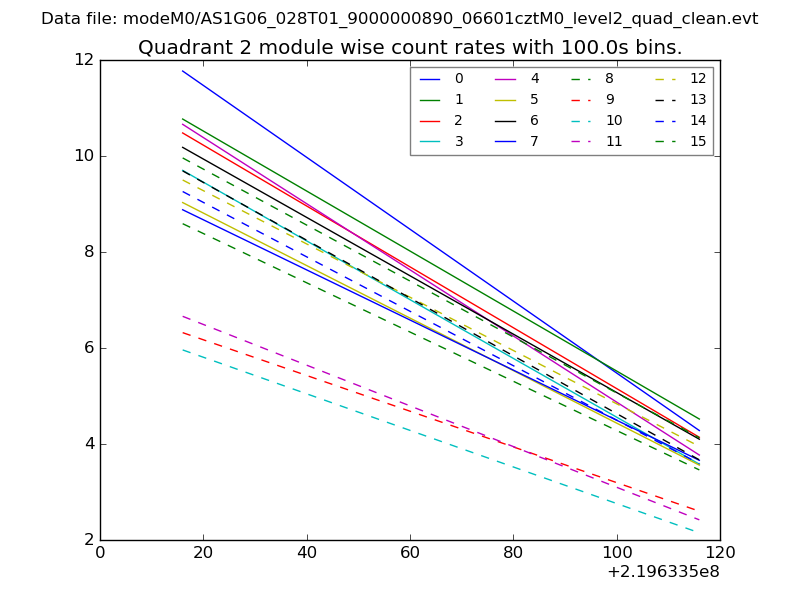
| Module-wise count rates for Quadrant B Data is divided into 100 sec bins |
 |
 |
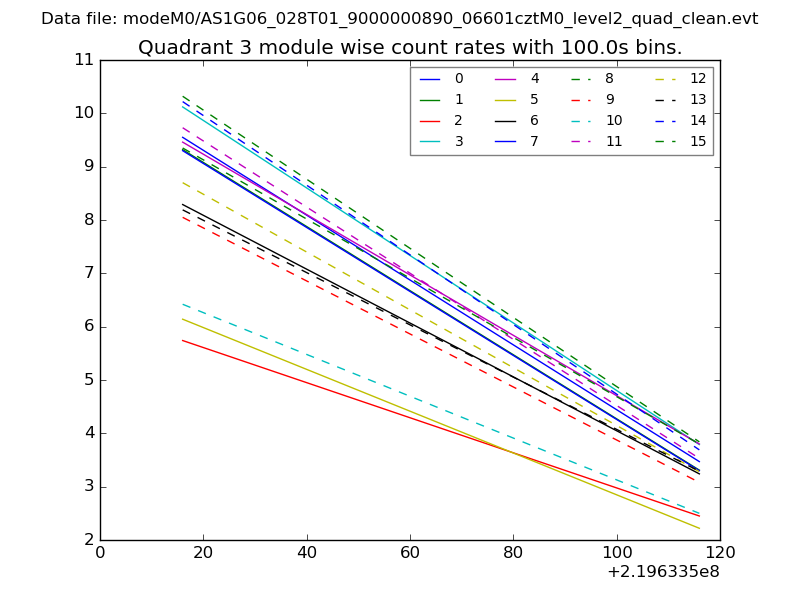
| Module-wise count rates for Quadrant C Data is divided into 100 sec bins |
 |
 |
| Module-wise count rates for Quadrant D Data is divided into 100 sec bins |
 |
 |
| Parameter | Plot |
|---|---|
| CZT HV Monitor | 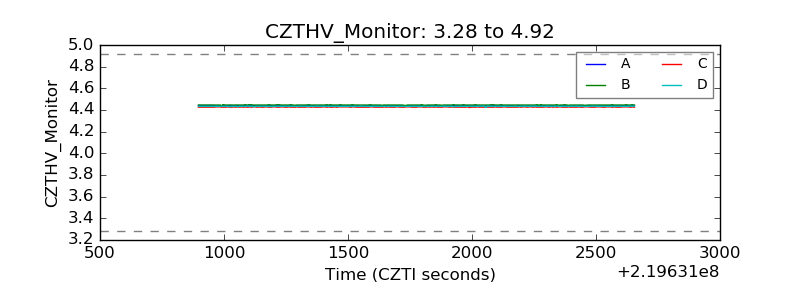 |
| D_VDD | 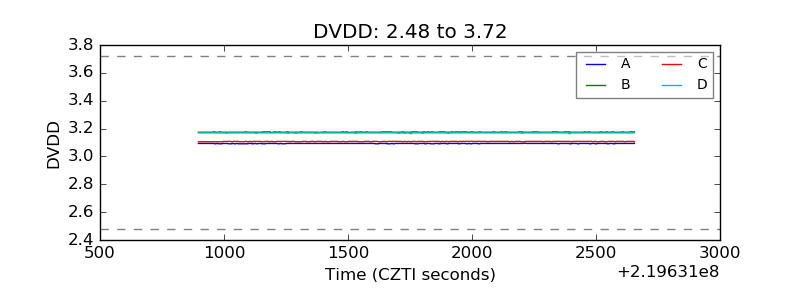 |
| Temperature 1 | 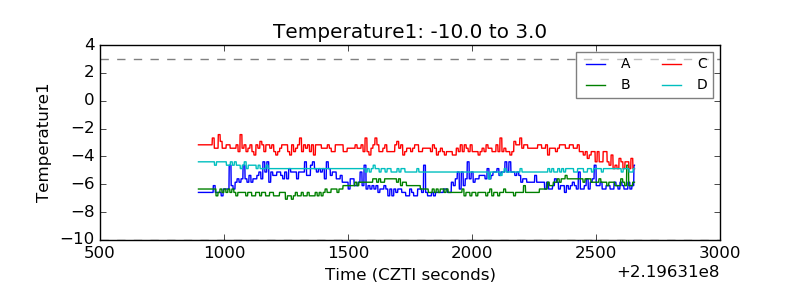 |
| Veto HV Monitor | 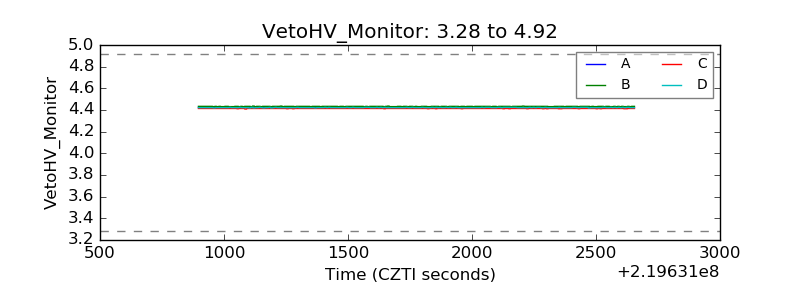 |
| Veto LLD | 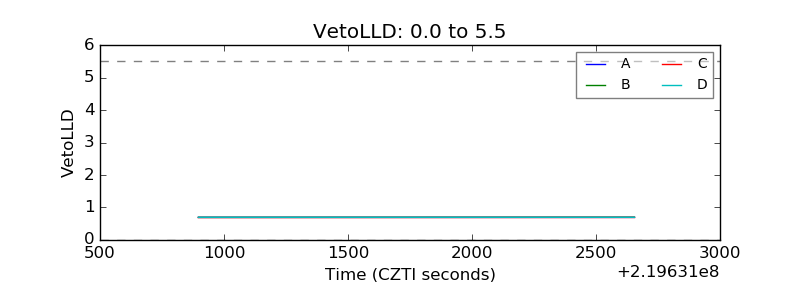 |
| Alpha Counter | 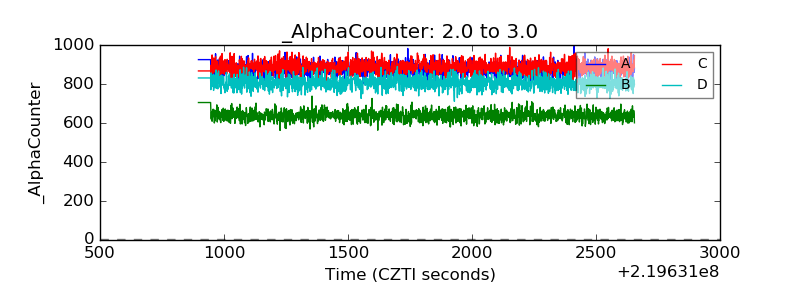 |
| _CPM_Rate | 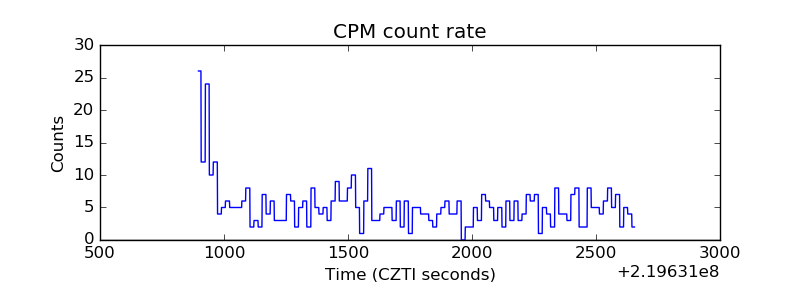 |
| CZT Counter | 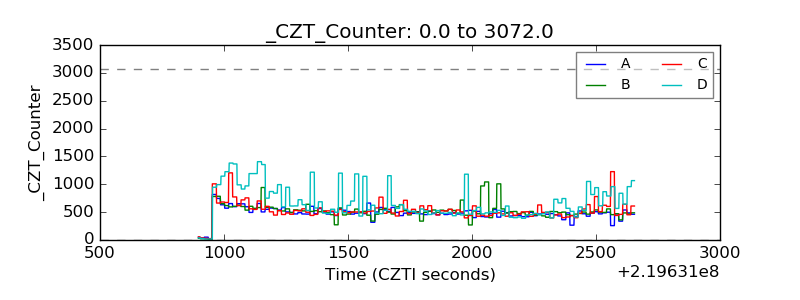 |
| +2.5 Volts monitor |  |
| +5 Volts monitor |  |
| _ROLL_ROT | 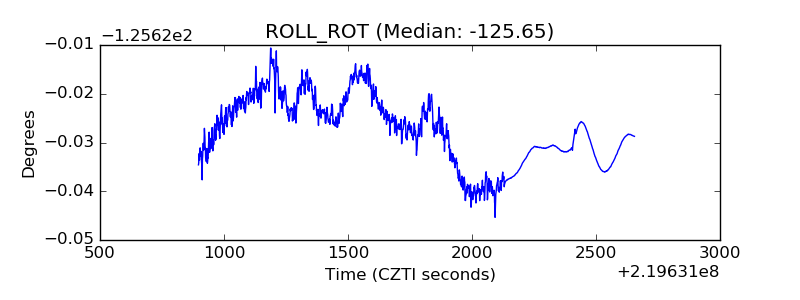 |
| _Roll_DEC | 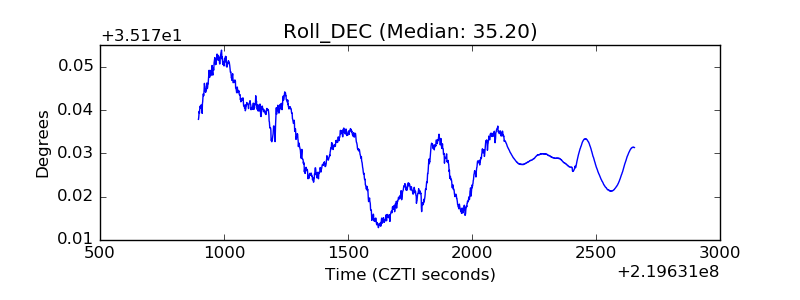 |
| _Roll_RA | 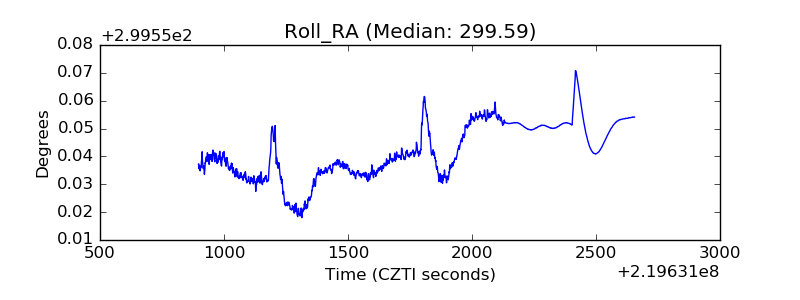 |
| Veto Counter | 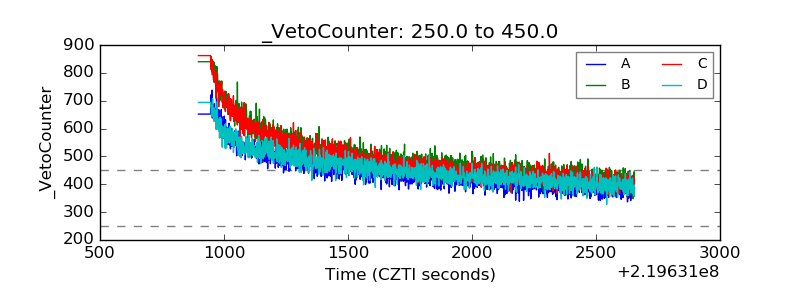 |