| Param | Original file | Final file |
|---|---|---|
| Filename | modeM0/AS1A02_170T02_9000000892cztM0_level2.fits | modeM0/AS1A02_170T02_9000000892cztM0_level2_quad_clean.evt |
| Size (bytes) | 309,389,760 | 355,881,600 |
| Size | 295.1 MB | 339.4 MB |
| Events in quadrant A | 1,866,528 | 2,238,162 |
| Events in quadrant B | 1,782,490 | 2,208,720 |
| Events in quadrant C | 1,827,332 | 2,117,057 |
| Events in quadrant D | 1,505,142 | 1,827,769 |
| Mode SS | |||
|---|---|---|---|
| Quadrant | BADHDUFLAG | Total packets | Discarded packets |
| A | 0 | 706 | 0 |
| B | 0 | 706 | 0 |
| C | 0 | 706 | 0 |
| D | 0 | 706 | 0 |
| Mode M9 | |||
|---|---|---|---|
| Quadrant | BADHDUFLAG | Total packets | Discarded packets |
| A | 0 | 33 | 0 |
| B | 0 | 33 | 0 |
| C | 0 | 33 | 0 |
| D | 0 | 33 | 0 |
| Mode M0 | |||
|---|---|---|---|
| Quadrant | BADHDUFLAG | Total packets | Discarded packets |
| A | 0 | 71077 | 0 |
| B | 0 | 78527 | 0 |
| C | 0 | 72917 | 0 |
| D | 0 | 118121 | 0 |
| Quadrant | Total seconds | Saturated seconds | Saturation percentage |
|---|---|---|---|
| A | 34725 | 671 | 1.932325% |
| B | 34725 | 1310 | 3.772498% |
| C | 34725 | 439 | 1.264219% |
| D | 34725 | 3051 | 8.786177% |
Noise dominated data is calculated using 1-second bins in cleaned event files. If a bin has >2000 counts, and if more than 50% of those come from <1% of pixels, then it is considered to be noise-dominated and hence unusable.
| Quadrant | # 1 sec bins | Bins with >0 counts | Bins with >2000 counts | High rate bins dominated by noise | Noise dominated (total time) | Noise dominated (detector-on time) | Marked lightcurve |
|---|---|---|---|---|---|---|---|
| A | 38190 | 34724 | 0 | 0 | 0.00% | 0.00% |  |
| B | 38190 | 34706 | 0 | 0 | 0.00% | 0.00% |  |
| C | 38190 | 34725 | 0 | 0 | 0.00% | 0.00% |  |
| D | 38190 | 34722 | 0 | 0 | 0.00% | 0.00% | 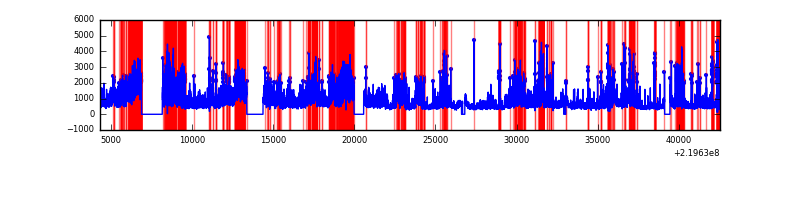 |
Top three noisy pixels from each quadrant. If the there are fewer than three noisy pixels in the level2.evt file, extra rows are filled as -1
| Pixel properties | Quadrant properties | ||||||
|---|---|---|---|---|---|---|---|
| Quadrant | DetID | PixID | Counts | Sigma | Mean | Median | Sigma |
| A | 14 | 188 | 1843 | 11.32 | 483 | 452 | 122.8 |
| A | 0 | 29 | 1835 | 11.26 | 483 | 452 | 122.8 |
| A | 14 | 204 | 1597 | 9.32 | 483 | 452 | 122.8 |
| B | 2 | 9 | 1567 | 11.48 | 471 | 449 | 97.4 |
| B | 12 | 226 | 1297 | 8.71 | 471 | 449 | 97.4 |
| B | 5 | 128 | 1250 | 8.23 | 471 | 449 | 97.4 |
| C | 12 | 241 | 1329 | 6.95 | 483 | 447 | 126.9 |
| C | 2 | 191 | 1250 | 6.33 | 483 | 447 | 126.9 |
| C | 9 | 188 | 1225 | 6.13 | 483 | 447 | 126.9 |
| D | 3 | 14 | 1186 | 6.87 | 429 | 390 | 115.9 |
| D | 11 | 82 | 1140 | 6.47 | 429 | 390 | 115.9 |
| D | 6 | 231 | 1119 | 6.29 | 429 | 390 | 115.9 |
Histogram calculated using DETX and DETY for each event in the final _common_clean file
| Quadrant A |  |
 |
Quadrant B |
|---|---|---|---|
| Quadrant D |  |
 |
Quadrant C |
| Plot type | Count rate plots | Images |
|---|---|---|
| Comparison with Poisson distribution Blue bars denote a histogram of data divided into 1 sec bins. Red curve is a Poisson curve with rate = median count rate of data. |
 |
 |
| Quadrant-wise count rates Data is divided into 100 sec bins |
 |
|
| Module-wise count rates for Quadrant A Data is divided into 100 sec bins |
 |
 |
| Module-wise count rates for Quadrant B Data is divided into 100 sec bins |
 |
 |
| Module-wise count rates for Quadrant C Data is divided into 100 sec bins |
 |
 |
| Module-wise count rates for Quadrant D Data is divided into 100 sec bins |
 |
 |
| Parameter | Plot |
|---|---|
| CZT HV Monitor |  |
| D_VDD |  |
| Temperature 1 |  |
| Veto HV Monitor |  |
| Veto LLD |  |
| Alpha Counter |  |
| _CPM_Rate |  |
| CZT Counter |  |
| +2.5 Volts monitor |  |
| +5 Volts monitor |  |
| _ROLL_ROT |  |
| _Roll_DEC |  |
| _Roll_RA |  |
| Veto Counter |  |