| Param | Original file | Final file |
|---|---|---|
| Filename | modeM0/AS1A02_170T02_9000000892_06601cztM0_level2.evt | modeM0/AS1A02_170T02_9000000892_06601cztM0_level2_quad_clean.evt |
| Size (bytes) | 408,113,280 | 63,544,320 |
| Size | 389.2 MB | 60.6 MB |
| Events in quadrant A | 1,956,987 | 425,087 |
| Events in quadrant B | 2,550,823 | 416,880 |
| Events in quadrant C | 1,980,752 | 420,808 |
| Events in quadrant D | 5,582,012 | 361,415 |
| Mode SS | |||
|---|---|---|---|
| Quadrant | BADHDUFLAG | Total packets | Discarded packets |
| A | 0 | 86 | 0 |
| B | 0 | 86 | 0 |
| C | 0 | 86 | 0 |
| D | 0 | 86 | 0 |
| Mode M9 | |||
|---|---|---|---|
| Quadrant | BADHDUFLAG | Total packets | Discarded packets |
| A | 0 | 12 | 0 |
| B | 0 | 12 | 0 |
| C | 0 | 12 | 0 |
| D | 0 | 12 | 0 |
| Mode M0 | |||
|---|---|---|---|
| Quadrant | BADHDUFLAG | Total packets | Discarded packets |
| A | 0 | 8729 | 2 |
| B | 0 | 10477 | 1 |
| C | 0 | 8838 | 1 |
| D | 0 | 19589 | 1 |
| Quadrant | Total seconds | Saturated seconds | Saturation percentage |
|---|---|---|---|
| A | 4250 | 24 | 0.564706% |
| B | 4250 | 196 | 4.611765% |
| C | 4250 | 28 | 0.658824% |
| D | 4250 | 862 | 20.282353% |
Noise dominated data is calculated using 1-second bins in cleaned event files. If a bin has >2000 counts, and if more than 50% of those come from <1% of pixels, then it is considered to be noise-dominated and hence unusable.
| Quadrant | # 1 sec bins | Bins with >0 counts | Bins with >2000 counts | High rate bins dominated by noise | Noise dominated (total time) | Noise dominated (detector-on time) | Marked lightcurve |
|---|---|---|---|---|---|---|---|
| A | 5530 | 4251 | 0 | 0 | 0.00% | 0.00% | 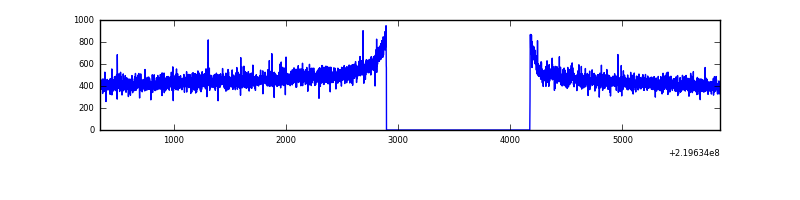 |
| B | 5530 | 4251 | 97 | 97 | 1.75% | 2.28% |  |
| C | 5530 | 4251 | 6 | 6 | 0.11% | 0.14% |  |
| D | 5530 | 4251 | 683 | 683 | 12.35% | 16.07% |  |
Top three noisy pixels from each quadrant. If the there are fewer than three noisy pixels in the level2.evt file, extra rows are filled as -1
| Pixel properties | Quadrant properties | ||||||
|---|---|---|---|---|---|---|---|
| Quadrant | DetID | PixID | Counts | Sigma | Mean | Median | Sigma |
| A | 8 | 15 | 11544 | 108.8 | 503 | 492 | 101.6 |
| A | 15 | 239 | 7890 | 72.83 | 503 | 492 | 101.6 |
| A | 0 | 226 | 4873 | 43.13 | 503 | 492 | 101.6 |
| B | 0 | 219 | 335510 | 3610.96 | 496 | 485 | 92.8 |
| B | 4 | 48 | 114279 | 1226.49 | 496 | 485 | 92.8 |
| B | 15 | 204 | 62771 | 671.33 | 496 | 485 | 92.8 |
| C | 9 | 247 | 52032 | 460.68 | 487 | 490 | 111.9 |
| C | 9 | 54 | 12861 | 110.57 | 487 | 490 | 111.9 |
| C | 3 | 9 | 7284 | 60.72 | 487 | 490 | 111.9 |
| D | 8 | 195 | 1895376 | 17040.56 | 456 | 441 | 111.2 |
| D | 13 | 105 | 779481 | 7005.66 | 456 | 441 | 111.2 |
| D | 2 | 63 | 390029 | 3503.44 | 456 | 441 | 111.2 |
Histogram calculated using DETX and DETY for each event in the final _common_clean file
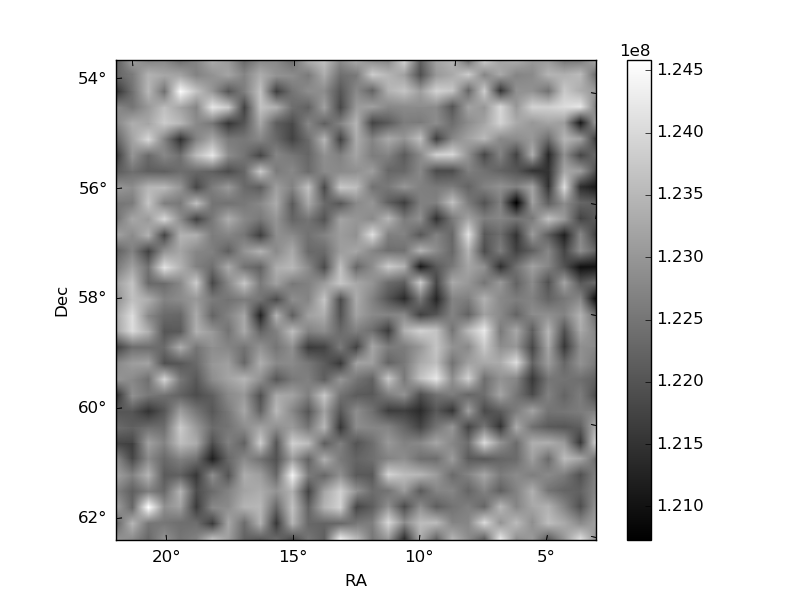
| Quadrant A | 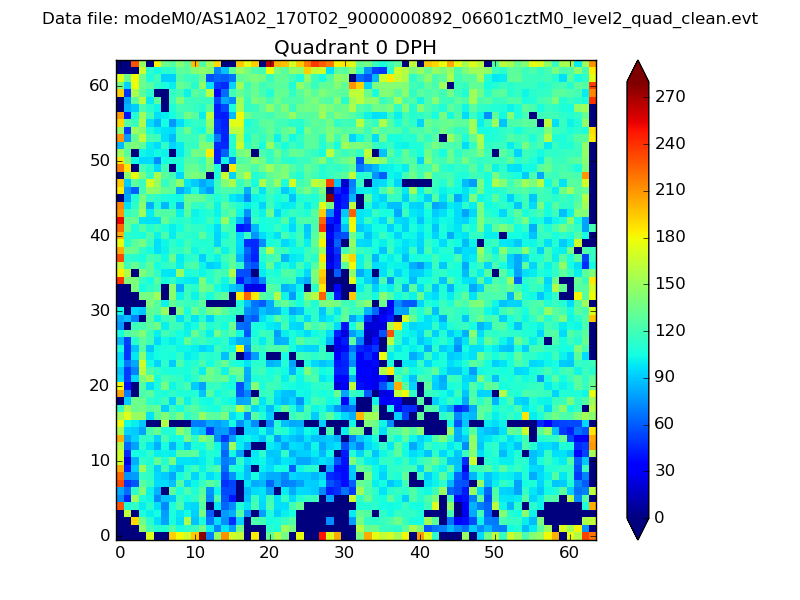 |
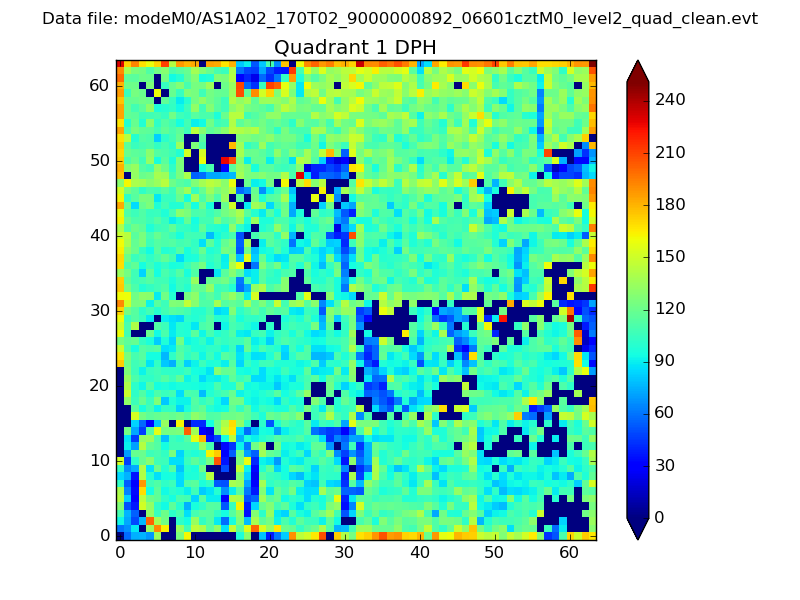 |
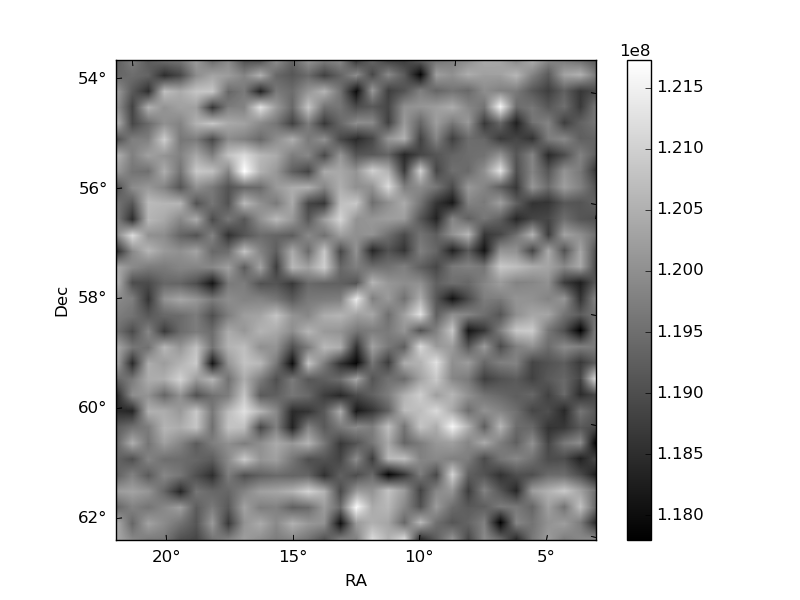
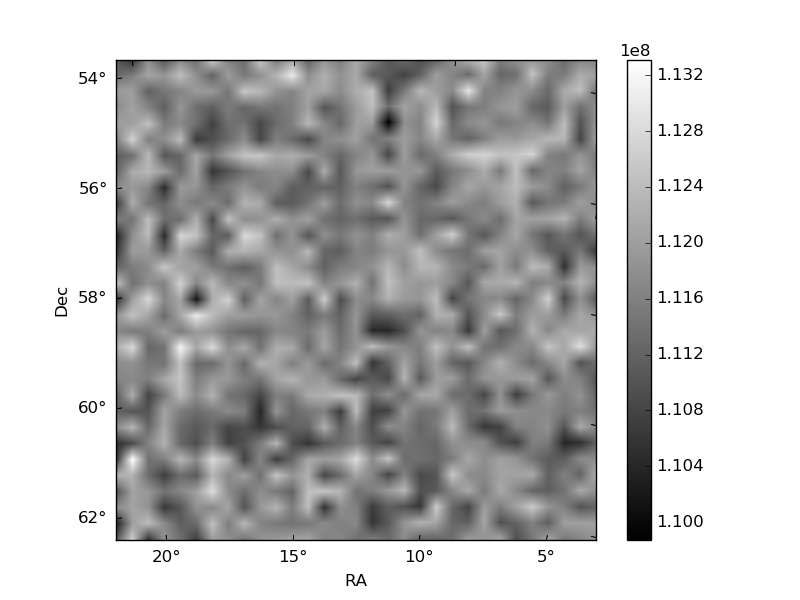
Quadrant B |
|---|---|---|---|
| Quadrant D | 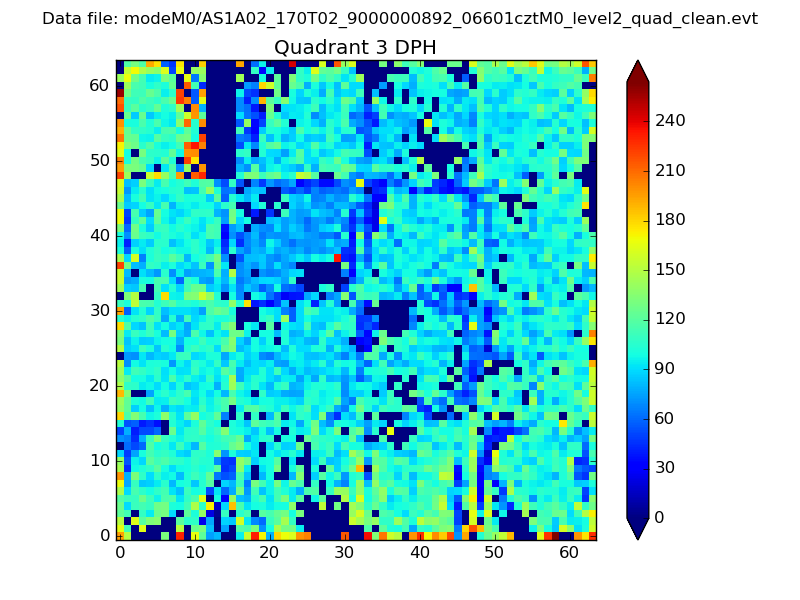 |
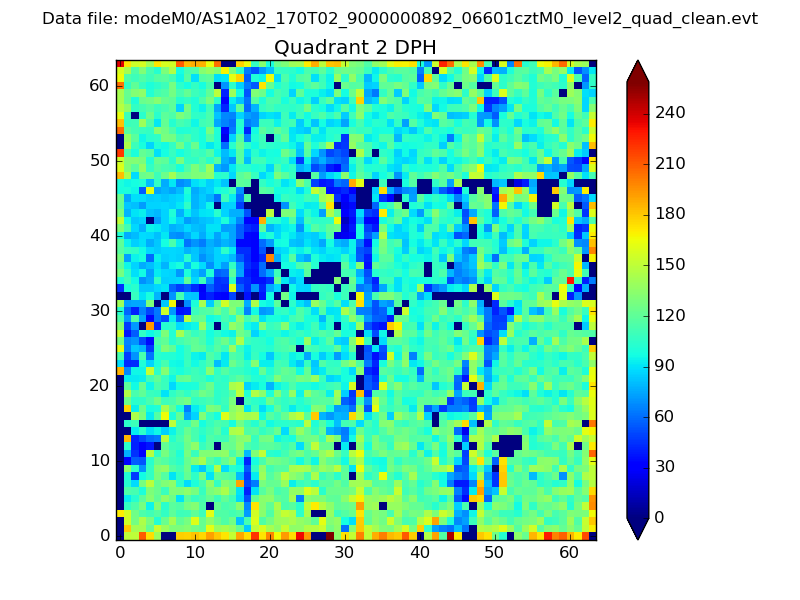 |
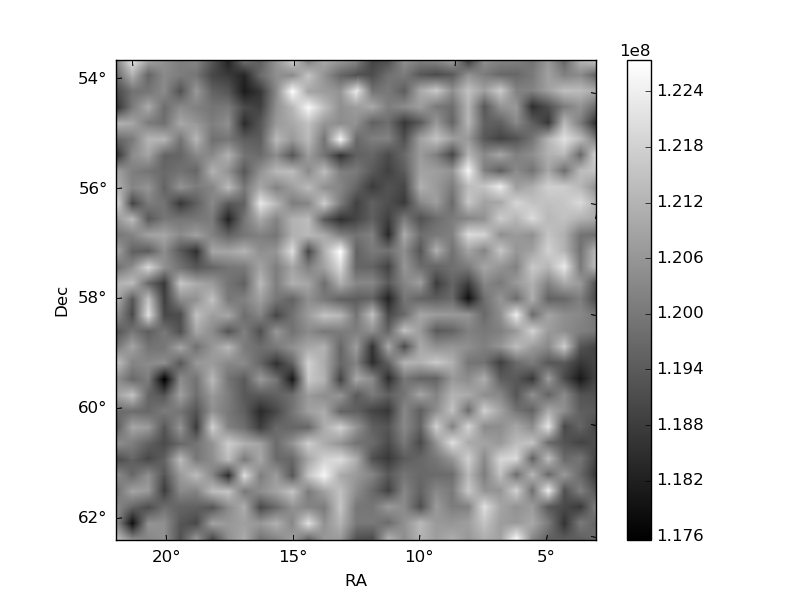
Quadrant C |
| Plot type | Count rate plots | Images |
|---|---|---|
| Comparison with Poisson distribution Blue bars denote a histogram of data divided into 1 sec bins. Red curve is a Poisson curve with rate = median count rate of data. |
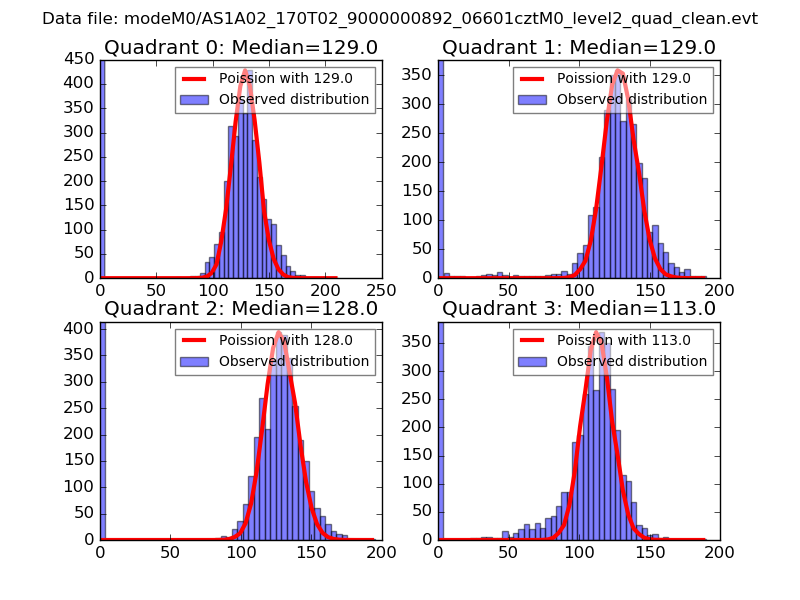 |
 |
| Quadrant-wise count rates Data is divided into 100 sec bins |
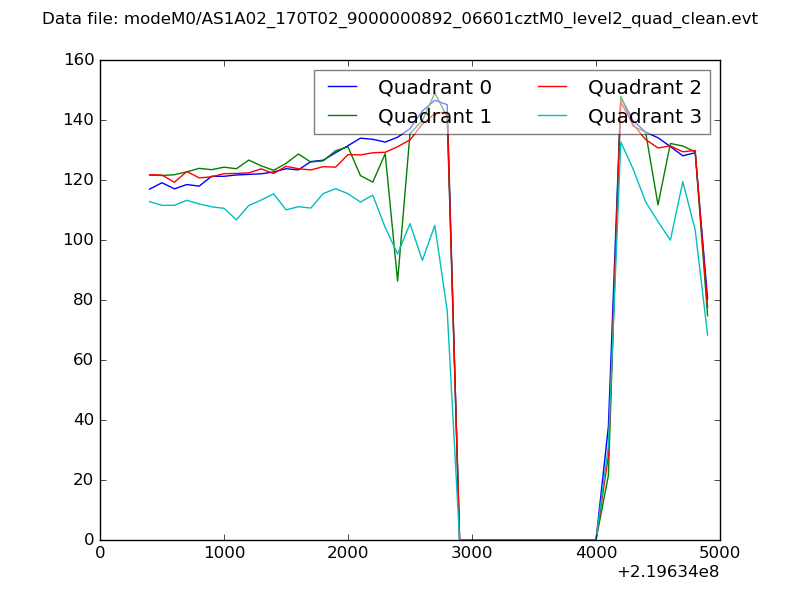 |
|
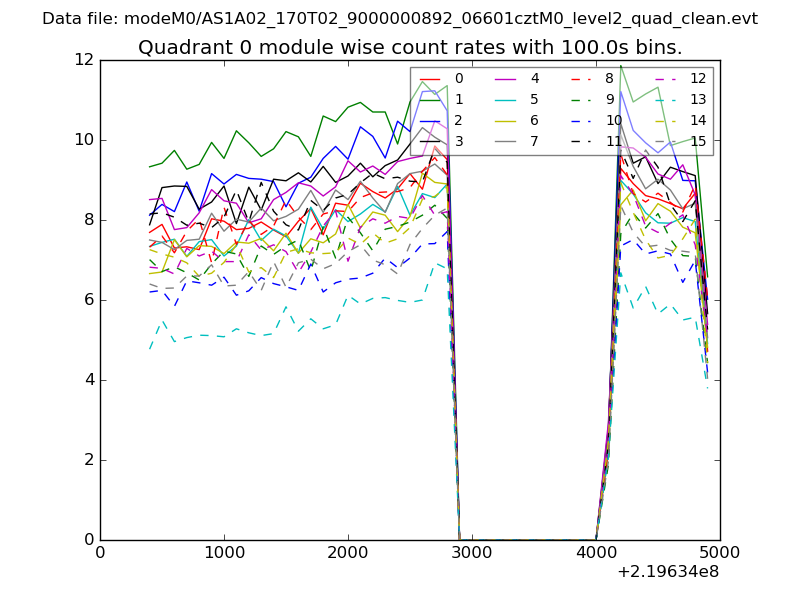
| Module-wise count rates for Quadrant A Data is divided into 100 sec bins |
 |
 |
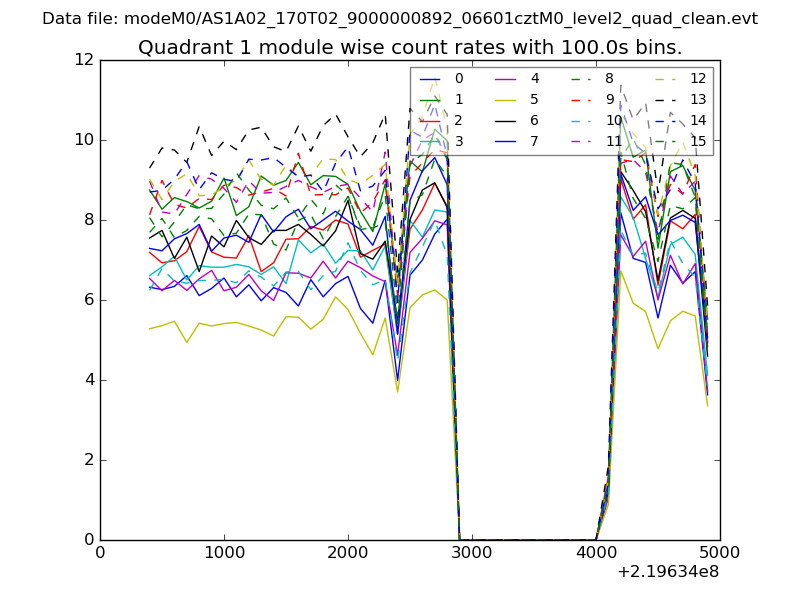
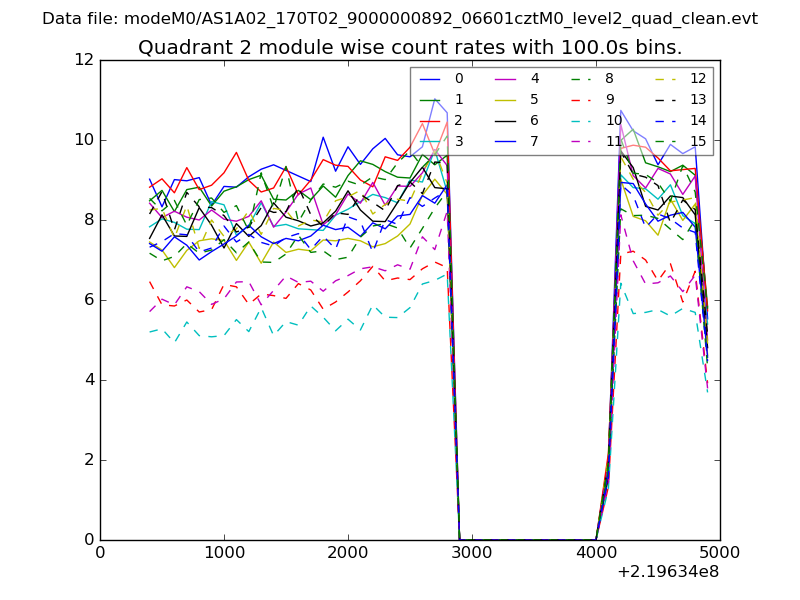
| Module-wise count rates for Quadrant B Data is divided into 100 sec bins |
 |
 |
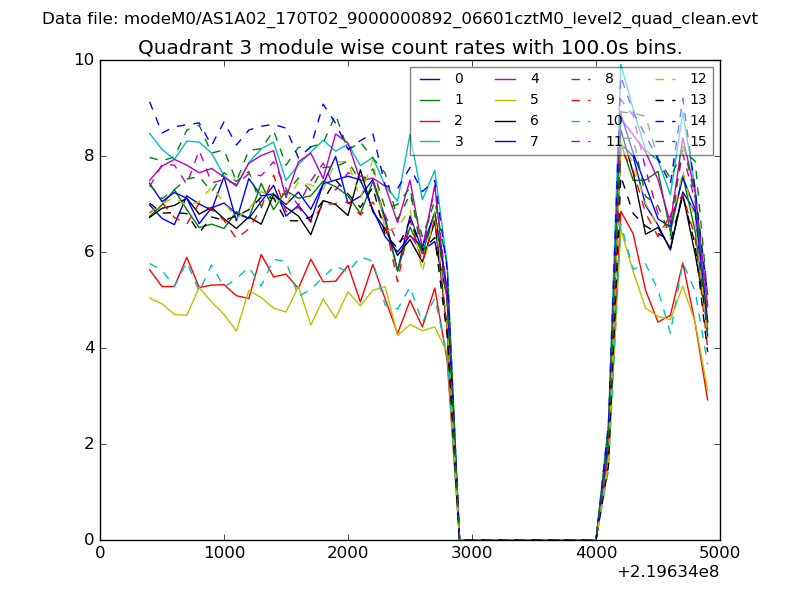
| Module-wise count rates for Quadrant C Data is divided into 100 sec bins |
 |
 |
| Module-wise count rates for Quadrant D Data is divided into 100 sec bins |
 |
 |
| Parameter | Plot |
|---|---|
| CZT HV Monitor | 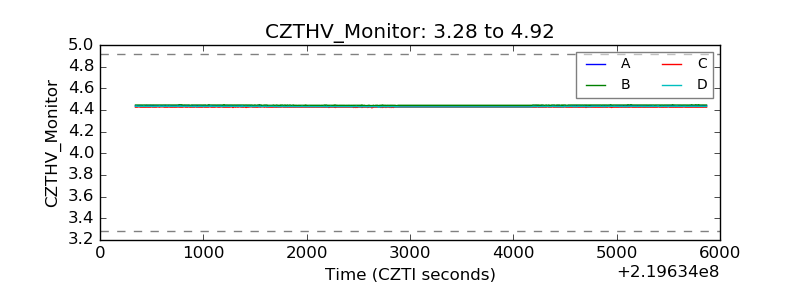 |
| D_VDD | 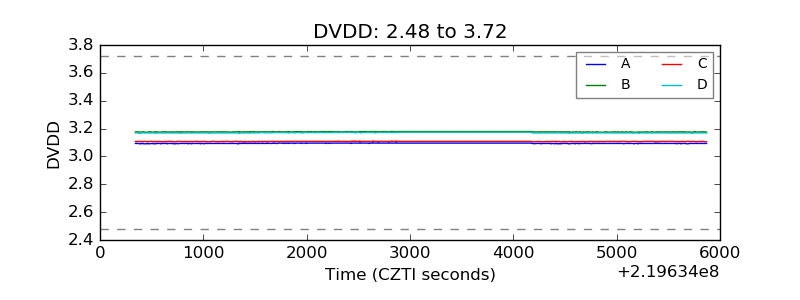 |
| Temperature 1 | 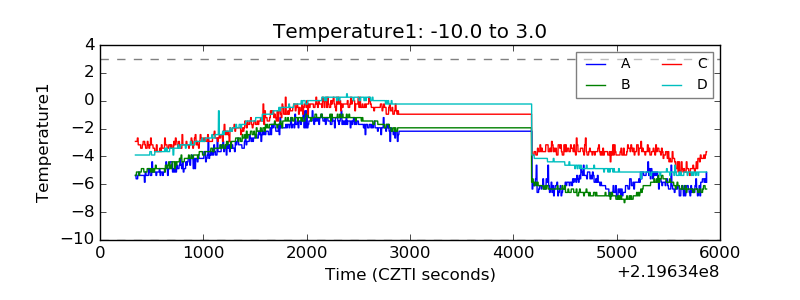 |
| Veto HV Monitor | 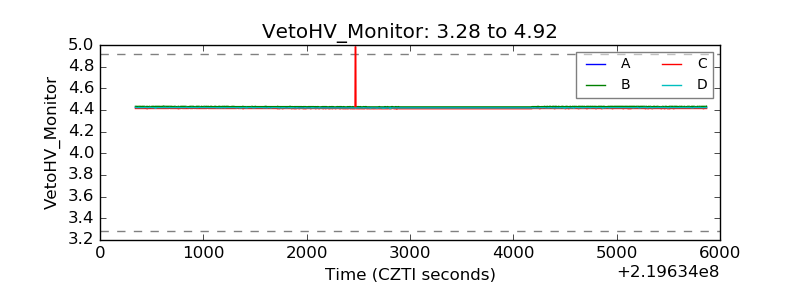 |
| Veto LLD | 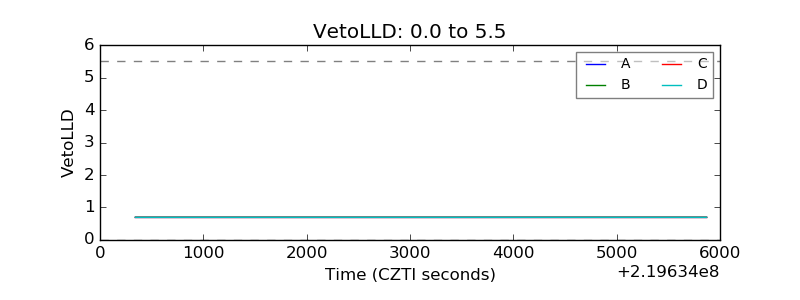 |
| Alpha Counter | 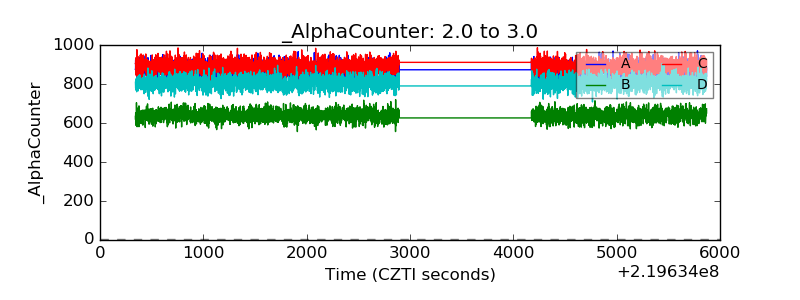 |
| _CPM_Rate | 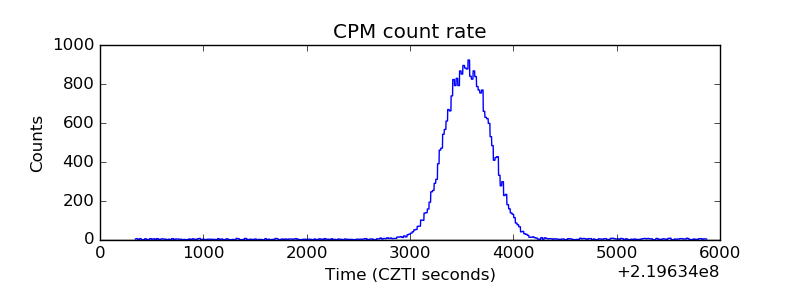 |
| CZT Counter | 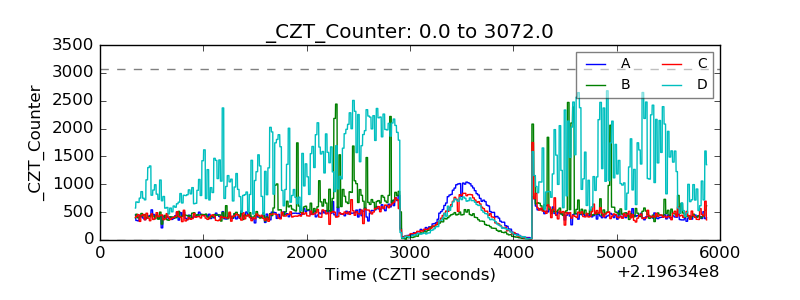 |
| +2.5 Volts monitor |  |
| +5 Volts monitor |  |
| _ROLL_ROT | 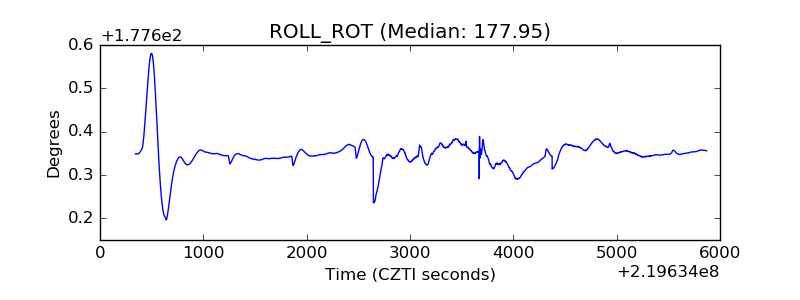 |
| _Roll_DEC | 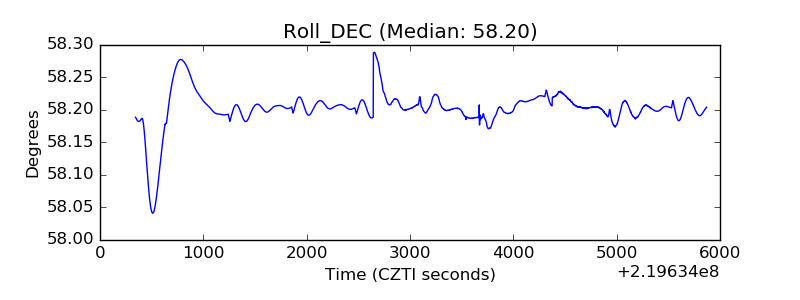 |
| _Roll_RA | 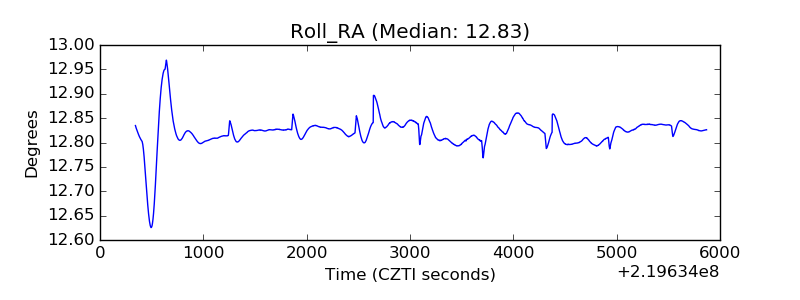 |
| Veto Counter | 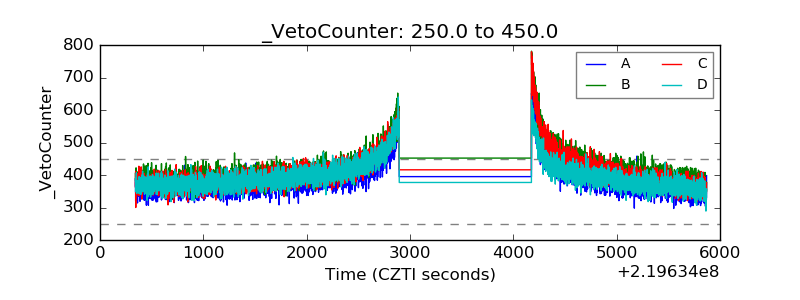 |