| Param | Original file | Final file |
|---|---|---|
| Filename | modeM0/AS1A02_170T02_9000000892_06603cztM0_level2.evt | modeM0/AS1A02_170T02_9000000892_06603cztM0_level2_quad_clean.evt |
| Size (bytes) | 581,702,400 | 78,860,160 |
| Size | 554.8 MB | 75.2 MB |
| Events in quadrant A | 2,942,309 | 496,744 |
| Events in quadrant B | 3,531,879 | 499,902 |
| Events in quadrant C | 3,460,261 | 491,660 |
| Events in quadrant D | 7,228,741 | 432,525 |
| Mode SS | |||
|---|---|---|---|
| Quadrant | BADHDUFLAG | Total packets | Discarded packets |
| A | 0 | 140 | 4 |
| B | 0 | 138 | 2 |
| C | 0 | 138 | 2 |
| D | 0 | 138 | 2 |
| Mode M9 | |||
|---|---|---|---|
| Quadrant | BADHDUFLAG | Total packets | Discarded packets |
| A | 0 | 6 | 0 |
| B | 0 | 6 | 0 |
| C | 0 | 6 | 0 |
| D | 0 | 6 | 0 |
| Mode M0 | |||
|---|---|---|---|
| Quadrant | BADHDUFLAG | Total packets | Discarded packets |
| A | 0 | 13904 | 266 |
| B | 0 | 15367 | 250 |
| C | 0 | 15360 | 292 |
| D | 0 | 26683 | 486 |
| Quadrant | Total seconds | Saturated seconds | Saturation percentage |
|---|---|---|---|
| A | 6693 | 113 | 1.688331% |
| B | 6696 | 262 | 3.912784% |
| C | 6693 | 109 | 1.628567% |
| D | 6688 | 840 | 12.559809% |
Noise dominated data is calculated using 1-second bins in cleaned event files. If a bin has >2000 counts, and if more than 50% of those come from <1% of pixels, then it is considered to be noise-dominated and hence unusable.
| Quadrant | # 1 sec bins | Bins with >0 counts | Bins with >2000 counts | High rate bins dominated by noise | Noise dominated (total time) | Noise dominated (detector-on time) | Marked lightcurve |
|---|---|---|---|---|---|---|---|
| A | 7337 | 6702 | 0 | 0 | 0.00% | 0.00% | 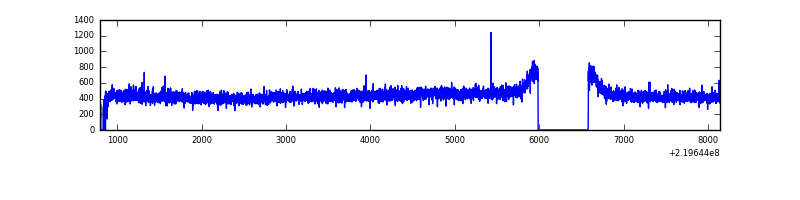 |
| B | 7344 | 6711 | 96 | 96 | 1.31% | 1.43% | 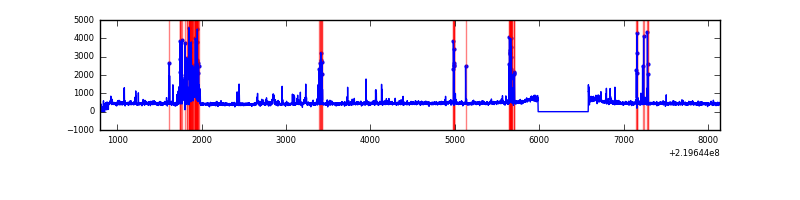 |
| C | 7330 | 6707 | 26 | 26 | 0.35% | 0.39% | 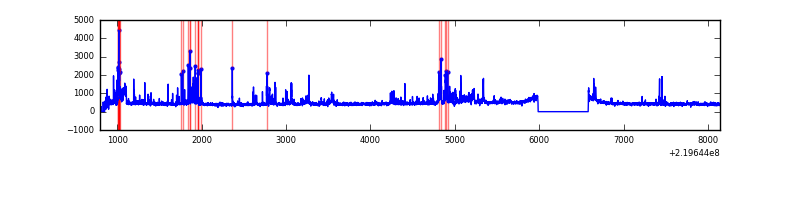 |
| D | 7301 | 6698 | 651 | 651 | 8.92% | 9.72% | 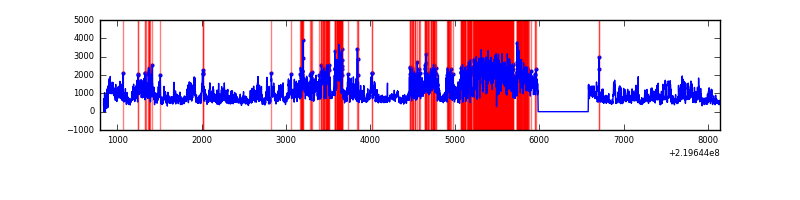 |
Top three noisy pixels from each quadrant. If the there are fewer than three noisy pixels in the level2.evt file, extra rows are filled as -1
| Pixel properties | Quadrant properties | ||||||
|---|---|---|---|---|---|---|---|
| Quadrant | DetID | PixID | Counts | Sigma | Mean | Median | Sigma |
| A | 8 | 15 | 13975 | 85.78 | 759 | 741 | 154.3 |
| A | 0 | 226 | 7232 | 42.07 | 759 | 741 | 154.3 |
| A | 12 | 194 | 6996 | 40.54 | 759 | 741 | 154.3 |
| B | 4 | 81 | 264623 | 1829.76 | 760 | 743 | 144.2 |
| B | 4 | 48 | 142549 | 983.29 | 760 | 743 | 144.2 |
| B | 0 | 219 | 103456 | 712.22 | 760 | 743 | 144.2 |
| C | 9 | 247 | 549635 | 3214.01 | 741 | 741 | 170.8 |
| C | 9 | 54 | 11579 | 63.46 | 741 | 741 | 170.8 |
| C | 1 | 16 | 6389 | 33.07 | 741 | 741 | 170.8 |
| D | 8 | 195 | 3289621 | 18922.44 | 706 | 684 | 173.8 |
| D | 2 | 63 | 596565 | 3428.32 | 706 | 684 | 173.8 |
| D | 2 | 152 | 199802 | 1145.6 | 706 | 684 | 173.8 |
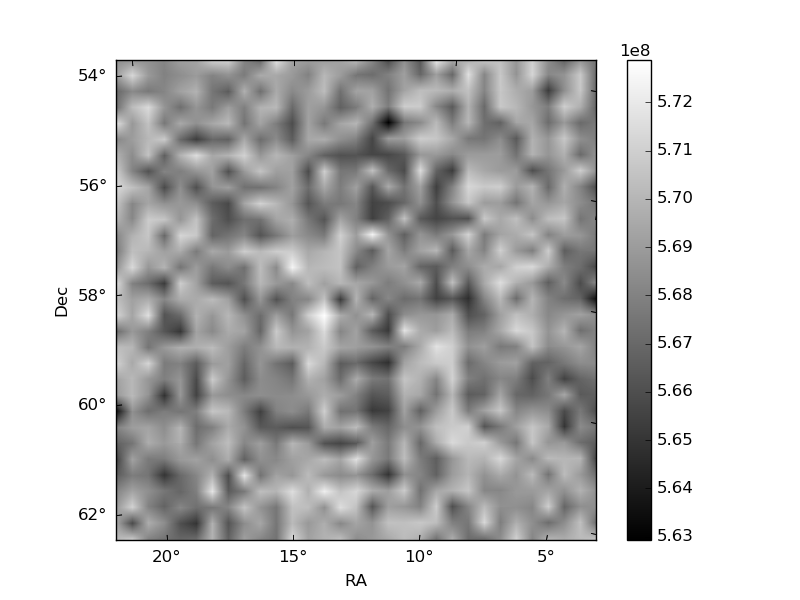
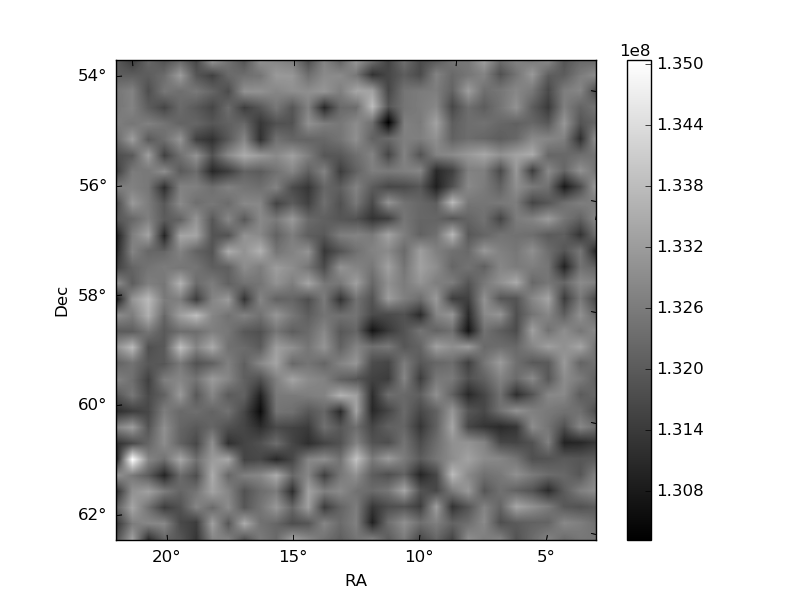
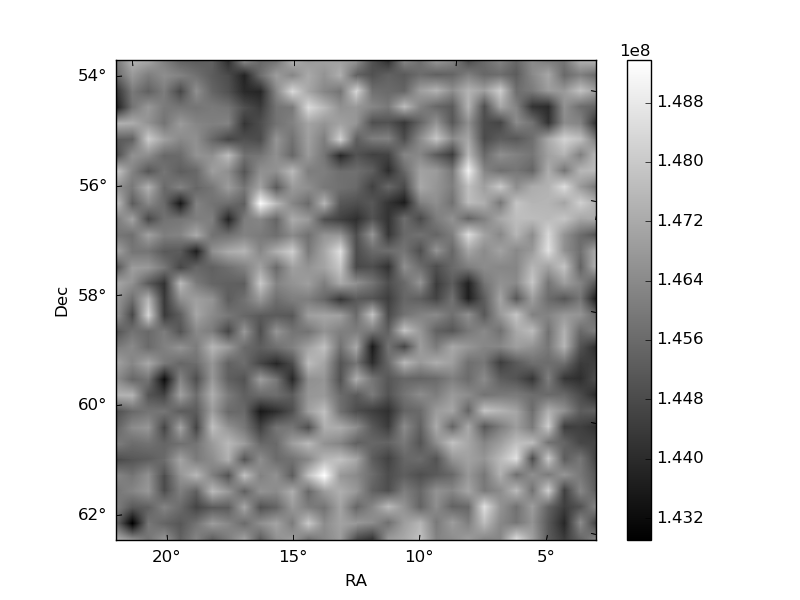
Histogram calculated using DETX and DETY for each event in the final _common_clean file
| Quadrant A | 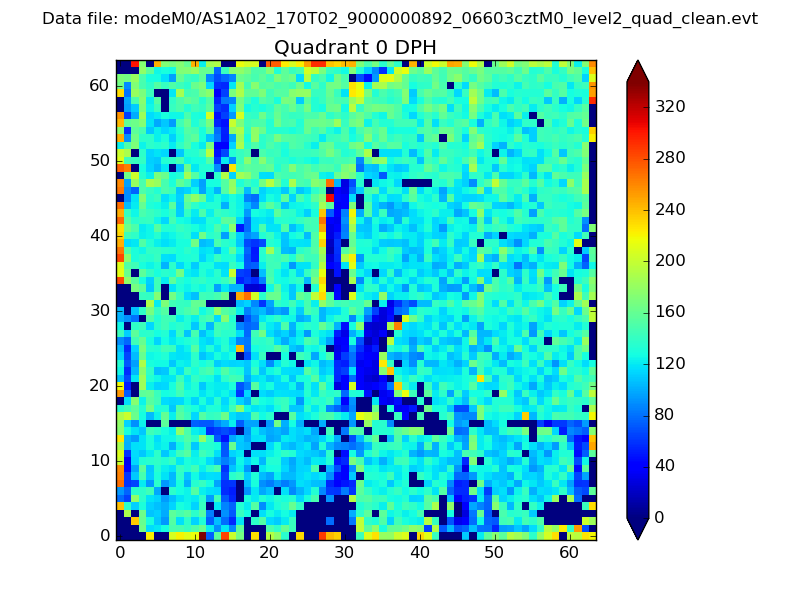 |
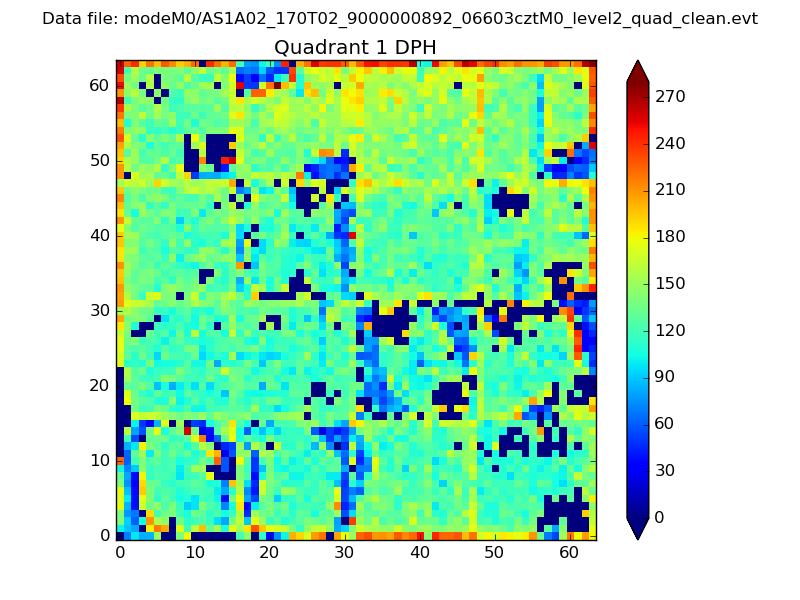 |
Quadrant B |
|---|---|---|---|
| Quadrant D | 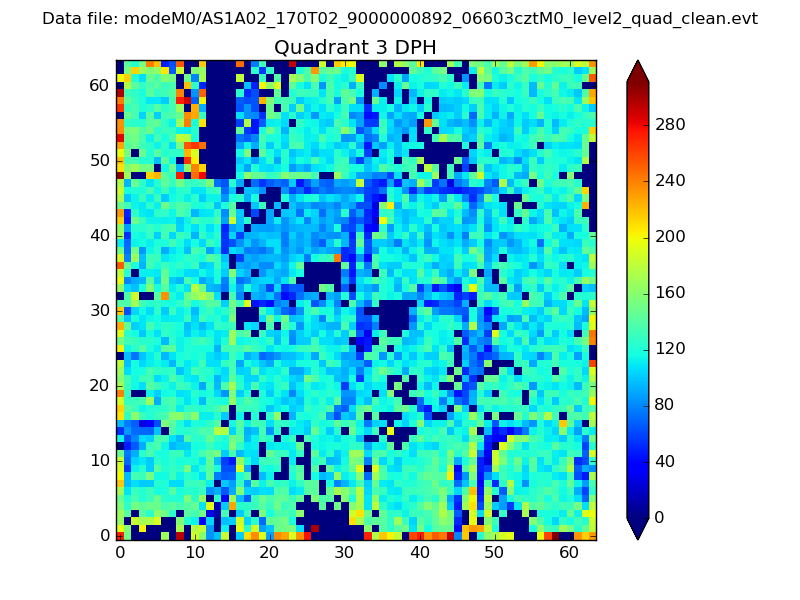 |
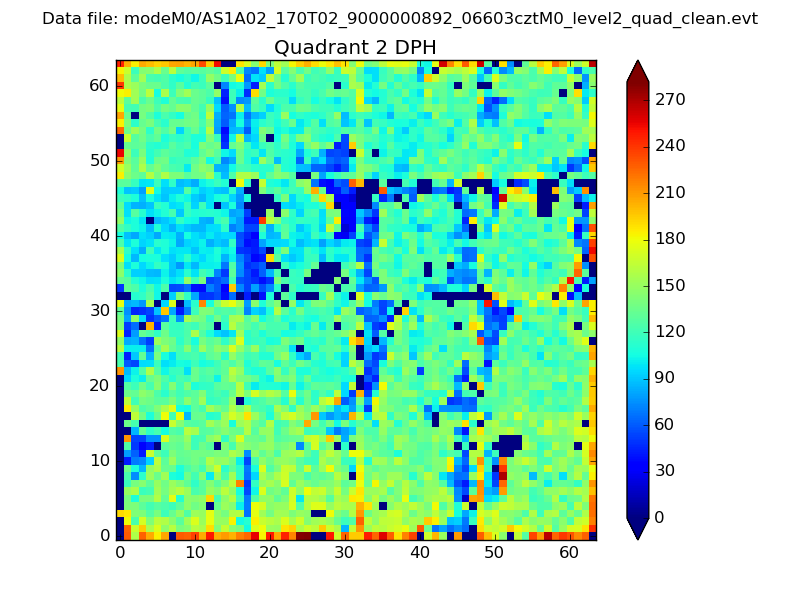 |
Quadrant C |
| Plot type | Count rate plots | Images |
|---|---|---|
| Comparison with Poisson distribution Blue bars denote a histogram of data divided into 1 sec bins. Red curve is a Poisson curve with rate = median count rate of data. |
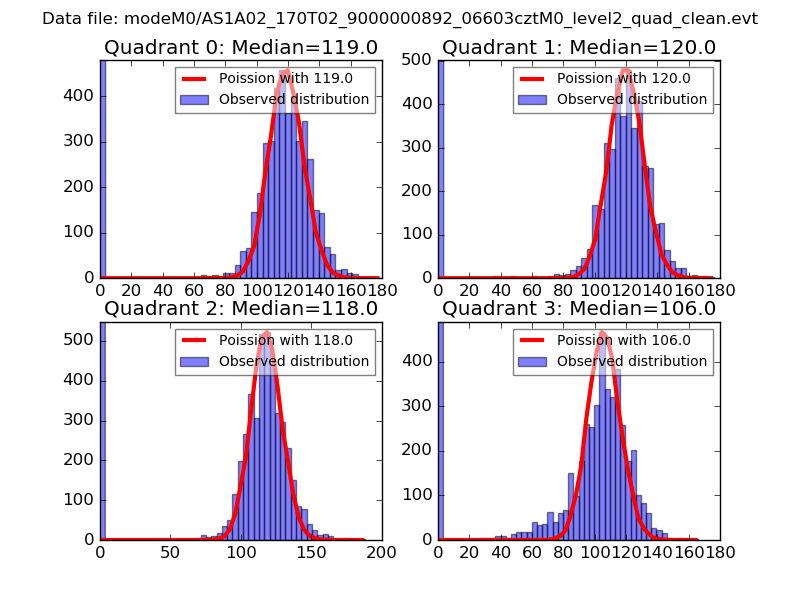 |
 |
| Quadrant-wise count rates Data is divided into 100 sec bins |
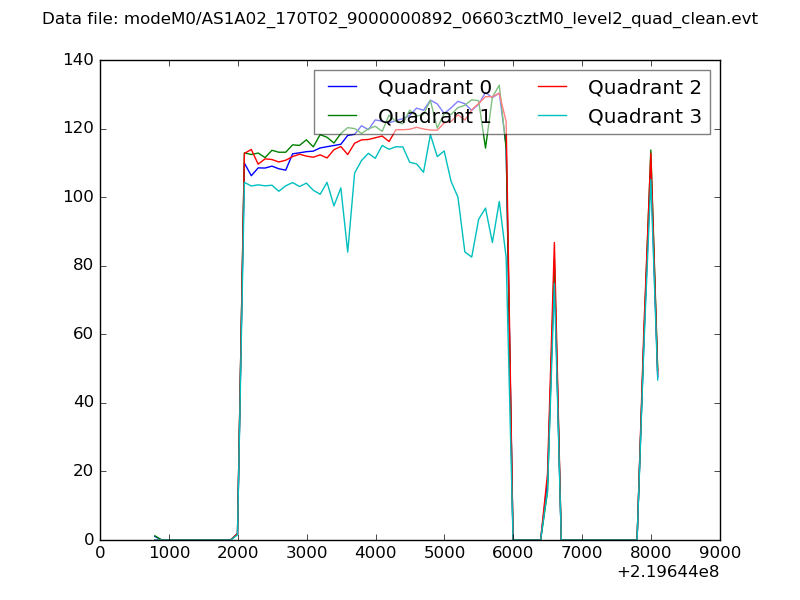 |
|
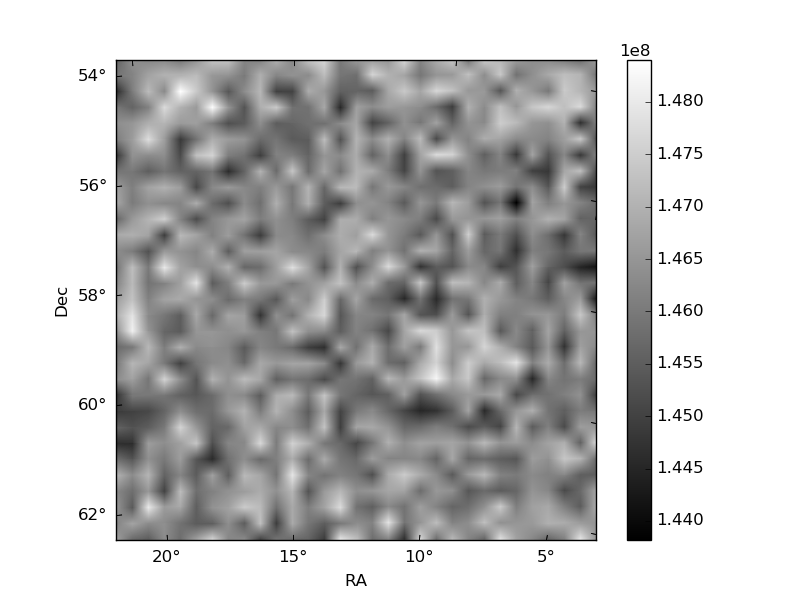
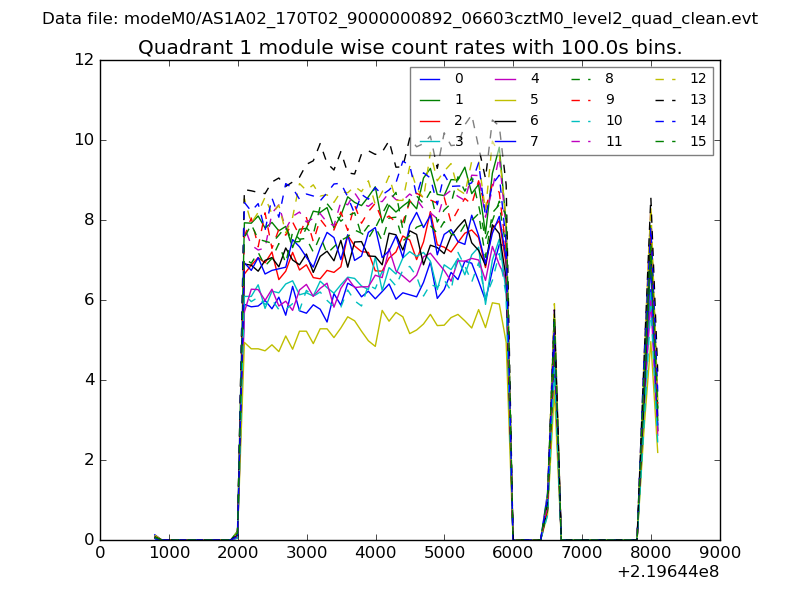
| Module-wise count rates for Quadrant A Data is divided into 100 sec bins |
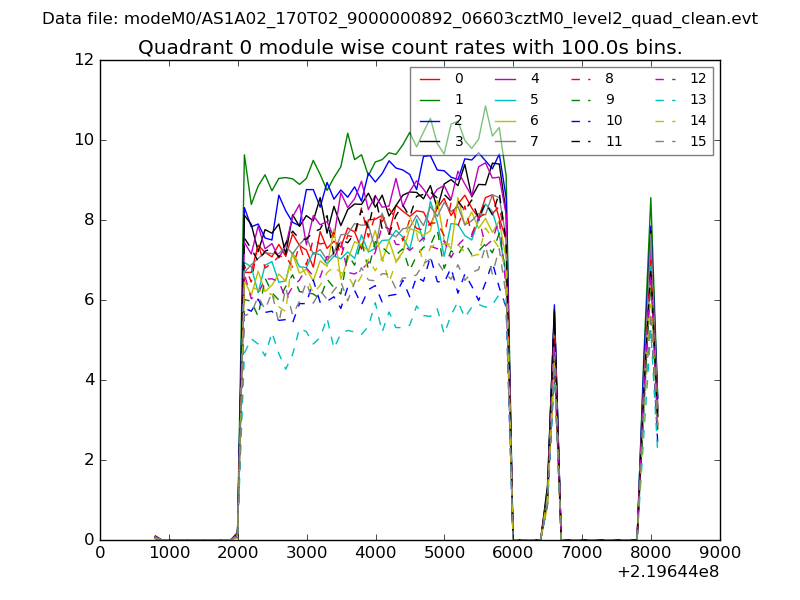 |
 |
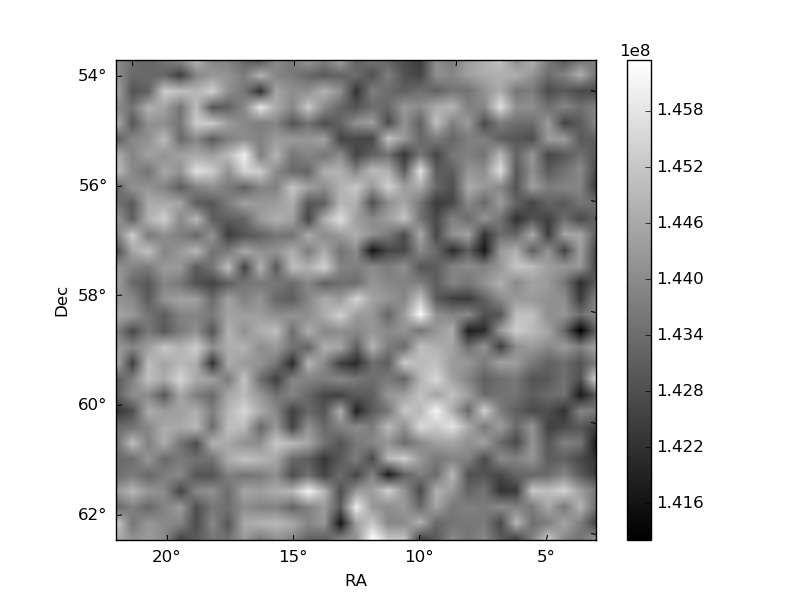
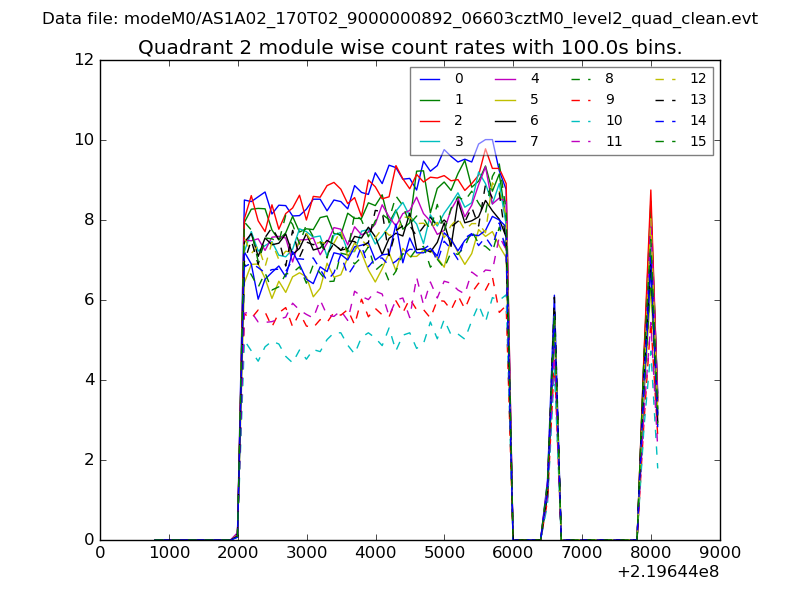
| Module-wise count rates for Quadrant B Data is divided into 100 sec bins |
 |
 |
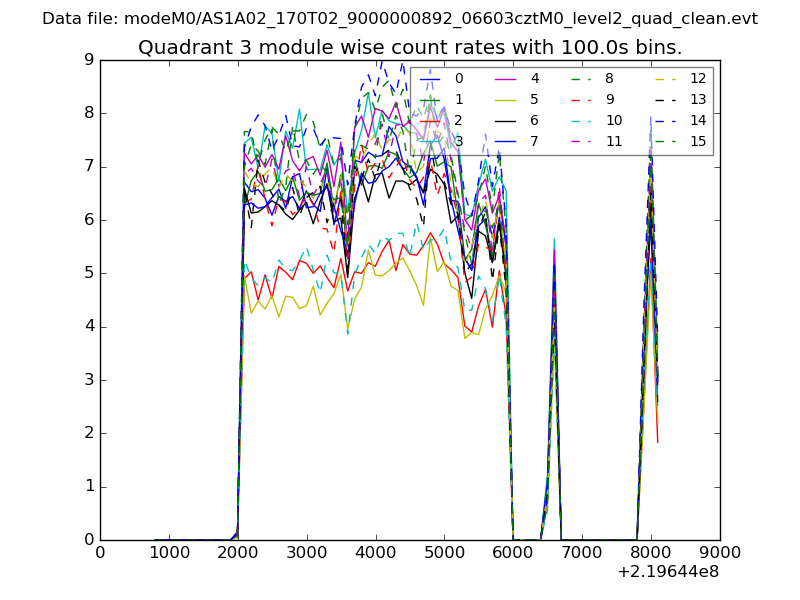
| Module-wise count rates for Quadrant C Data is divided into 100 sec bins |
 |
 |
| Module-wise count rates for Quadrant D Data is divided into 100 sec bins |
 |
 |
| Parameter | Plot |
|---|---|
| CZT HV Monitor | 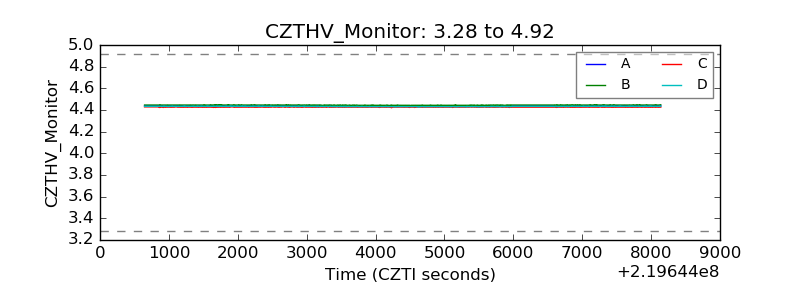 |
| D_VDD | 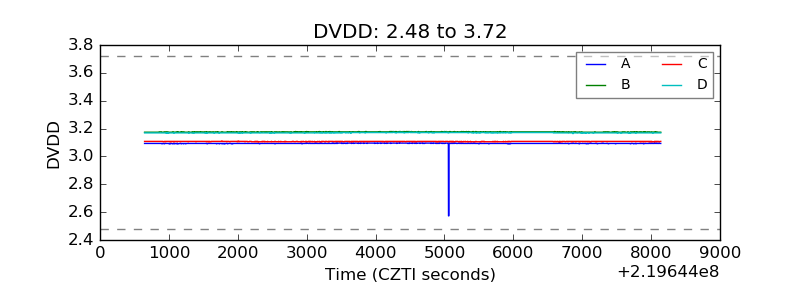 |
| Temperature 1 | 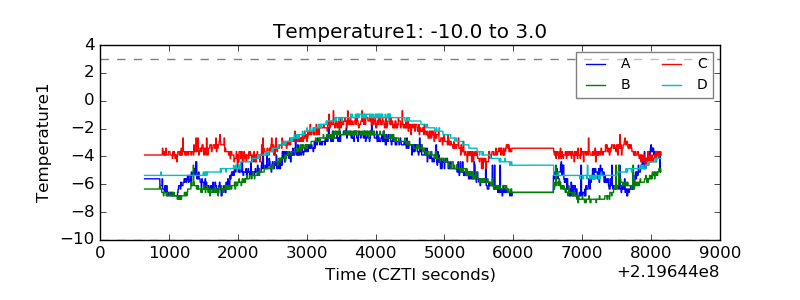 |
| Veto HV Monitor | 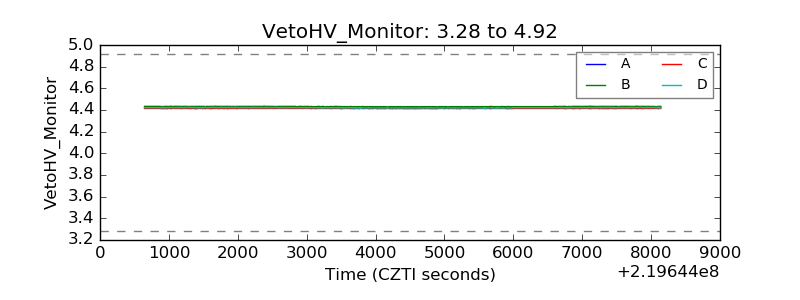 |
| Veto LLD | 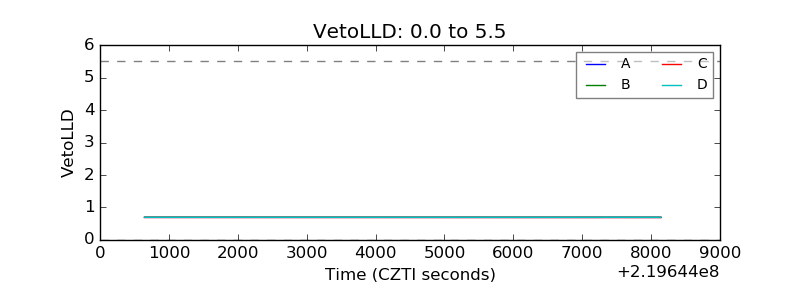 |
| Alpha Counter | 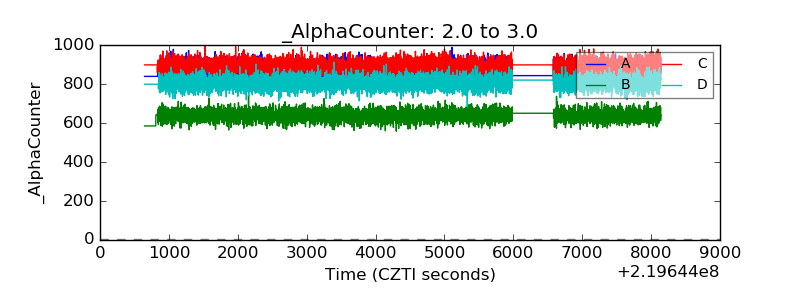 |
| _CPM_Rate | 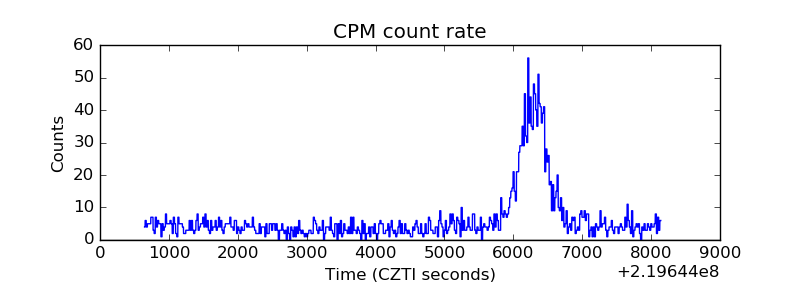 |
| CZT Counter | 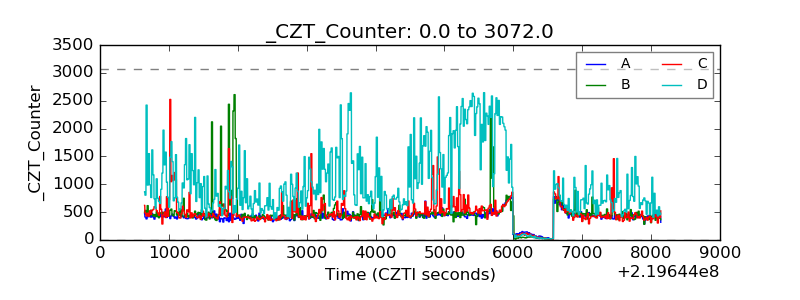 |
| +2.5 Volts monitor | 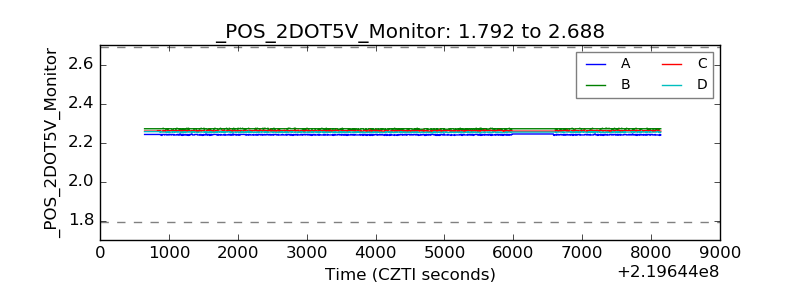 |
| +5 Volts monitor | 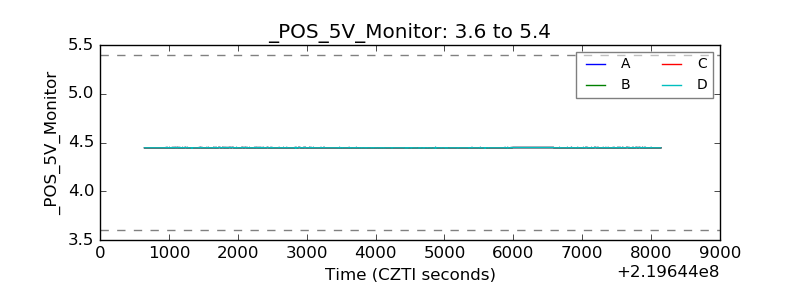 |
| _ROLL_ROT | 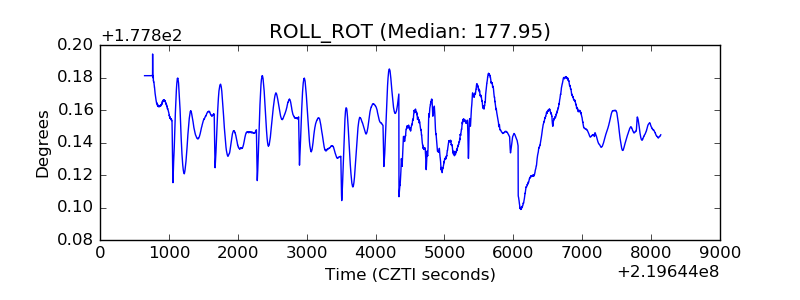 |
| _Roll_DEC | 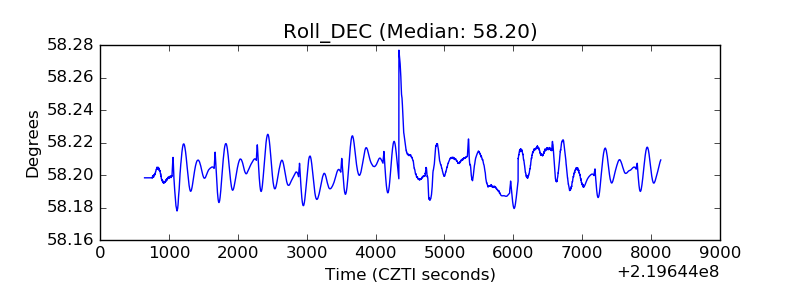 |
| _Roll_RA | 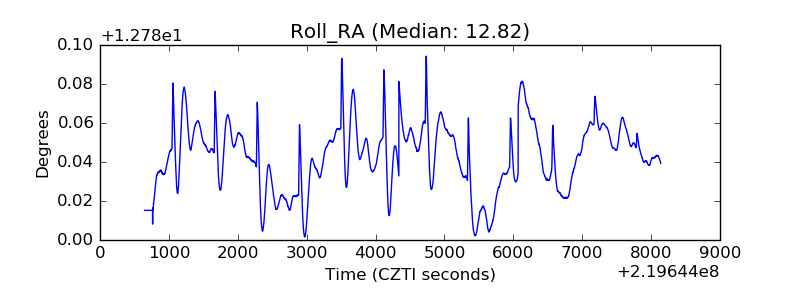 |
| Veto Counter | 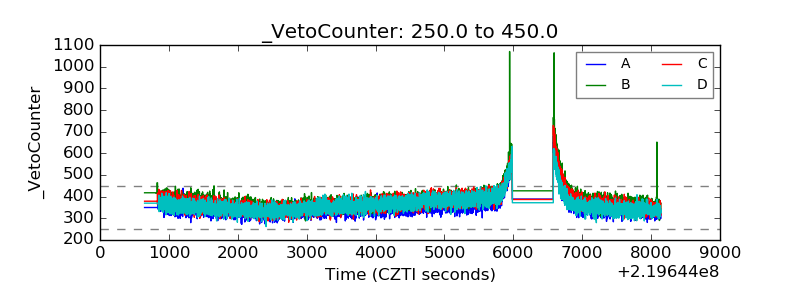 |