| Param | Original file | Final file |
|---|---|---|
| Filename | modeM0/AS1A02_170T02_9000000892_06604cztM0_level2.evt | modeM0/AS1A02_170T02_9000000892_06604cztM0_level2_quad_clean.evt |
| Size (bytes) | 526,034,880 | 95,981,760 |
| Size | 501.7 MB | 91.5 MB |
| Events in quadrant A | 3,211,319 | 607,881 |
| Events in quadrant B | 3,918,717 | 610,549 |
| Events in quadrant C | 3,170,834 | 605,322 |
| Events in quadrant D | 5,133,882 | 574,221 |
| Mode SS | |||
|---|---|---|---|
| Quadrant | BADHDUFLAG | Total packets | Discarded packets |
| A | 0 | 148 | 0 |
| B | 0 | 148 | 0 |
| C | 0 | 148 | 0 |
| D | 0 | 148 | 0 |
| Mode M9 | |||
|---|---|---|---|
| Quadrant | BADHDUFLAG | Total packets | Discarded packets |
| A | 0 | 2 | 0 |
| B | 0 | 2 | 0 |
| C | 0 | 2 | 0 |
| D | 0 | 2 | 0 |
| Mode M0 | |||
|---|---|---|---|
| Quadrant | BADHDUFLAG | Total packets | Discarded packets |
| A | 0 | 14880 | 2 |
| B | 0 | 16615 | 1 |
| C | 0 | 14926 | 1 |
| D | 0 | 20311 | 1 |
| Quadrant | Total seconds | Saturated seconds | Saturation percentage |
|---|---|---|---|
| A | 7309 | 139 | 1.901765% |
| B | 7309 | 295 | 4.036120% |
| C | 7309 | 67 | 0.916678% |
| D | 7309 | 167 | 2.284854% |
Noise dominated data is calculated using 1-second bins in cleaned event files. If a bin has >2000 counts, and if more than 50% of those come from <1% of pixels, then it is considered to be noise-dominated and hence unusable.
| Quadrant | # 1 sec bins | Bins with >0 counts | Bins with >2000 counts | High rate bins dominated by noise | Noise dominated (total time) | Noise dominated (detector-on time) | Marked lightcurve |
|---|---|---|---|---|---|---|---|
| A | 7499 | 7311 | 2 | 2 | 0.03% | 0.03% | 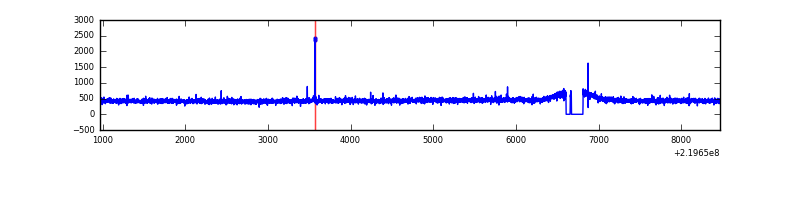 |
| B | 7499 | 7311 | 65 | 65 | 0.87% | 0.89% | 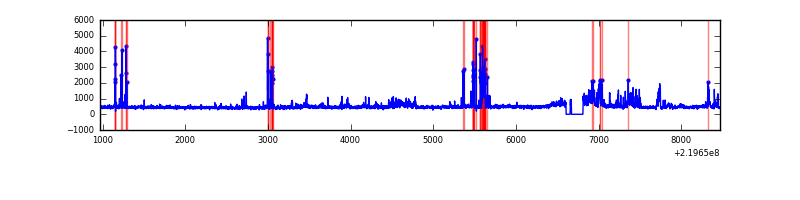 |
| C | 7499 | 7311 | 1 | 1 | 0.01% | 0.01% | 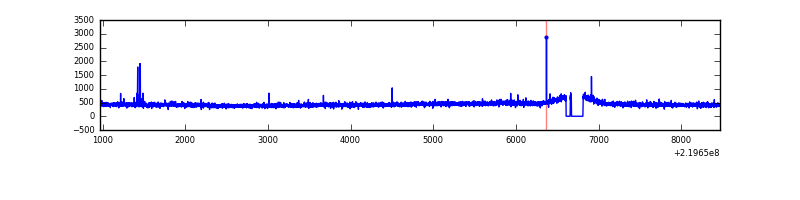 |
| D | 7499 | 7311 | 89 | 89 | 1.19% | 1.22% | 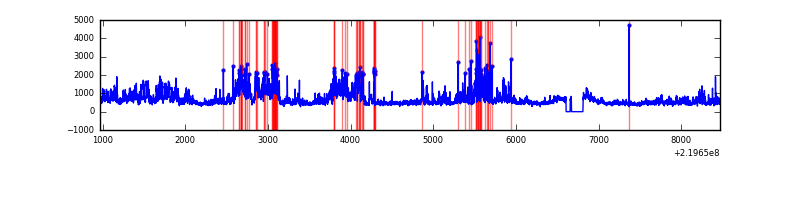 |
Top three noisy pixels from each quadrant. If the there are fewer than three noisy pixels in the level2.evt file, extra rows are filled as -1
| Pixel properties | Quadrant properties | ||||||
|---|---|---|---|---|---|---|---|
| Quadrant | DetID | PixID | Counts | Sigma | Mean | Median | Sigma |
| A | 8 | 15 | 19990 | 114.53 | 826 | 806 | 167.5 |
| A | 15 | 174 | 9682 | 52.99 | 826 | 806 | 167.5 |
| A | 0 | 226 | 8011 | 43.02 | 826 | 806 | 167.5 |
| B | 3 | 220 | 283350 | 1805.71 | 827 | 806 | 156.5 |
| B | 0 | 219 | 191377 | 1217.92 | 827 | 806 | 156.5 |
| B | 4 | 48 | 96490 | 611.5 | 827 | 806 | 156.5 |
| C | 9 | 247 | 19318 | 99.67 | 805 | 808 | 185.7 |
| C | 13 | 61 | 6204 | 29.06 | 805 | 808 | 185.7 |
| C | 9 | 54 | 5896 | 27.4 | 805 | 808 | 185.7 |
| D | 8 | 195 | 1287773 | 6498.14 | 799 | 771 | 198.1 |
| D | 13 | 105 | 425988 | 2146.94 | 799 | 771 | 198.1 |
| D | 2 | 152 | 141755 | 711.83 | 799 | 771 | 198.1 |
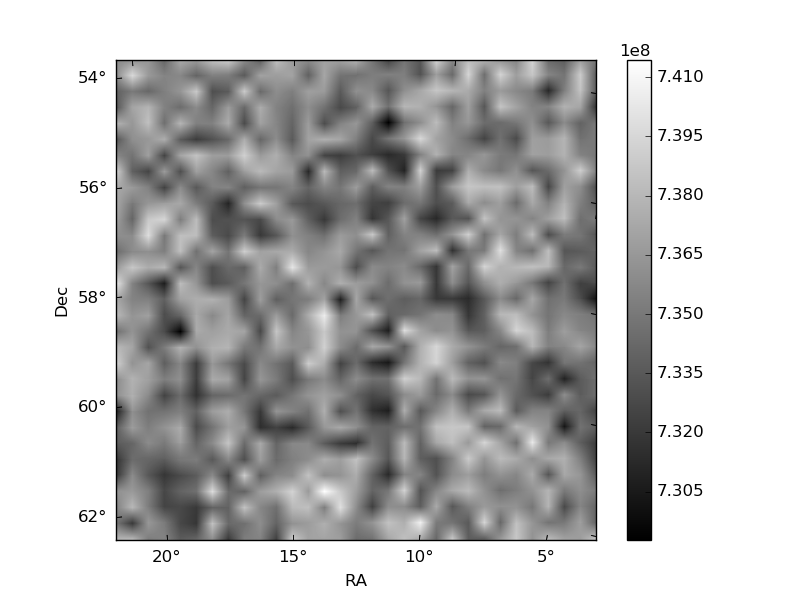
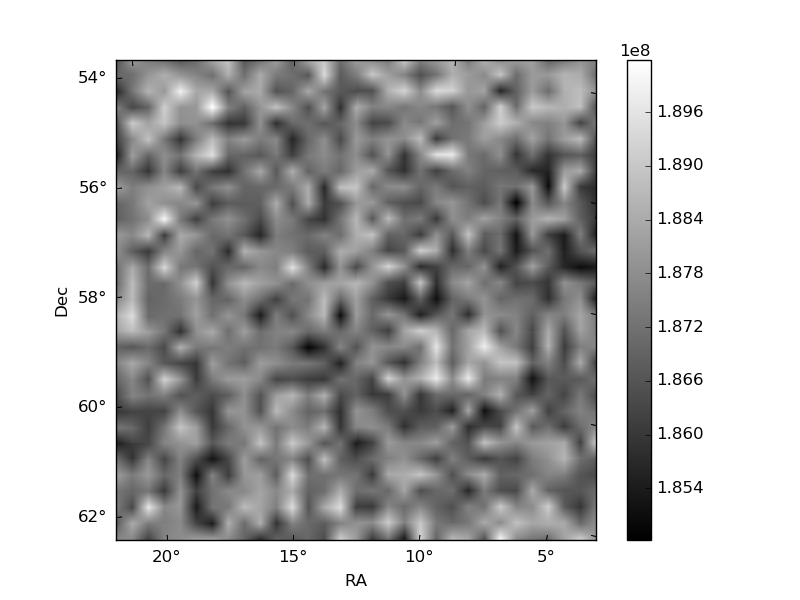
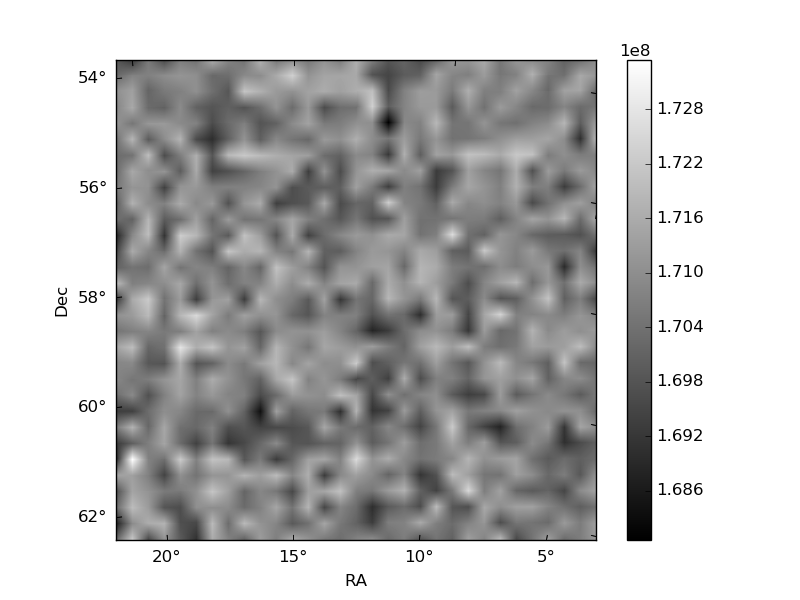
Histogram calculated using DETX and DETY for each event in the final _common_clean file
| Quadrant A | 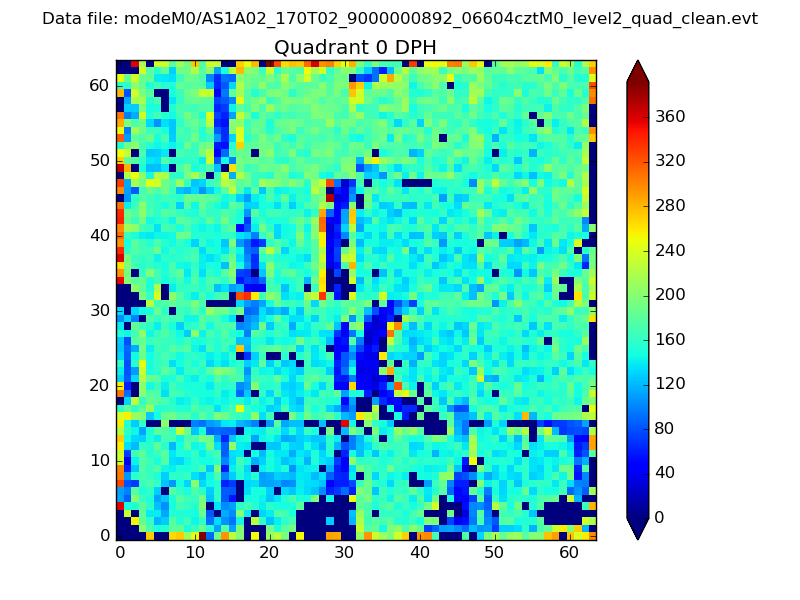 |
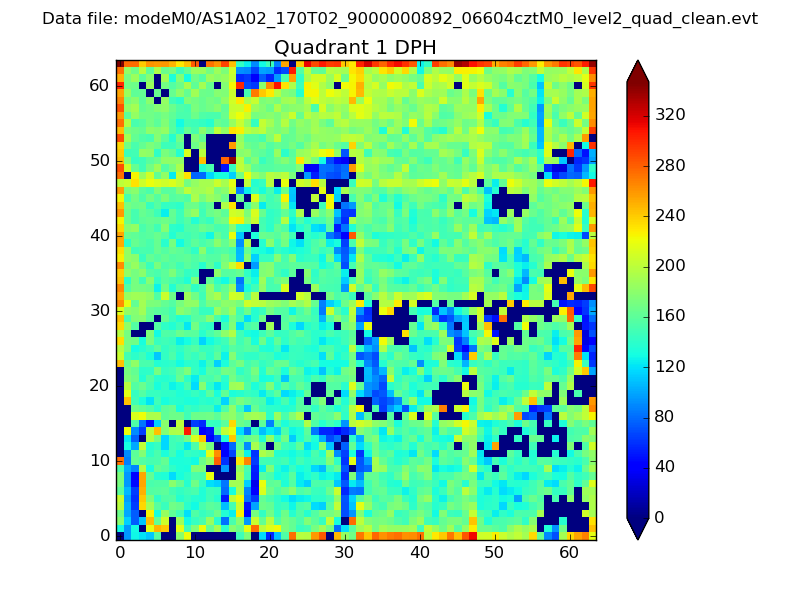 |
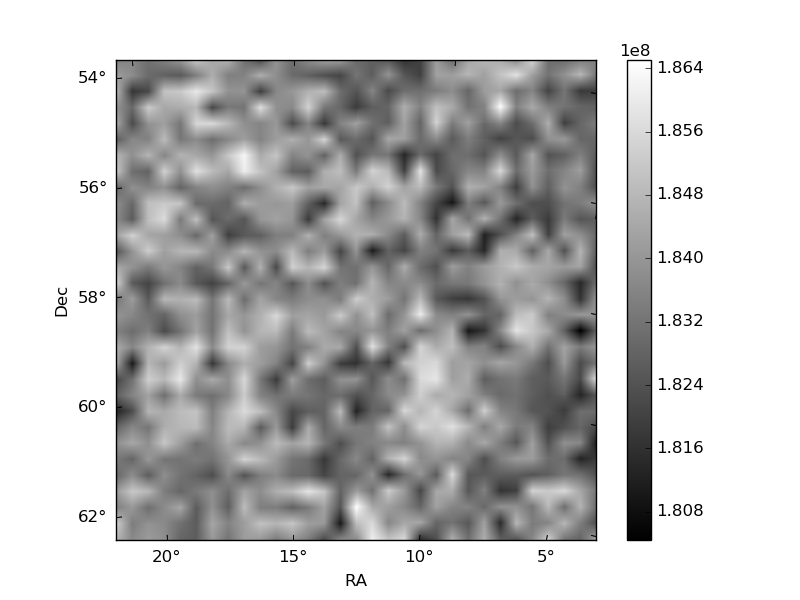
Quadrant B |
|---|---|---|---|
| Quadrant D | 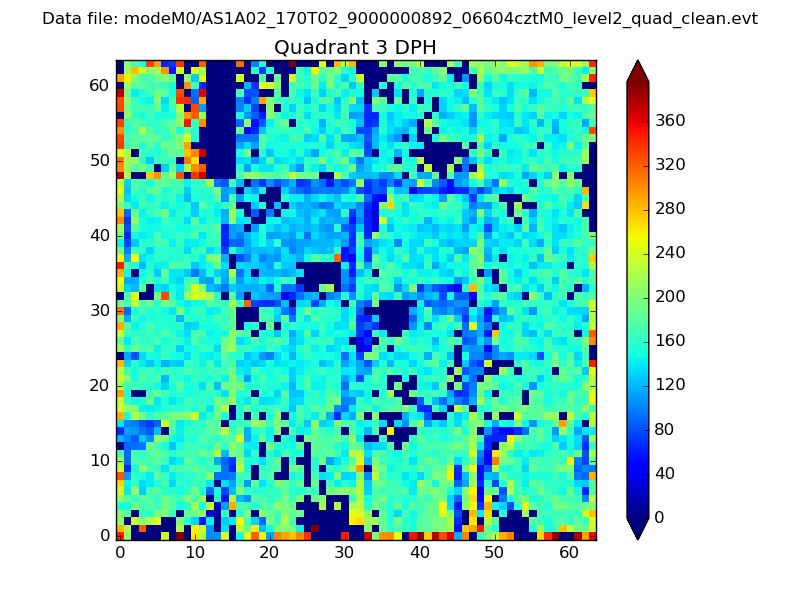 |
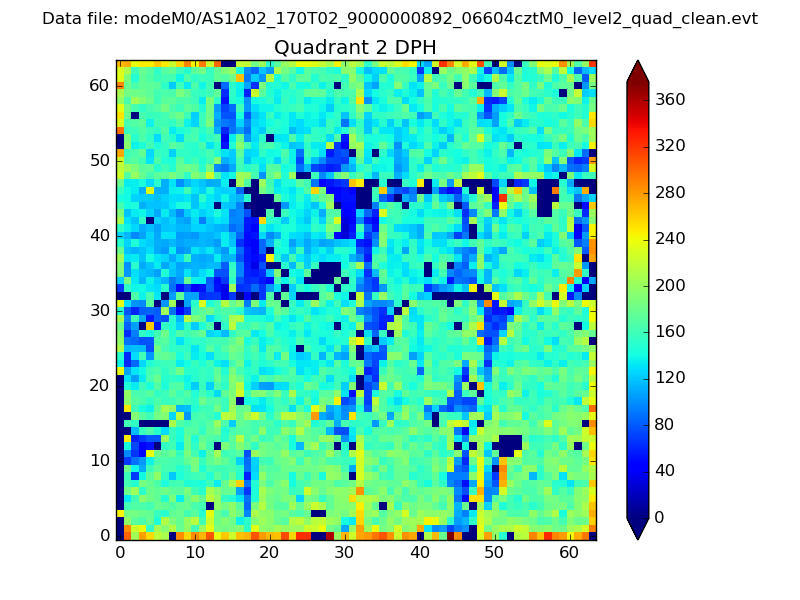 |
Quadrant C |
| Plot type | Count rate plots | Images |
|---|---|---|
| Comparison with Poisson distribution Blue bars denote a histogram of data divided into 1 sec bins. Red curve is a Poisson curve with rate = median count rate of data. |
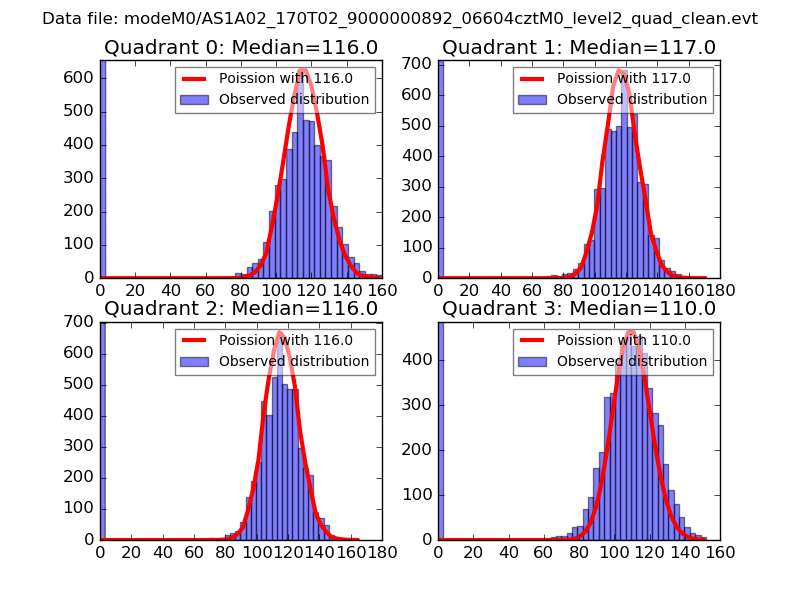 |
 |
| Quadrant-wise count rates Data is divided into 100 sec bins |
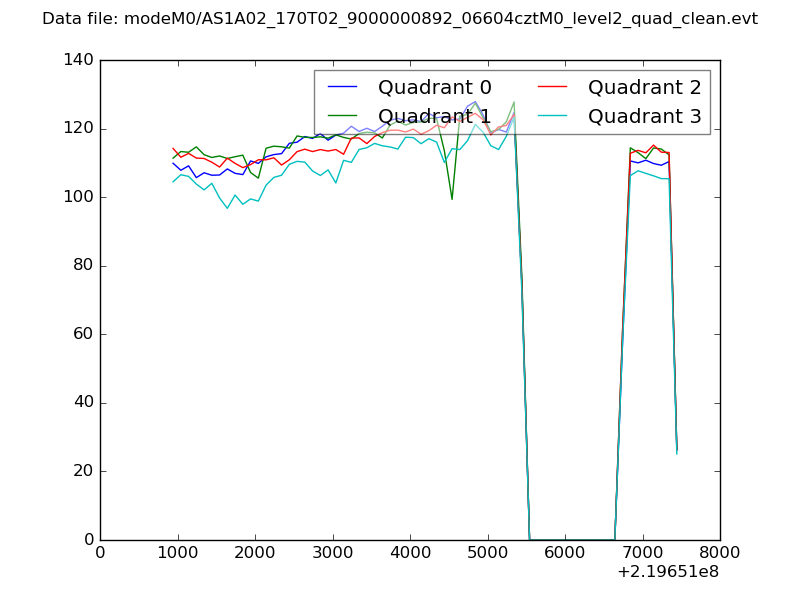 |
|
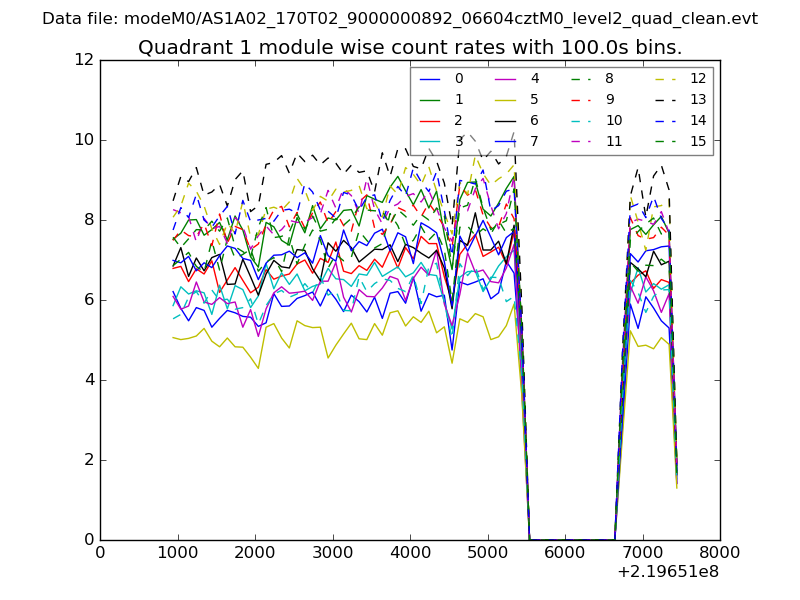
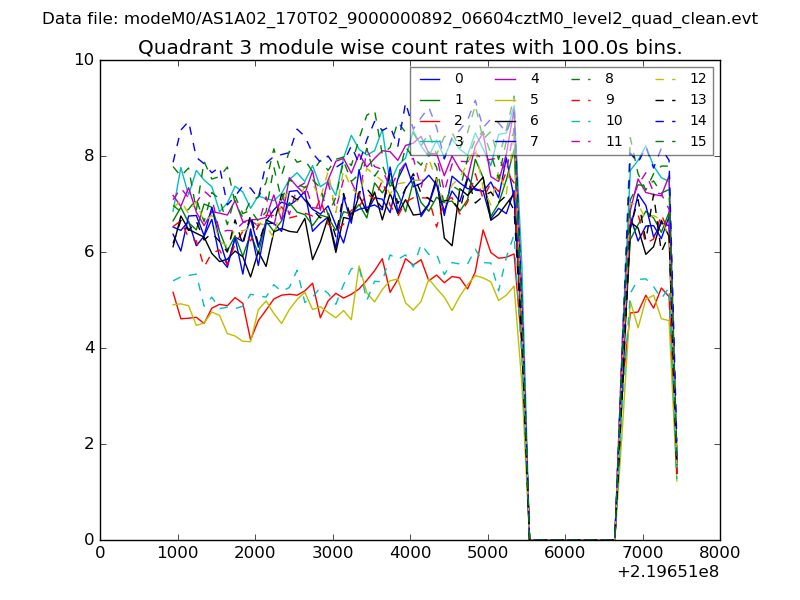
| Module-wise count rates for Quadrant A Data is divided into 100 sec bins |
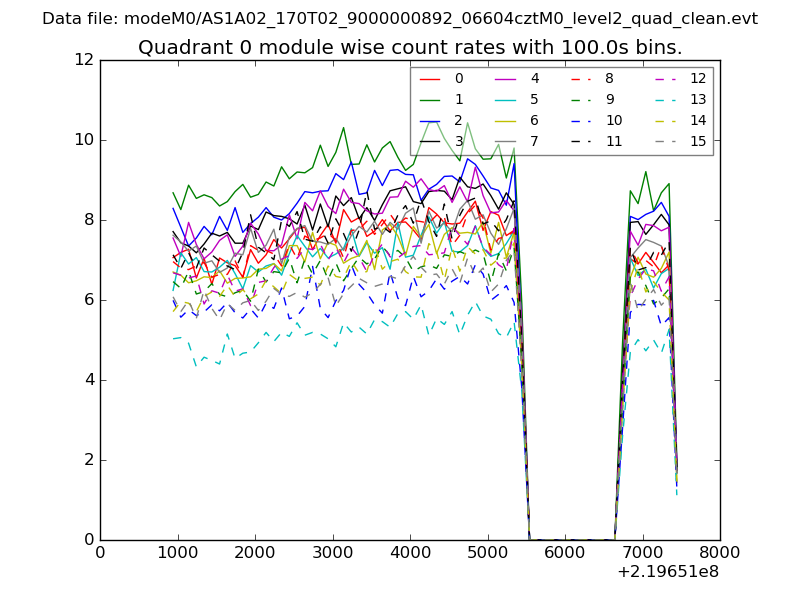 |
 |
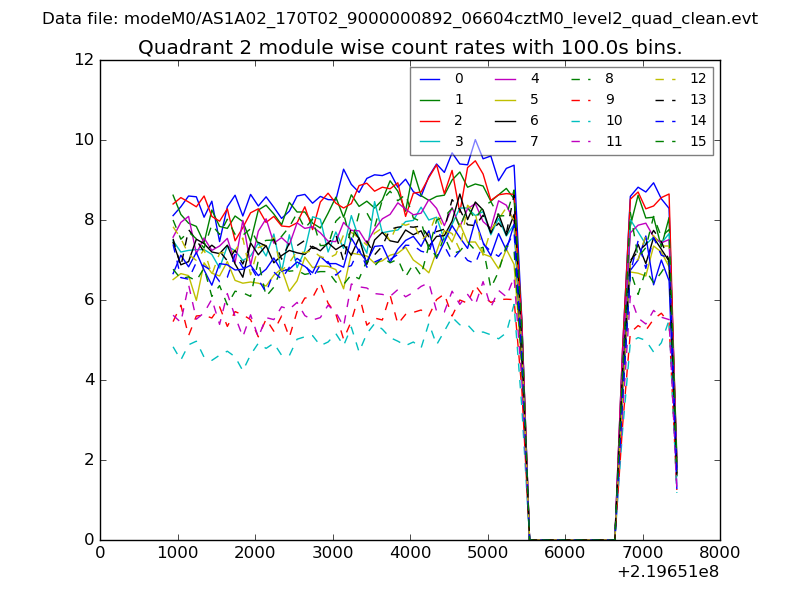
| Module-wise count rates for Quadrant B Data is divided into 100 sec bins |
 |
 |
| Module-wise count rates for Quadrant C Data is divided into 100 sec bins |
 |
 |
| Module-wise count rates for Quadrant D Data is divided into 100 sec bins |
 |
 |
| Parameter | Plot |
|---|---|
| CZT HV Monitor | 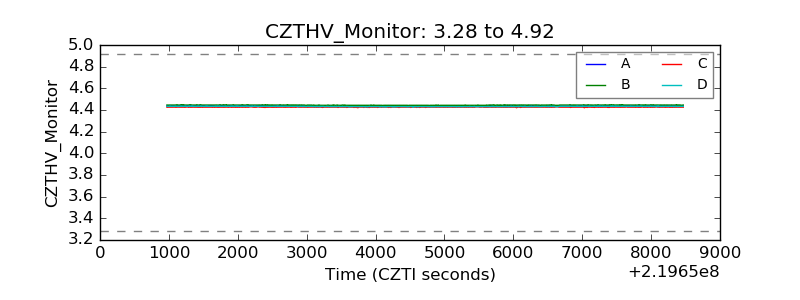 |
| D_VDD | 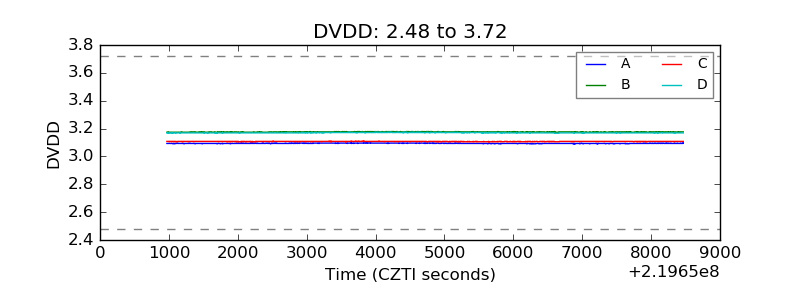 |
| Temperature 1 | 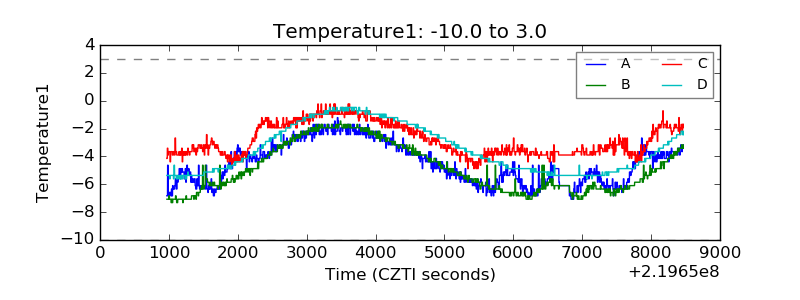 |
| Veto HV Monitor | 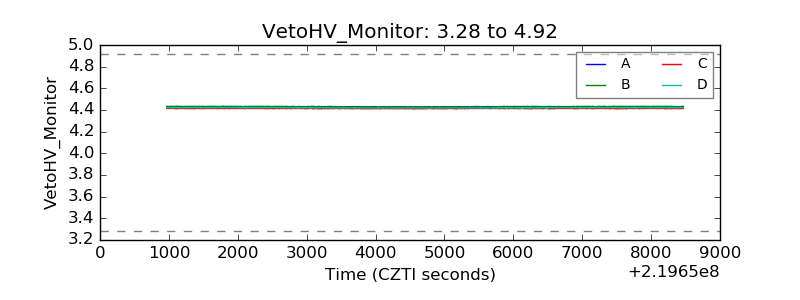 |
| Veto LLD | 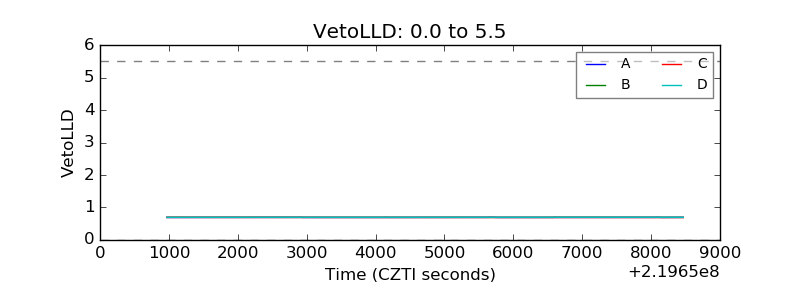 |
| Alpha Counter | 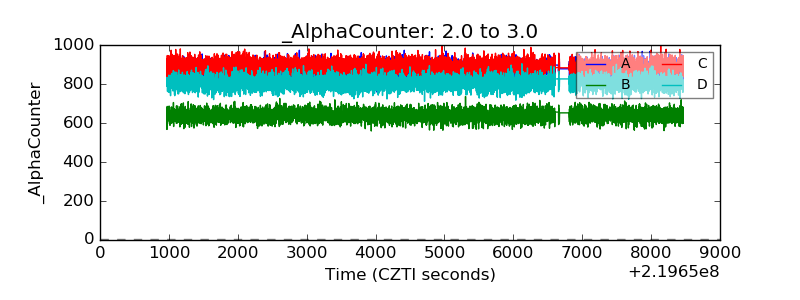 |
| _CPM_Rate | 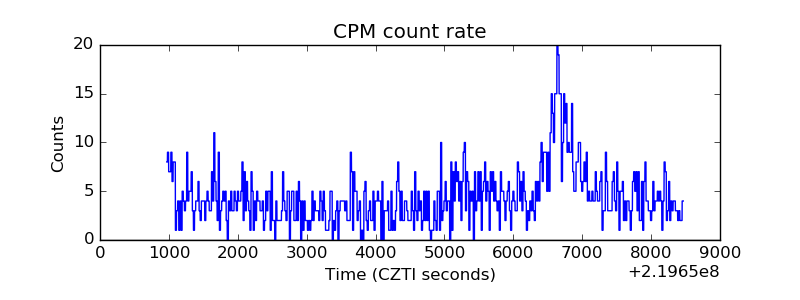 |
| CZT Counter | 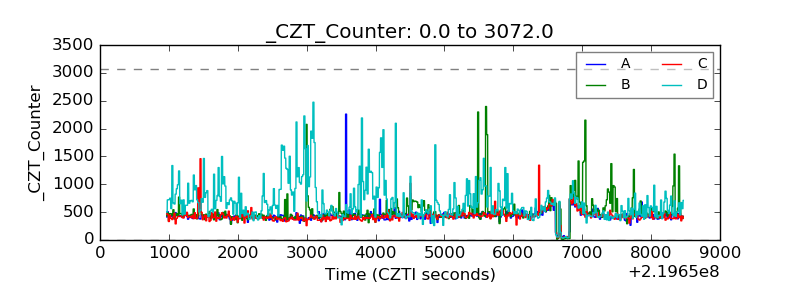 |
| +2.5 Volts monitor |  |
| +5 Volts monitor |  |
| _ROLL_ROT | 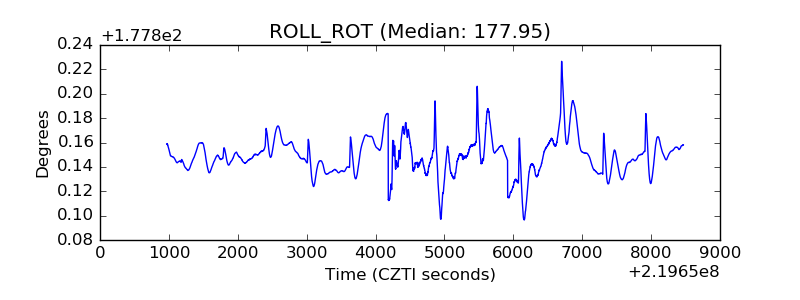 |
| _Roll_DEC | 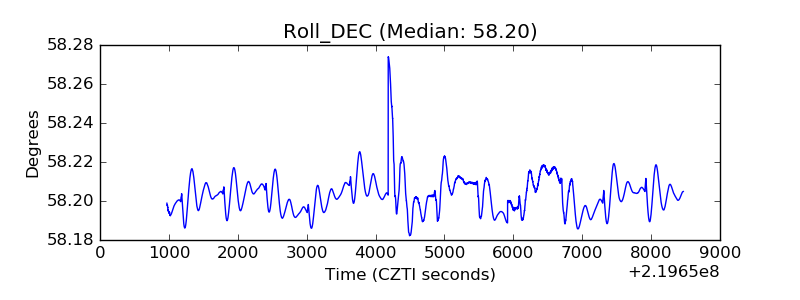 |
| _Roll_RA | 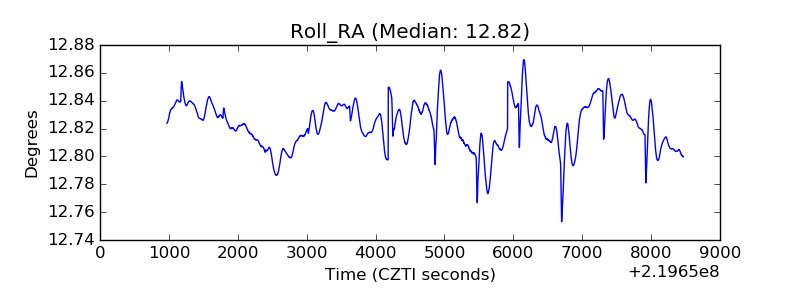 |
| Veto Counter | 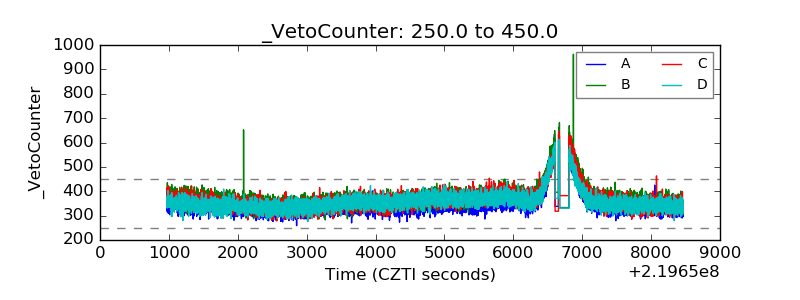 |