| Param | Original file | Final file |
|---|---|---|
| Filename | modeM0/AS1A02_170T02_9000000892_06605cztM0_level2.evt | modeM0/AS1A02_170T02_9000000892_06605cztM0_level2_quad_clean.evt |
| Size (bytes) | 524,275,200 | 101,940,480 |
| Size | 500.0 MB | 97.2 MB |
| Events in quadrant A | 3,164,439 | 661,269 |
| Events in quadrant B | 3,793,522 | 660,356 |
| Events in quadrant C | 3,082,916 | 658,339 |
| Events in quadrant D | 5,356,093 | 614,200 |
| Mode SS | |||
|---|---|---|---|
| Quadrant | BADHDUFLAG | Total packets | Discarded packets |
| A | 0 | 144 | 0 |
| B | 0 | 144 | 0 |
| C | 0 | 144 | 0 |
| D | 0 | 144 | 0 |
| Mode M0 | |||
|---|---|---|---|
| Quadrant | BADHDUFLAG | Total packets | Discarded packets |
| A | 0 | 14512 | 3 |
| B | 0 | 15990 | 2 |
| C | 0 | 14469 | 2 |
| D | 0 | 20876 | 2 |
| Quadrant | Total seconds | Saturated seconds | Saturation percentage |
|---|---|---|---|
| A | 7070 | 213 | 3.012730% |
| B | 7070 | 315 | 4.455446% |
| C | 7070 | 92 | 1.301273% |
| D | 7070 | 364 | 5.148515% |
Noise dominated data is calculated using 1-second bins in cleaned event files. If a bin has >2000 counts, and if more than 50% of those come from <1% of pixels, then it is considered to be noise-dominated and hence unusable.
| Quadrant | # 1 sec bins | Bins with >0 counts | Bins with >2000 counts | High rate bins dominated by noise | Noise dominated (total time) | Noise dominated (detector-on time) | Marked lightcurve |
|---|---|---|---|---|---|---|---|
| A | 7135 | 7072 | 0 | 0 | 0.00% | 0.00% | 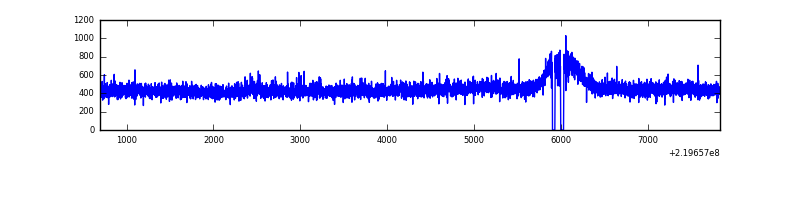 |
| B | 7135 | 7072 | 72 | 72 | 1.01% | 1.02% | 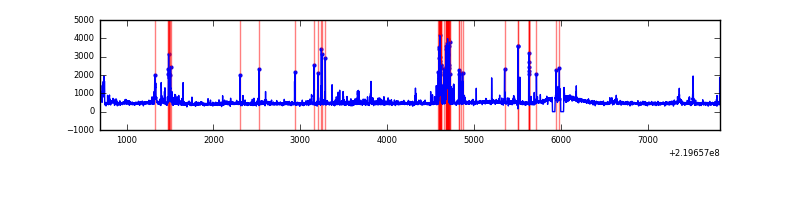 |
| C | 7135 | 7072 | 0 | 0 | 0.00% | 0.00% | 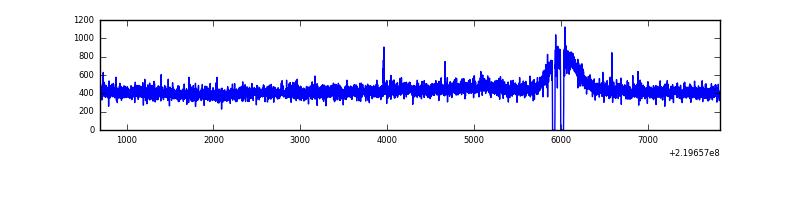 |
| D | 7135 | 7072 | 194 | 194 | 2.72% | 2.74% | 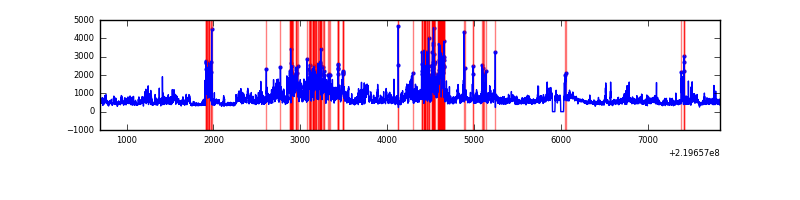 |
Top three noisy pixels from each quadrant. If the there are fewer than three noisy pixels in the level2.evt file, extra rows are filled as -1
| Pixel properties | Quadrant properties | ||||||
|---|---|---|---|---|---|---|---|
| Quadrant | DetID | PixID | Counts | Sigma | Mean | Median | Sigma |
| A | 8 | 15 | 29902 | 174.46 | 813 | 793 | 166.8 |
| A | 12 | 194 | 8126 | 43.95 | 813 | 793 | 166.8 |
| A | 0 | 226 | 7995 | 43.16 | 813 | 793 | 166.8 |
| B | 0 | 219 | 306462 | 1977.08 | 810 | 789 | 154.6 |
| B | 3 | 220 | 180584 | 1162.91 | 810 | 789 | 154.6 |
| B | 4 | 81 | 35418 | 223.98 | 810 | 789 | 154.6 |
| C | 13 | 61 | 6338 | 30.37 | 788 | 788 | 182.7 |
| C | 12 | 4 | 5069 | 23.43 | 788 | 788 | 182.7 |
| C | 1 | 16 | 3359 | 14.07 | 788 | 788 | 182.7 |
| D | 8 | 195 | 1317156 | 6865.76 | 778 | 749 | 191.7 |
| D | 2 | 33 | 334087 | 1738.53 | 778 | 749 | 191.7 |
| D | 14 | 34 | 293269 | 1525.65 | 778 | 749 | 191.7 |
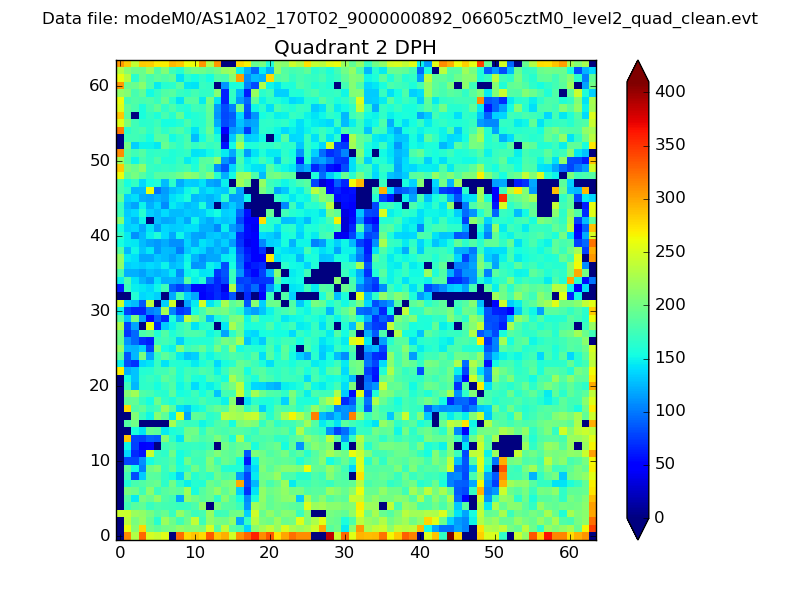
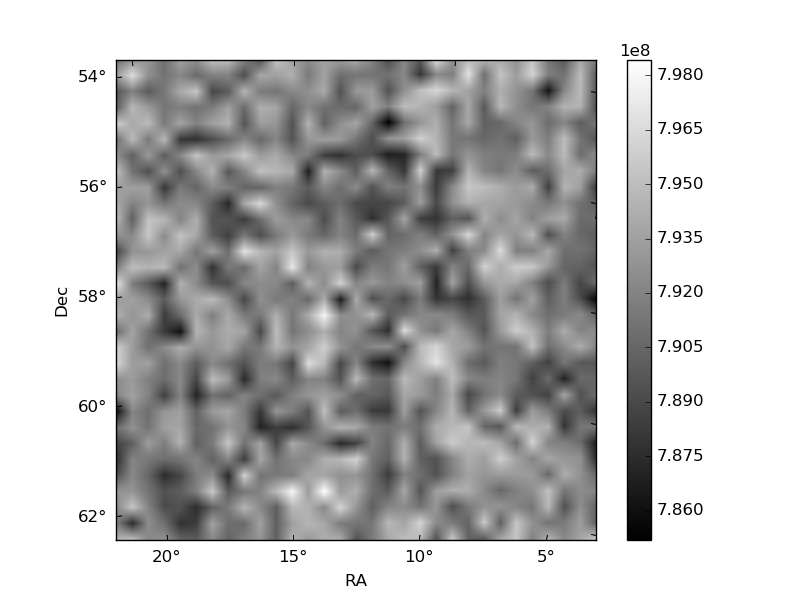
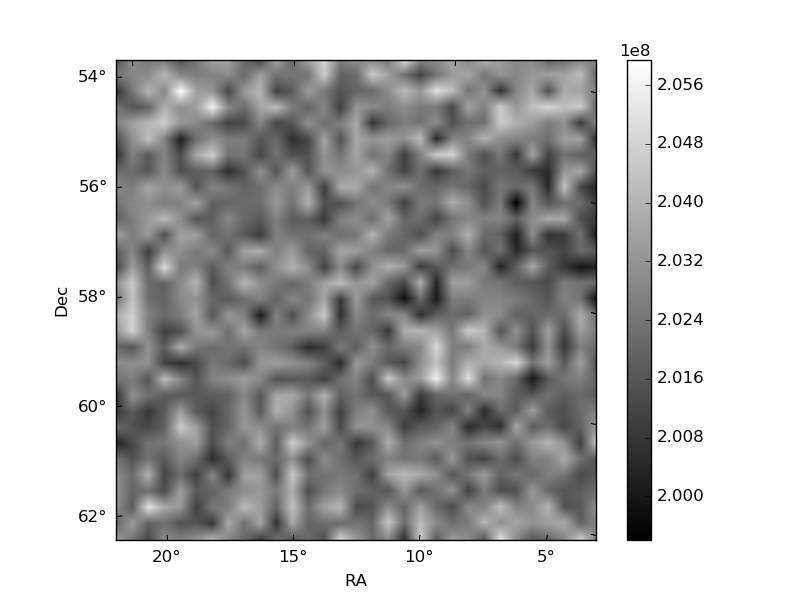
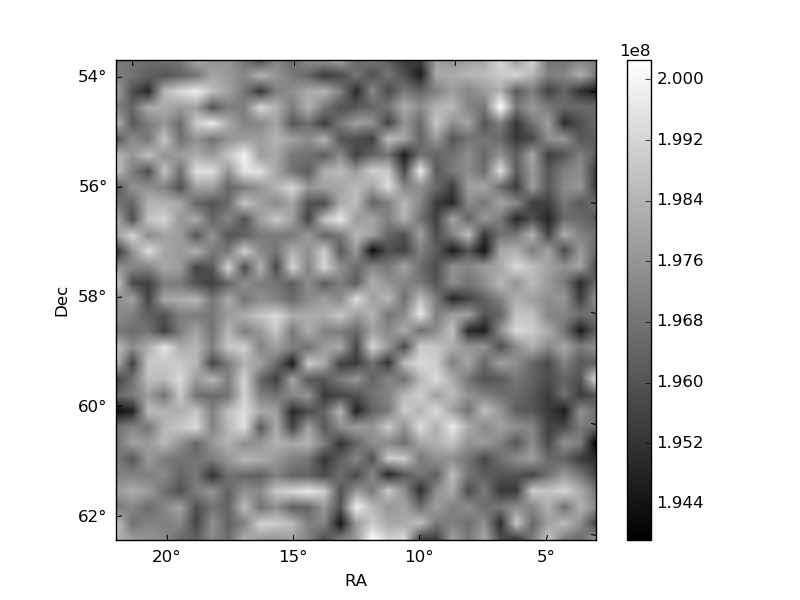
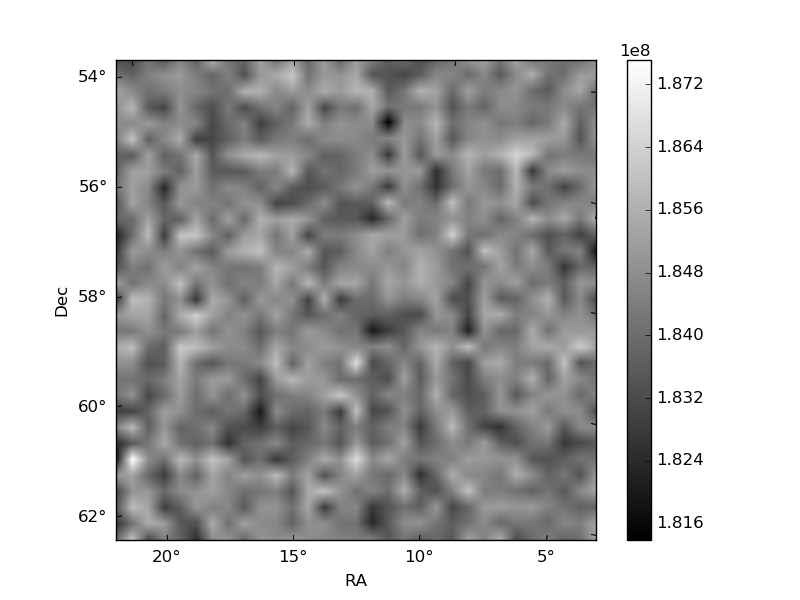
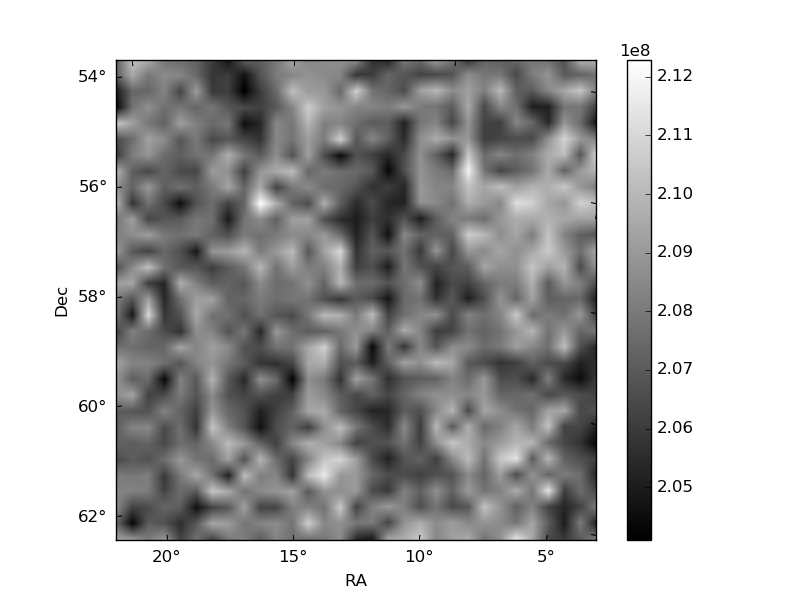
Histogram calculated using DETX and DETY for each event in the final _common_clean file
| Quadrant A | 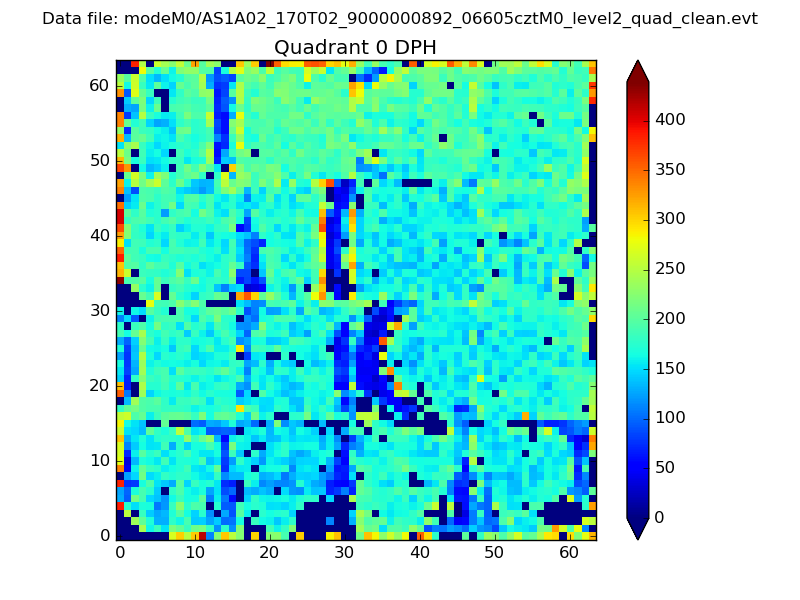 |
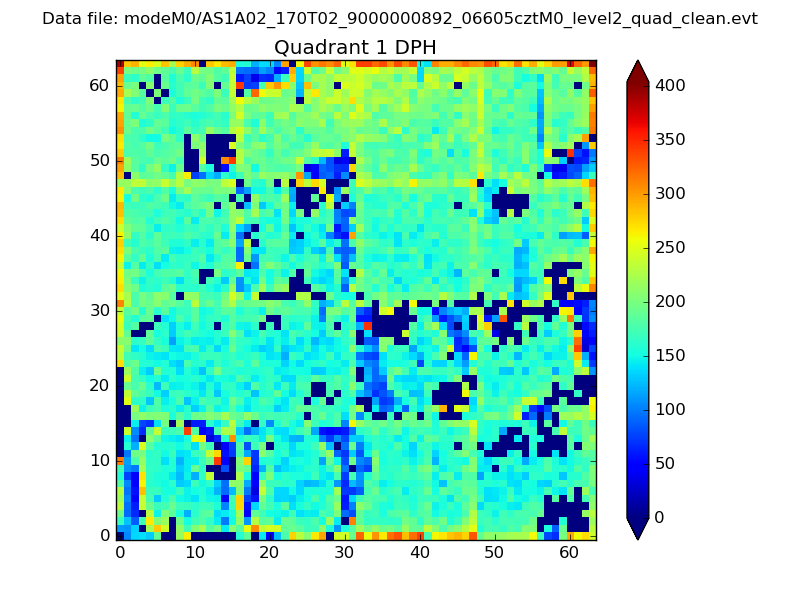 |
Quadrant B |
|---|---|---|---|
| Quadrant D | 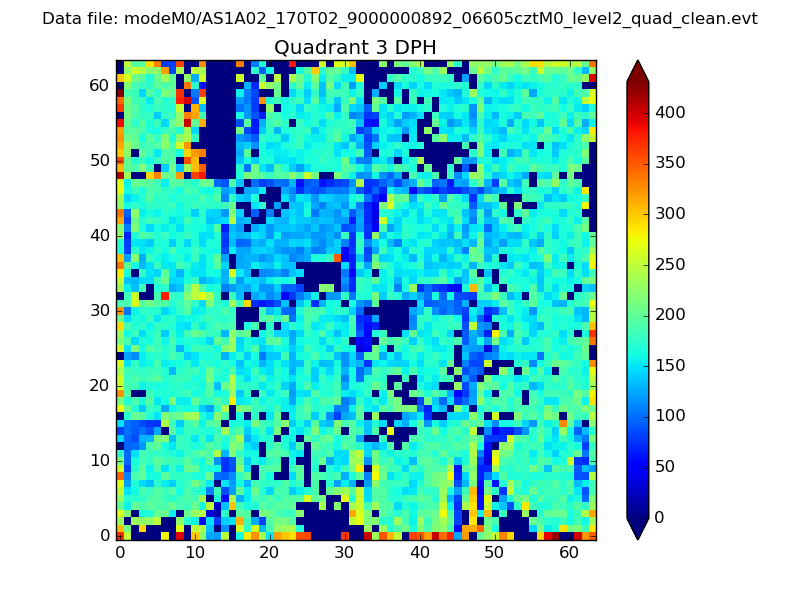 |
 |
Quadrant C |
| Plot type | Count rate plots | Images |
|---|---|---|
| Comparison with Poisson distribution Blue bars denote a histogram of data divided into 1 sec bins. Red curve is a Poisson curve with rate = median count rate of data. |
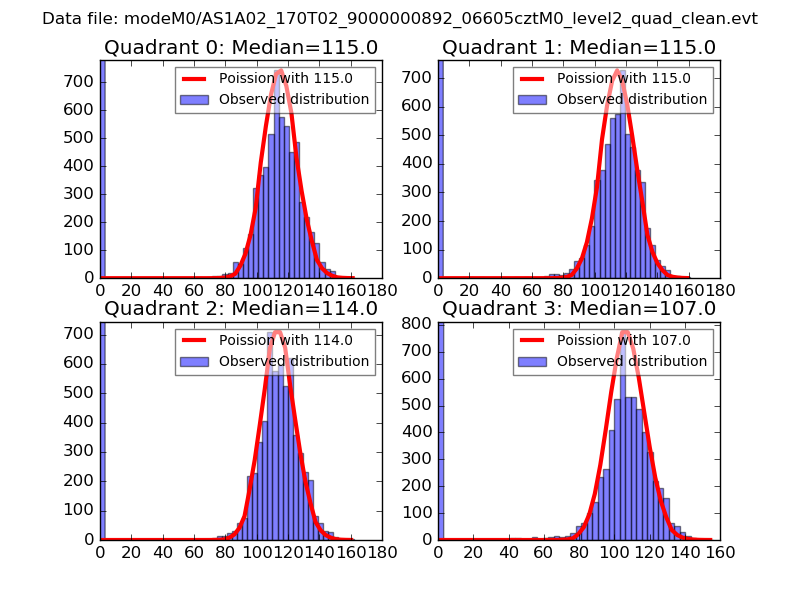 |
 |
| Quadrant-wise count rates Data is divided into 100 sec bins |
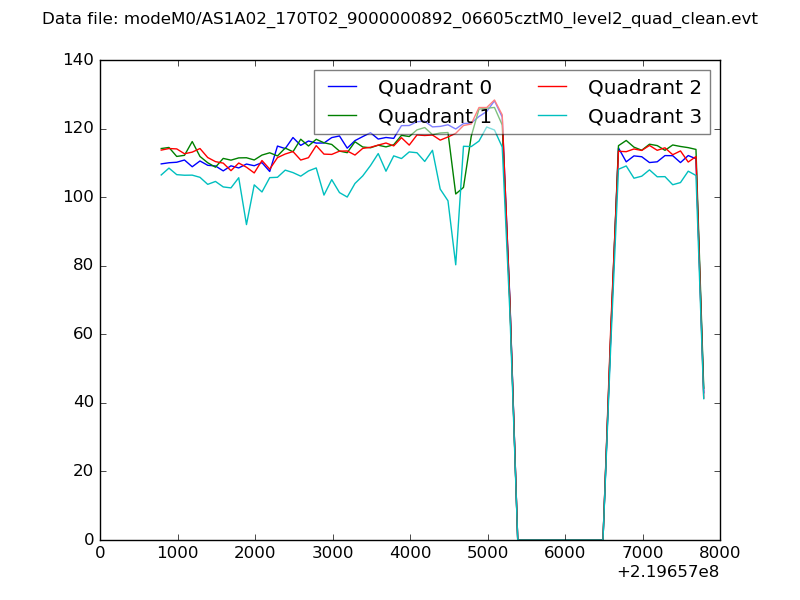 |
|
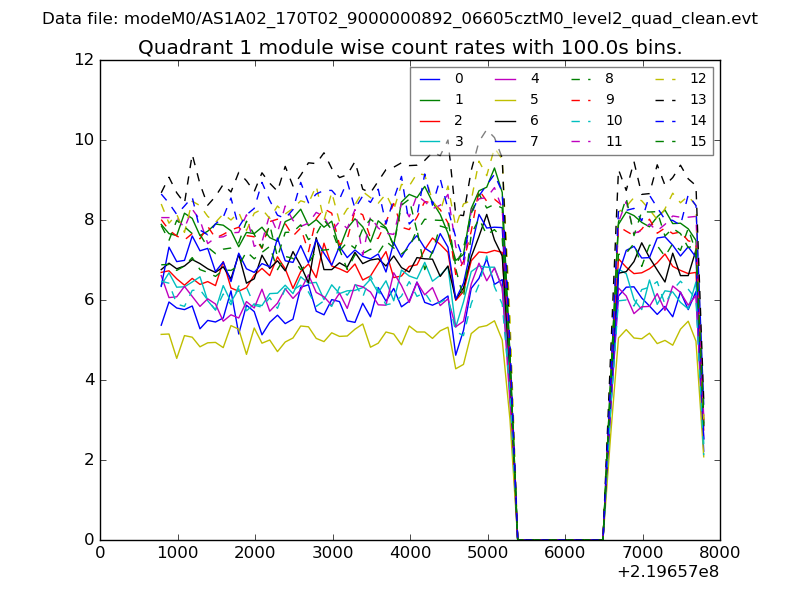
| Module-wise count rates for Quadrant A Data is divided into 100 sec bins |
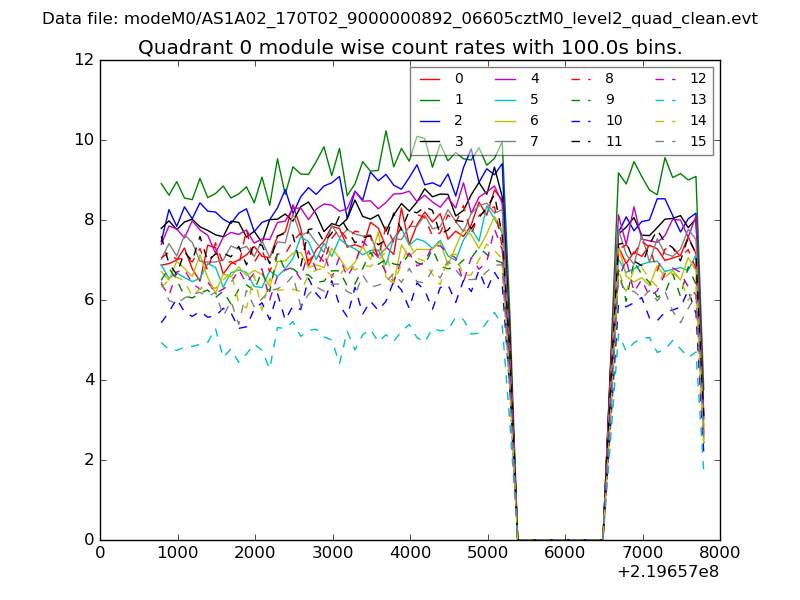 |
 |
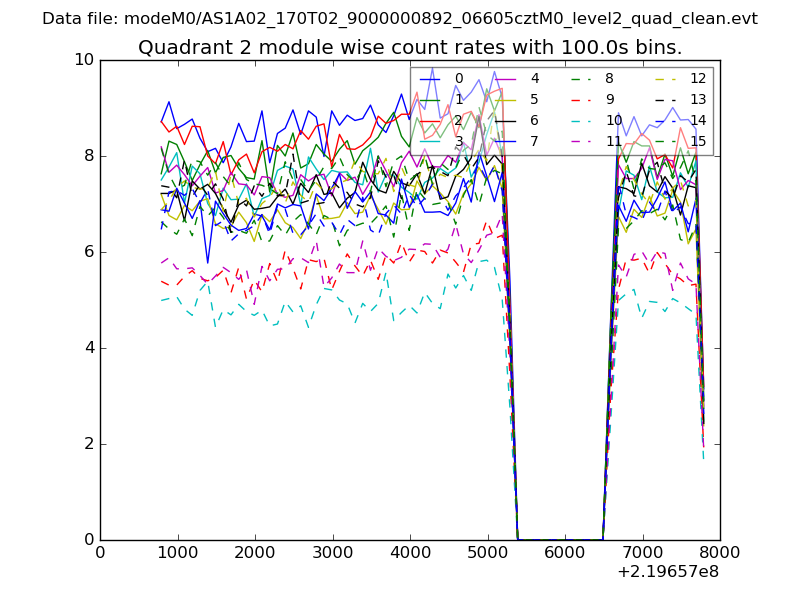
| Module-wise count rates for Quadrant B Data is divided into 100 sec bins |
 |
 |
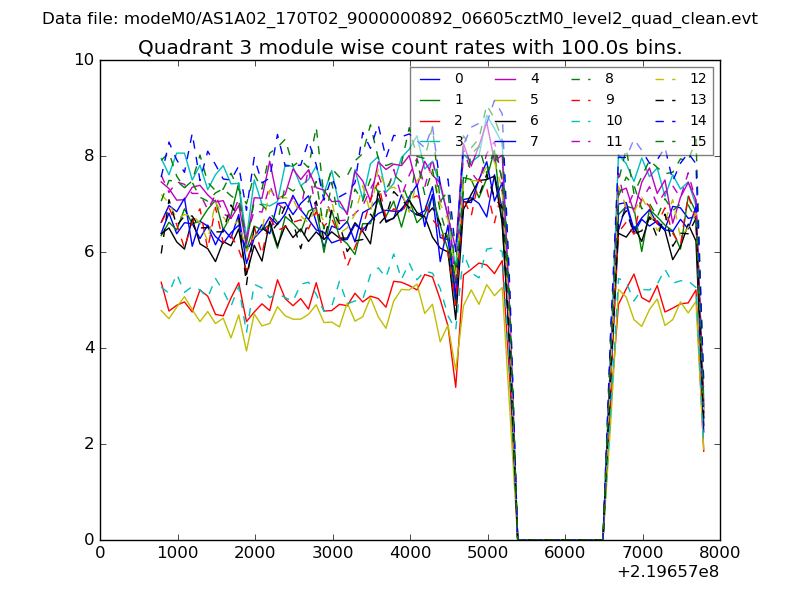
| Module-wise count rates for Quadrant C Data is divided into 100 sec bins |
 |
 |
| Module-wise count rates for Quadrant D Data is divided into 100 sec bins |
 |
 |
| Parameter | Plot |
|---|---|
| CZT HV Monitor | 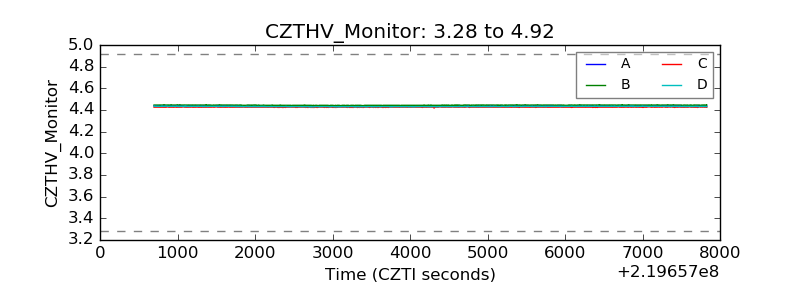 |
| D_VDD | 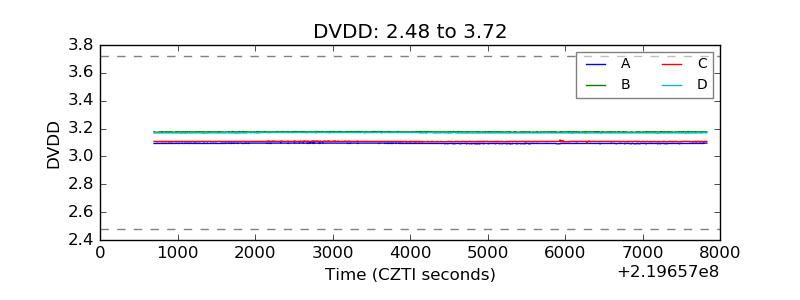 |
| Temperature 1 | 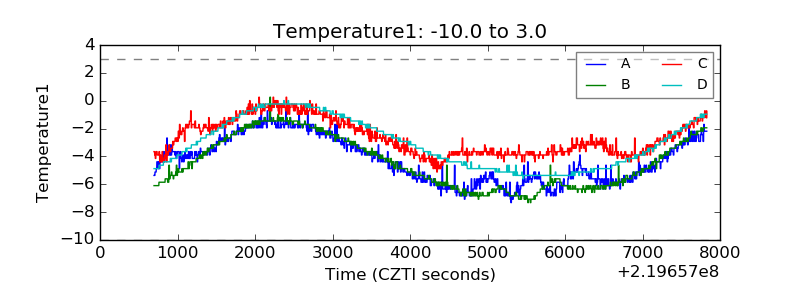 |
| Veto HV Monitor | 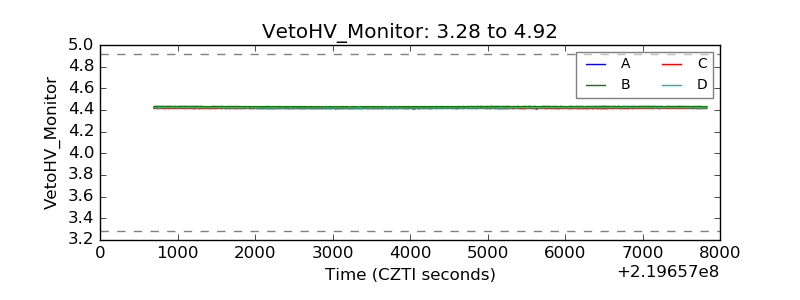 |
| Veto LLD | 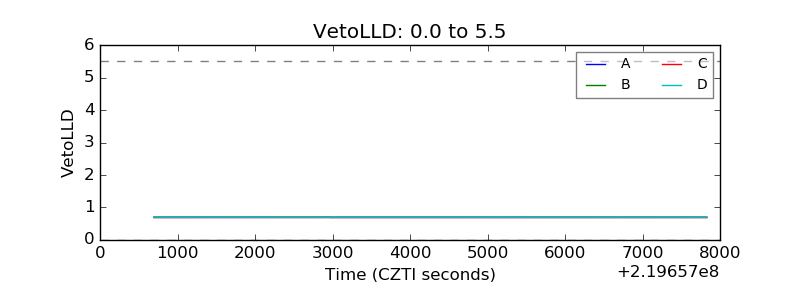 |
| Alpha Counter | 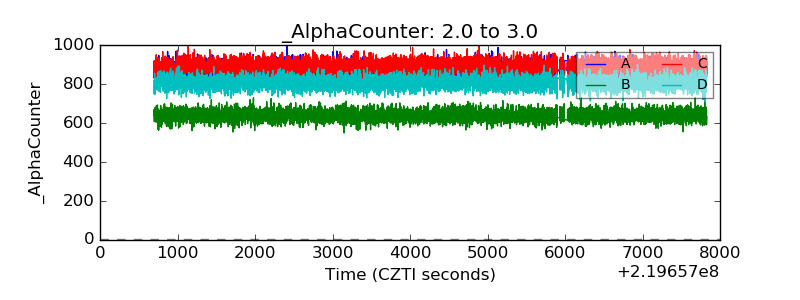 |
| _CPM_Rate | 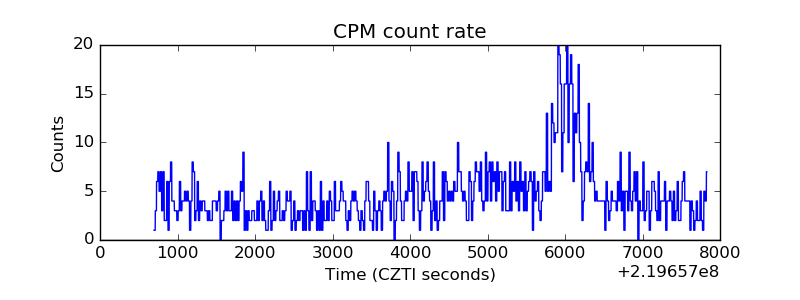 |
| CZT Counter | 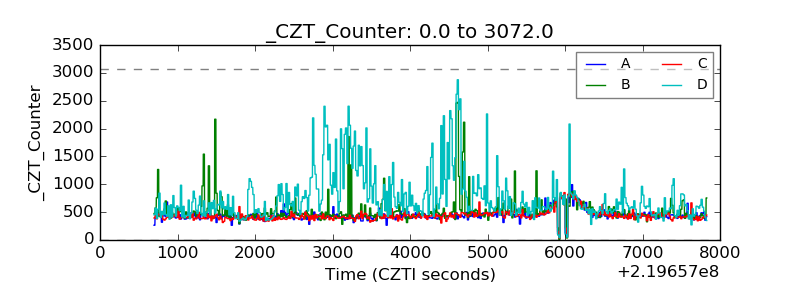 |
| +2.5 Volts monitor |  |
| +5 Volts monitor |  |
| _ROLL_ROT | 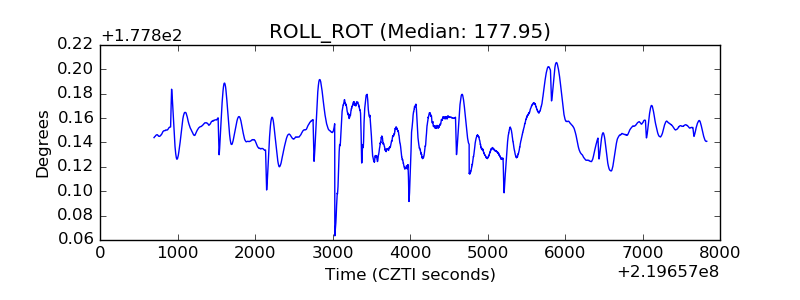 |
| _Roll_DEC | 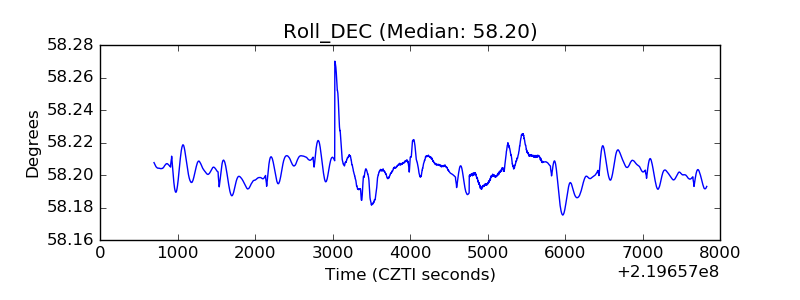 |
| _Roll_RA | 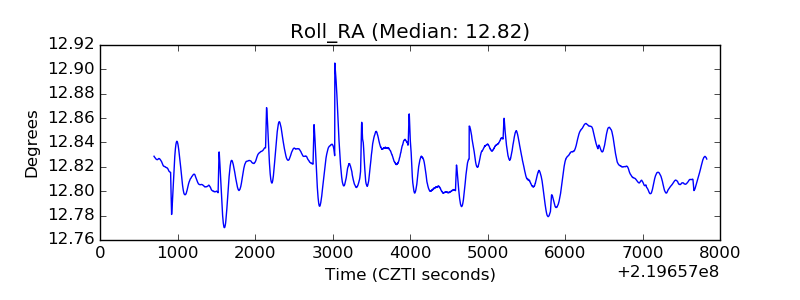 |
| Veto Counter | 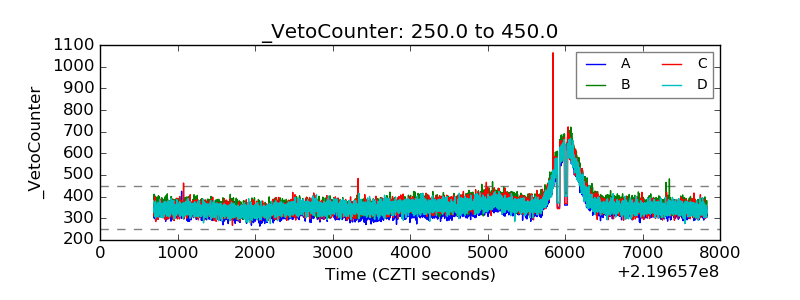 |