| Param | Original file | Final file |
|---|---|---|
| Filename | modeM0/AS1G06_134T03_9000000894cztM0_level2.fits | modeM0/AS1G06_134T03_9000000894cztM0_level2_quad_clean.evt |
| Size (bytes) | 301,147,200 | 270,077,760 |
| Size | 287.2 MB | 257.6 MB |
| Events in quadrant A | 1,796,588 | 1,552,111 |
| Events in quadrant B | 1,755,182 | 1,560,600 |
| Events in quadrant C | 1,797,760 | 1,498,618 |
| Events in quadrant D | 1,494,972 | 1,291,500 |
| Mode SS | |||
|---|---|---|---|
| Quadrant | BADHDUFLAG | Total packets | Discarded packets |
| A | 0 | 674 | 0 |
| B | 0 | 674 | 0 |
| C | 0 | 674 | 0 |
| D | 0 | 674 | 0 |
| Mode M0 | |||
|---|---|---|---|
| Quadrant | BADHDUFLAG | Total packets | Discarded packets |
| A | 0 | 72827 | 0 |
| B | 0 | 73500 | 0 |
| C | 0 | 67330 | 0 |
| D | 0 | 106076 | 0 |
| Mode M9 | |||
|---|---|---|---|
| Quadrant | BADHDUFLAG | Total packets | Discarded packets |
| A | 0 | 72 | 0 |
| B | 0 | 72 | 0 |
| C | 0 | 72 | 0 |
| D | 0 | 72 | 0 |
| Quadrant | Total seconds | Saturated seconds | Saturation percentage |
|---|---|---|---|
| A | 33124 | 281 | 0.848327% |
| B | 33125 | 530 | 1.600000% |
| C | 33125 | 80 | 0.241509% |
| D | 33124 | 1433 | 4.326168% |
Noise dominated data is calculated using 1-second bins in cleaned event files. If a bin has >2000 counts, and if more than 50% of those come from <1% of pixels, then it is considered to be noise-dominated and hence unusable.
| Quadrant | # 1 sec bins | Bins with >0 counts | Bins with >2000 counts | High rate bins dominated by noise | Noise dominated (total time) | Noise dominated (detector-on time) | Marked lightcurve |
|---|---|---|---|---|---|---|---|
| A | 40205 | 33125 | 0 | 0 | 0.00% | 0.00% | 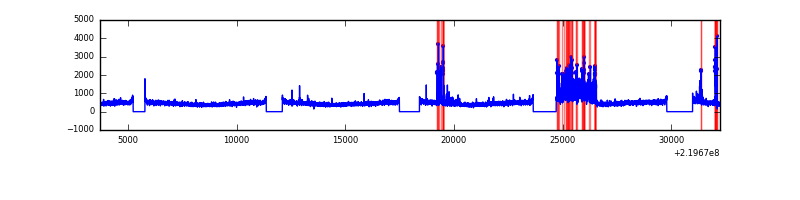 |
| B | 40206 | 33106 | 0 | 0 | 0.00% | 0.00% |  |
| C | 40206 | 33126 | 0 | 0 | 0.00% | 0.00% | 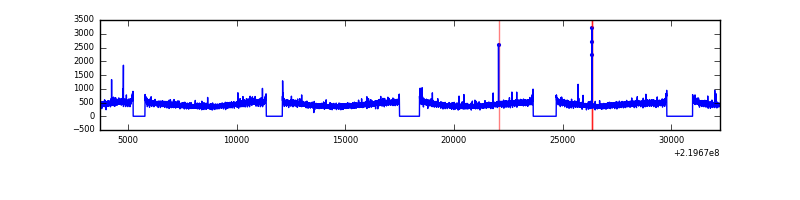 |
| D | 40206 | 33123 | 0 | 0 | 0.00% | 0.00% | 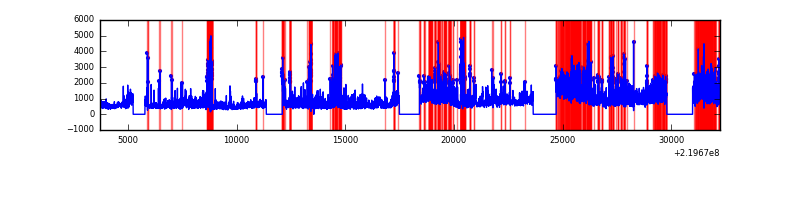 |
Top three noisy pixels from each quadrant. If the there are fewer than three noisy pixels in the level2.evt file, extra rows are filled as -1
| Pixel properties | Quadrant properties | ||||||
|---|---|---|---|---|---|---|---|
| Quadrant | DetID | PixID | Counts | Sigma | Mean | Median | Sigma |
| A | 0 | 29 | 1778 | 11.28 | 467 | 436 | 119.0 |
| A | 7 | 110 | 1570 | 9.53 | 467 | 436 | 119.0 |
| A | 0 | 30 | 1373 | 7.88 | 467 | 436 | 119.0 |
| B | 2 | 9 | 1524 | 11.39 | 463 | 440 | 95.1 |
| B | 14 | 254 | 1188 | 7.86 | 463 | 440 | 95.1 |
| B | 12 | 226 | 1174 | 7.72 | 463 | 440 | 95.1 |
| C | 1 | 80 | 1360 | 7.28 | 474 | 440 | 126.4 |
| C | 12 | 241 | 1279 | 6.64 | 474 | 440 | 126.4 |
| C | 1 | 81 | 1273 | 6.59 | 474 | 440 | 126.4 |
| D | 3 | 14 | 1140 | 6.42 | 426 | 385 | 117.7 |
| D | 6 | 231 | 1109 | 6.15 | 426 | 385 | 117.7 |
| D | 11 | 82 | 1100 | 6.08 | 426 | 385 | 117.7 |
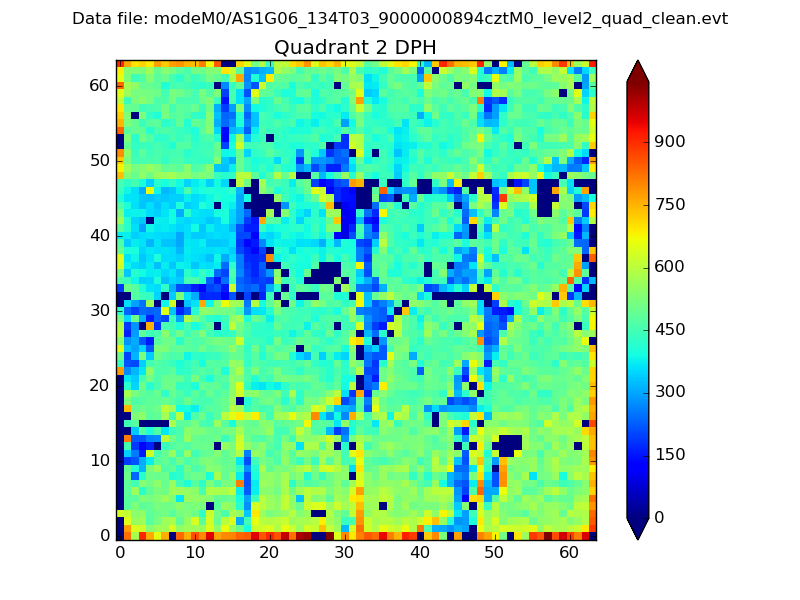
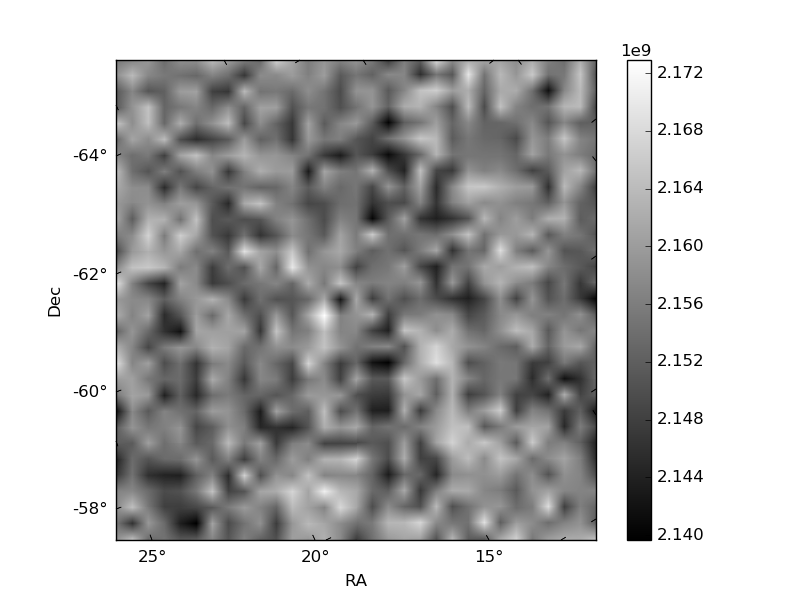
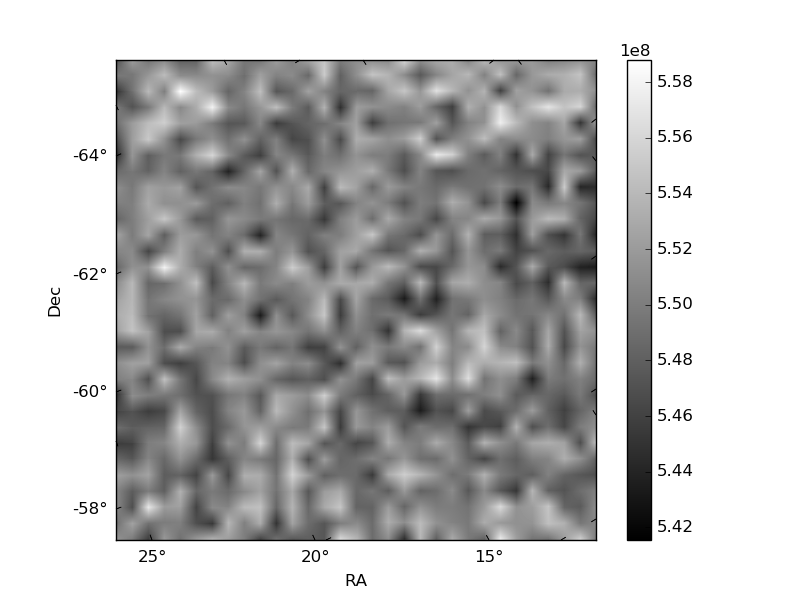
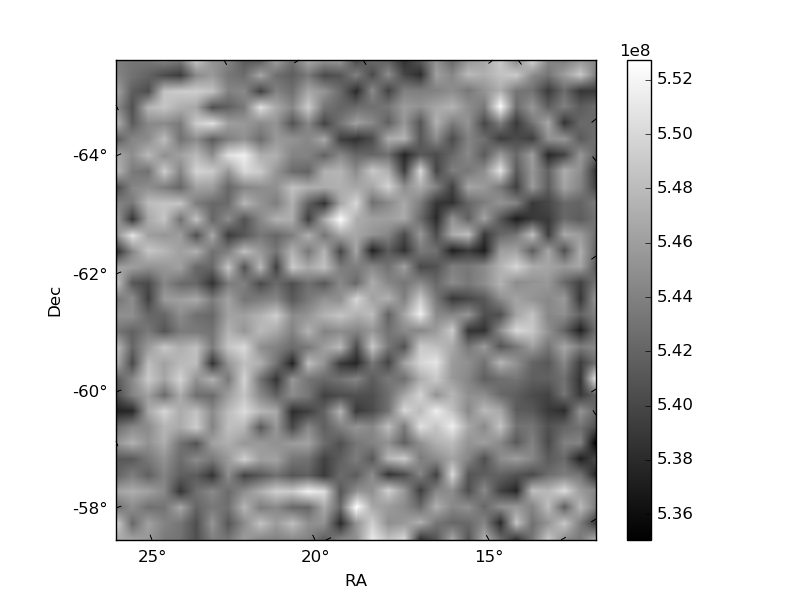
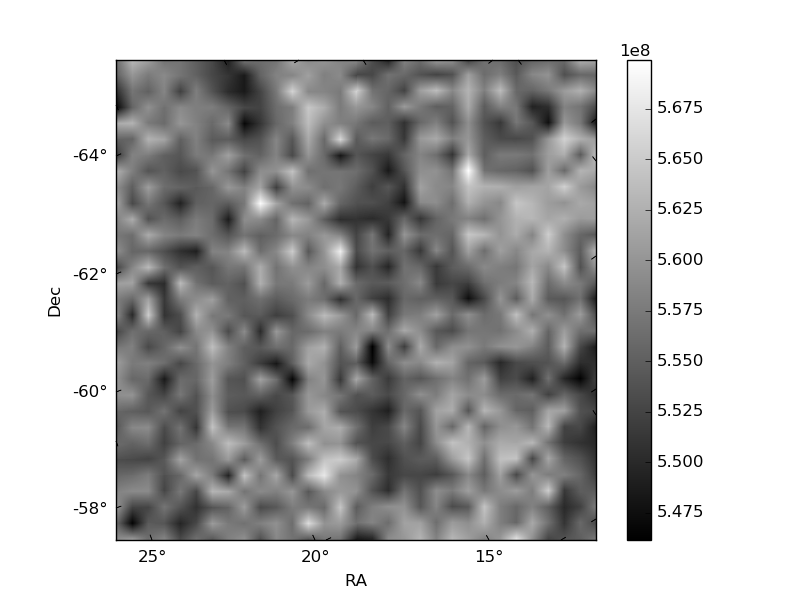
Histogram calculated using DETX and DETY for each event in the final _common_clean file
| Quadrant A | 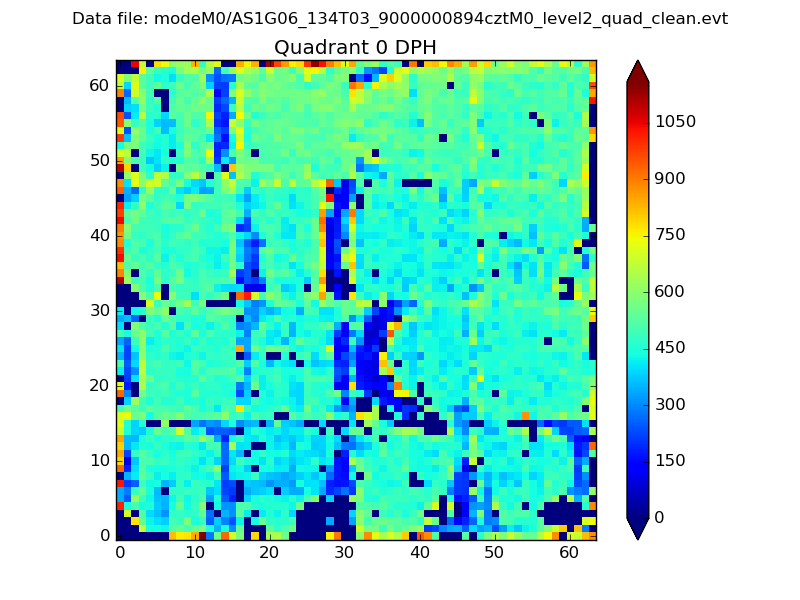 |
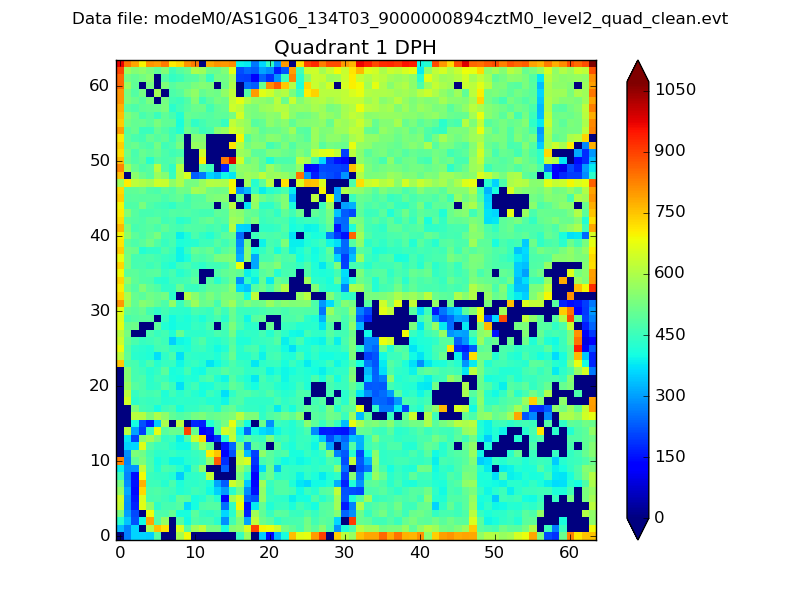 |
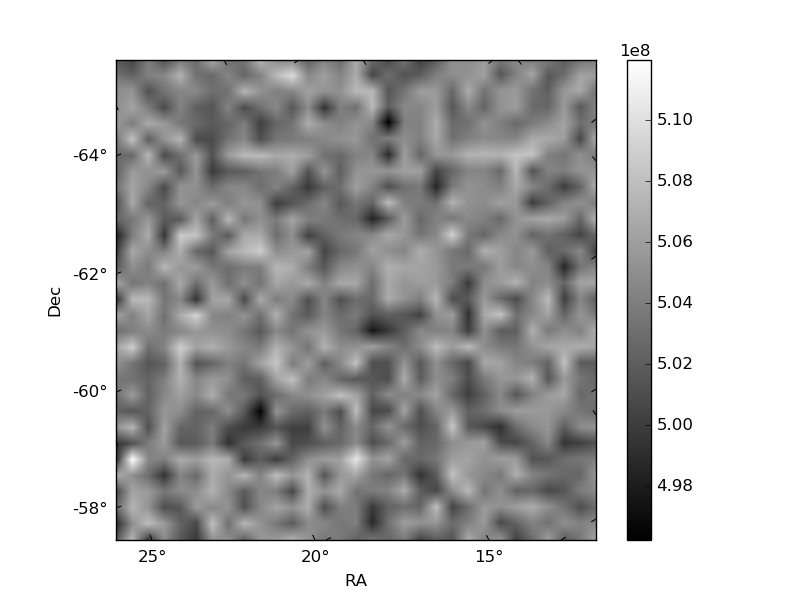
Quadrant B |
|---|---|---|---|
| Quadrant D | 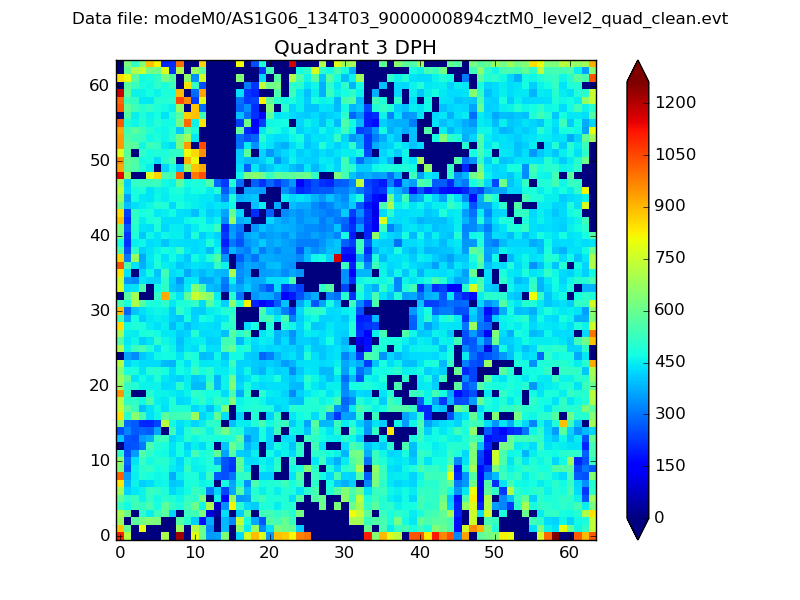 |
 |
Quadrant C |
| Plot type | Count rate plots | Images |
|---|---|---|
| Comparison with Poisson distribution Blue bars denote a histogram of data divided into 1 sec bins. Red curve is a Poisson curve with rate = median count rate of data. |
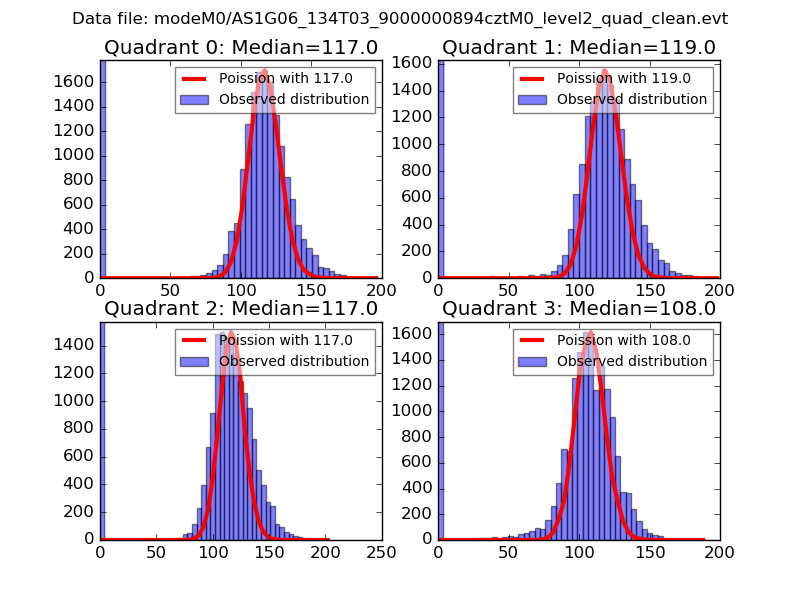 |
 |
| Quadrant-wise count rates Data is divided into 100 sec bins |
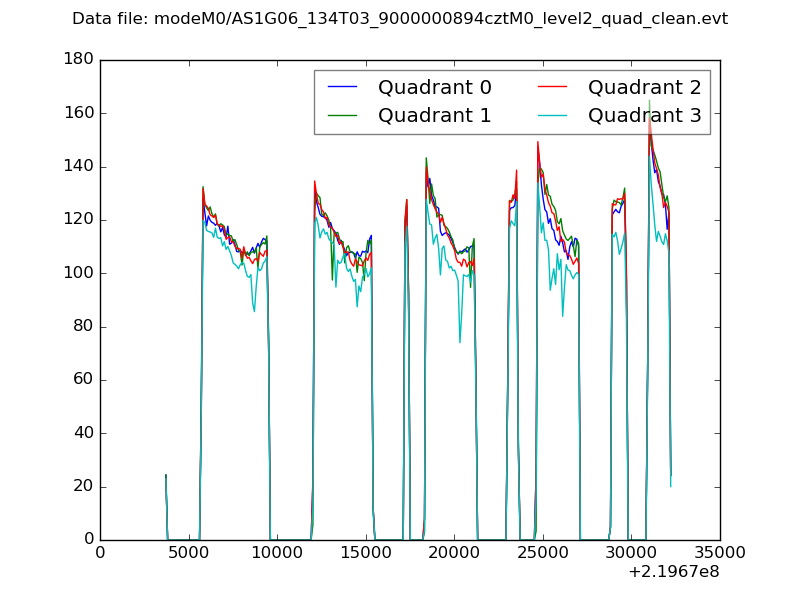 |
|
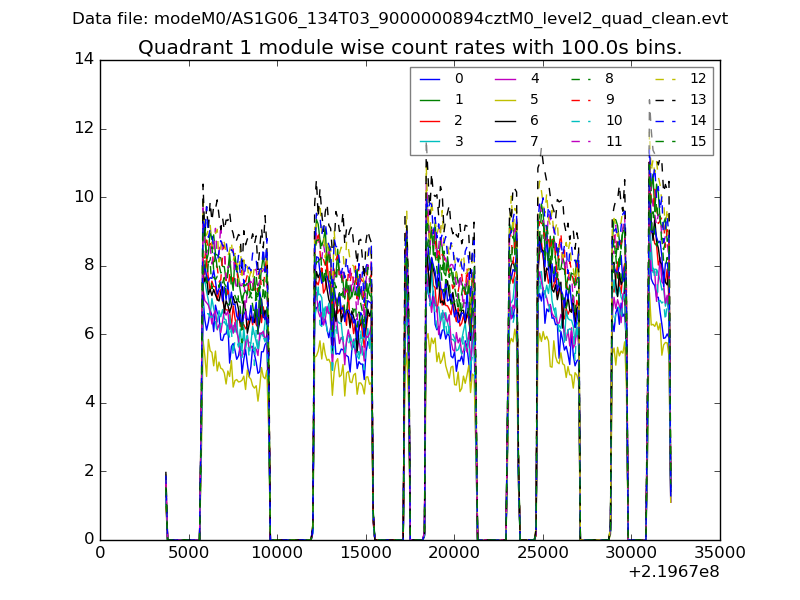
| Module-wise count rates for Quadrant A Data is divided into 100 sec bins |
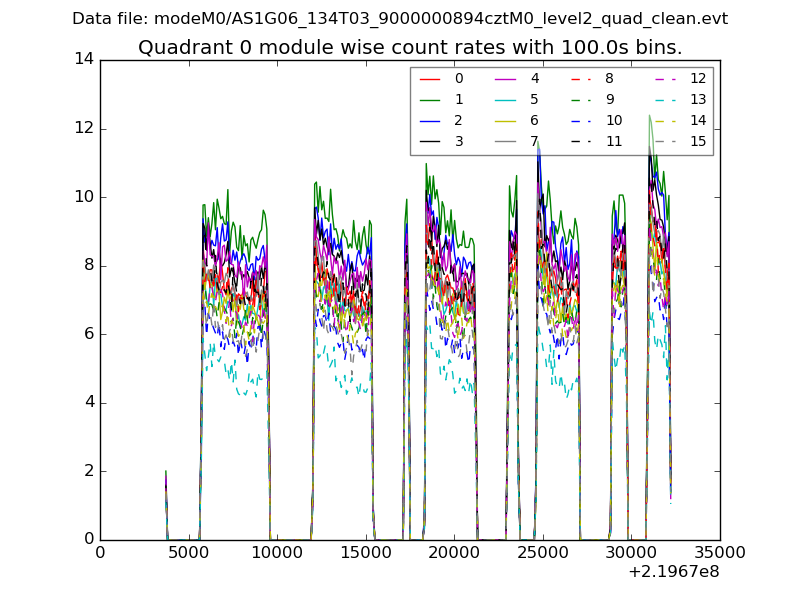 |
 |
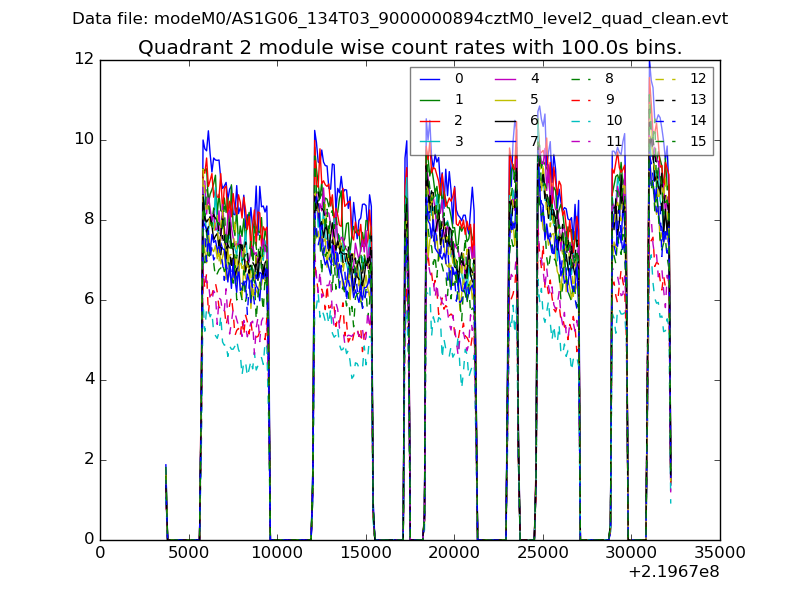
| Module-wise count rates for Quadrant B Data is divided into 100 sec bins |
 |
 |
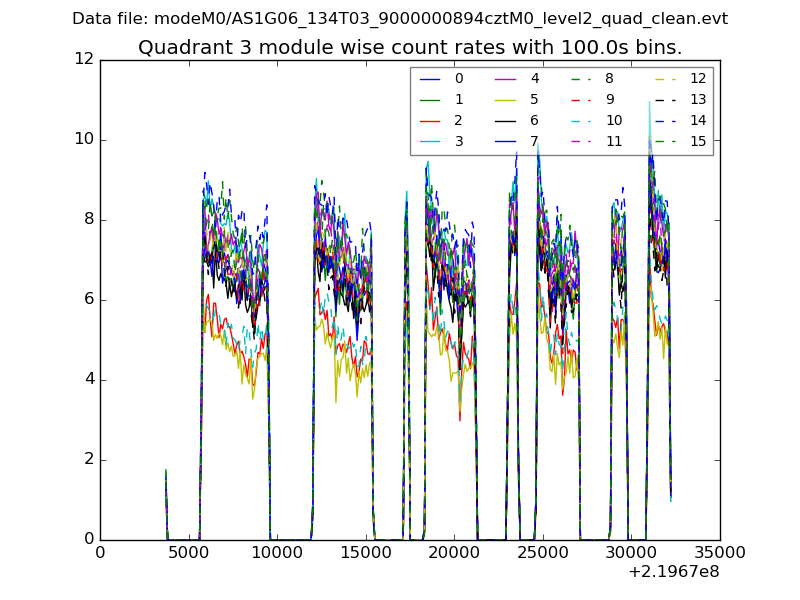
| Module-wise count rates for Quadrant C Data is divided into 100 sec bins |
 |
 |
| Module-wise count rates for Quadrant D Data is divided into 100 sec bins |
 |
 |
| Parameter | Plot |
|---|---|
| CZT HV Monitor | 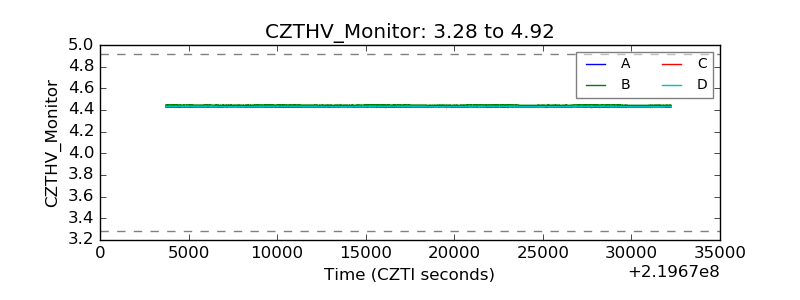 |
| D_VDD | 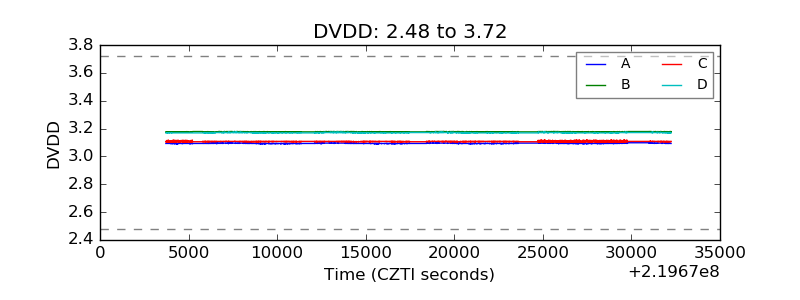 |
| Temperature 1 | 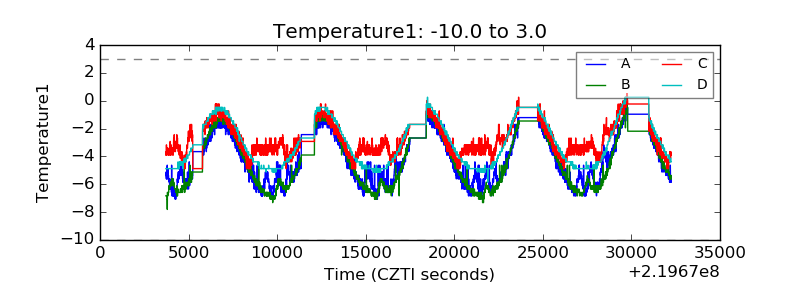 |
| Veto HV Monitor | 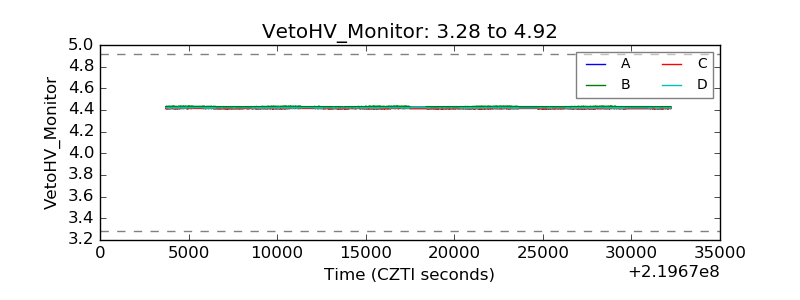 |
| Veto LLD | 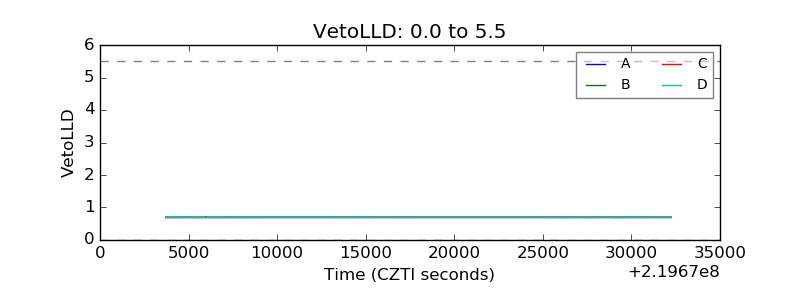 |
| Alpha Counter | 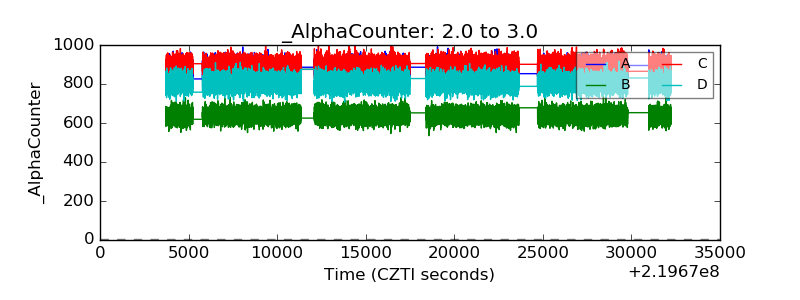 |
| _CPM_Rate | 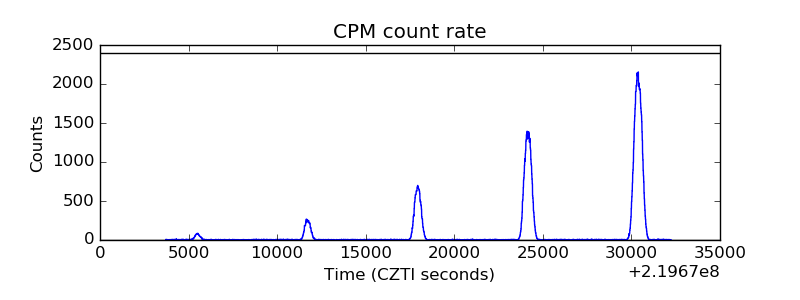 |
| CZT Counter | 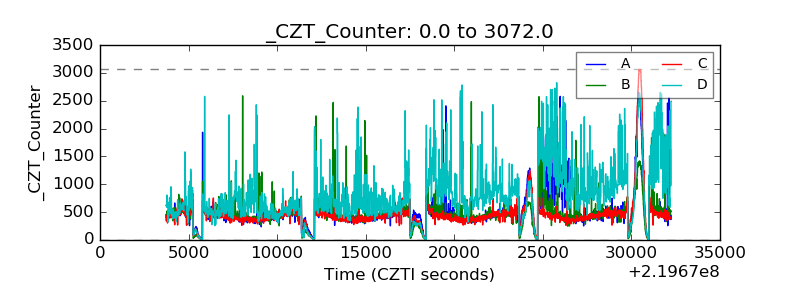 |
| +2.5 Volts monitor | 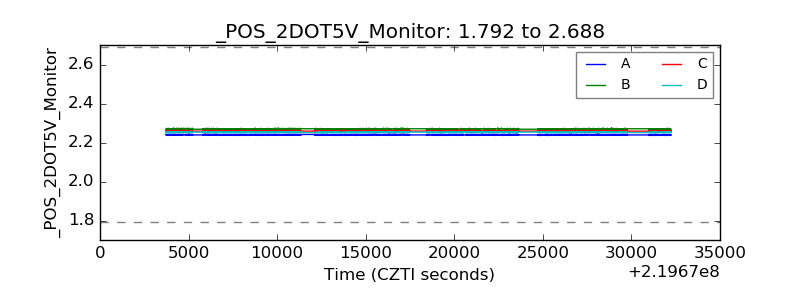 |
| +5 Volts monitor | 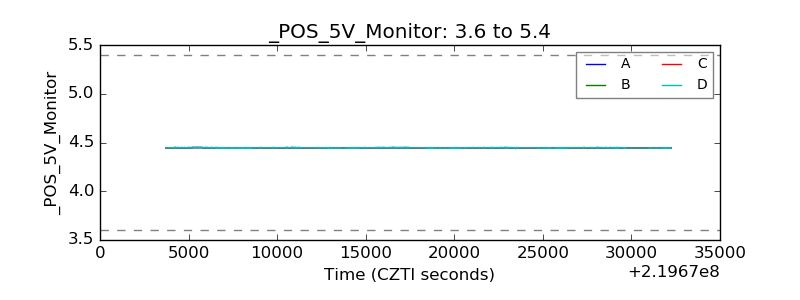 |
| _ROLL_ROT | 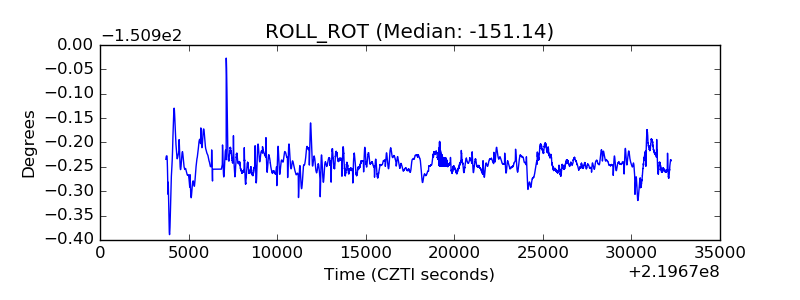 |
| _Roll_DEC | 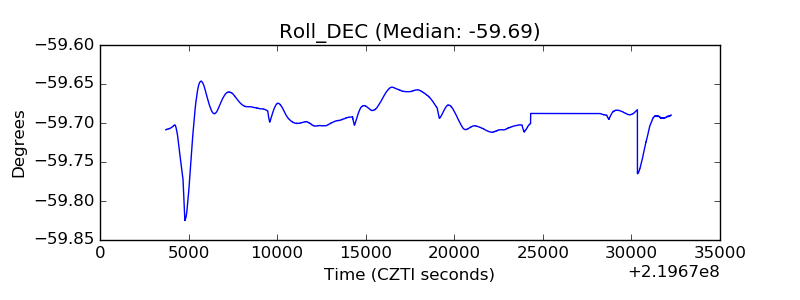 |
| _Roll_RA | 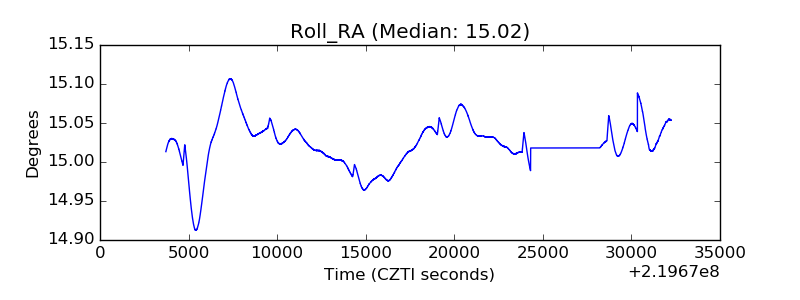 |
| Veto Counter | 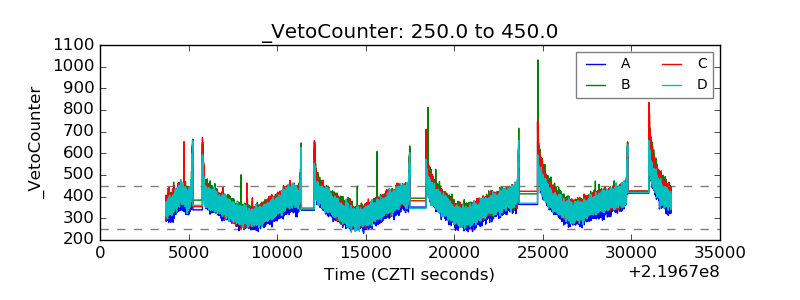 |