| Param | Original file | Final file |
|---|---|---|
| Filename | modeM0/AS1G06_134T03_9000000894_06609cztM0_level2.evt | modeM0/AS1G06_134T03_9000000894_06609cztM0_level2_quad_clean.evt |
| Size (bytes) | 1,021,449,600 | 164,753,280 |
| Size | 974.1 MB | 157.1 MB |
| Events in quadrant A | 6,417,807 | 1,026,641 |
| Events in quadrant B | 7,331,693 | 1,028,027 |
| Events in quadrant C | 6,130,212 | 1,023,256 |
| Events in quadrant D | 10,113,216 | 949,765 |
| Mode SS | |||
|---|---|---|---|
| Quadrant | BADHDUFLAG | Total packets | Discarded packets |
| A | 0 | 282 | 0 |
| B | 0 | 282 | 0 |
| C | 0 | 282 | 0 |
| D | 0 | 282 | 0 |
| Mode M0 | |||
|---|---|---|---|
| Quadrant | BADHDUFLAG | Total packets | Discarded packets |
| A | 0 | 28732 | 5 |
| B | 0 | 31108 | 3 |
| C | 0 | 28315 | 3 |
| D | 0 | 39551 | 6 |
| Mode M9 | |||
|---|---|---|---|
| Quadrant | BADHDUFLAG | Total packets | Discarded packets |
| A | 0 | 23 | 0 |
| B | 0 | 23 | 0 |
| C | 0 | 23 | 0 |
| D | 0 | 23 | 0 |
| Quadrant | Total seconds | Saturated seconds | Saturation percentage |
|---|---|---|---|
| A | 13938 | 105 | 0.753336% |
| B | 13939 | 273 | 1.958534% |
| C | 13939 | 46 | 0.330009% |
| D | 13938 | 383 | 2.747883% |
Noise dominated data is calculated using 1-second bins in cleaned event files. If a bin has >2000 counts, and if more than 50% of those come from <1% of pixels, then it is considered to be noise-dominated and hence unusable.
| Quadrant | # 1 sec bins | Bins with >0 counts | Bins with >2000 counts | High rate bins dominated by noise | Noise dominated (total time) | Noise dominated (detector-on time) | Marked lightcurve |
|---|---|---|---|---|---|---|---|
| A | 16149 | 13942 | 13 | 13 | 0.08% | 0.09% | 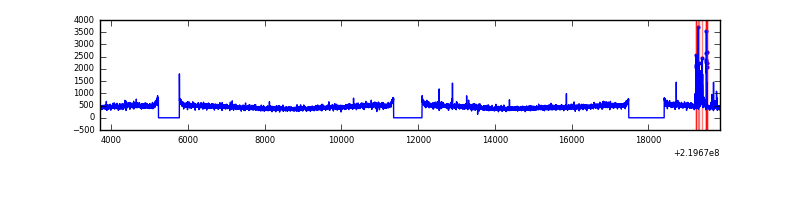 |
| B | 16150 | 13943 | 111 | 111 | 0.69% | 0.80% | 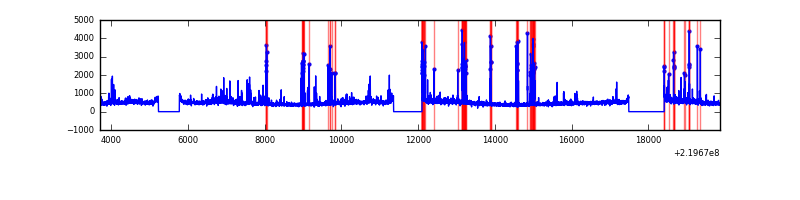 |
| C | 16150 | 13943 | 0 | 0 | 0.00% | 0.00% | 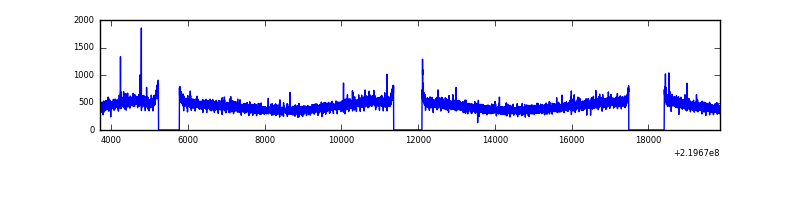 |
| D | 16150 | 13942 | 272 | 272 | 1.68% | 1.95% | 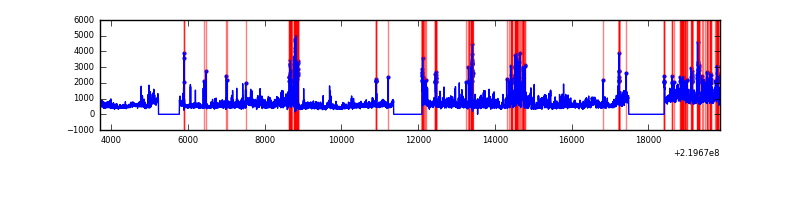 |
Top three noisy pixels from each quadrant. If the there are fewer than three noisy pixels in the level2.evt file, extra rows are filled as -1
| Pixel properties | Quadrant properties | ||||||
|---|---|---|---|---|---|---|---|
| Quadrant | DetID | PixID | Counts | Sigma | Mean | Median | Sigma |
| A | 13 | 248 | 124277 | 376.32 | 1605 | 1569 | 326.1 |
| A | 8 | 15 | 102319 | 308.98 | 1605 | 1569 | 326.1 |
| A | 0 | 226 | 15710 | 43.37 | 1605 | 1569 | 326.1 |
| B | 0 | 219 | 508885 | 1655.04 | 1617 | 1575 | 306.5 |
| B | 0 | 214 | 140535 | 453.34 | 1617 | 1575 | 306.5 |
| B | 4 | 48 | 103712 | 333.21 | 1617 | 1575 | 306.5 |
| C | 9 | 54 | 18384 | 46.27 | 1561 | 1566 | 363.4 |
| C | 1 | 16 | 14136 | 34.58 | 1561 | 1566 | 363.4 |
| C | 13 | 61 | 12401 | 29.81 | 1561 | 1566 | 363.4 |
| D | 8 | 195 | 2366658 | 6208.16 | 1542 | 1492 | 381.0 |
| D | 2 | 33 | 535225 | 1400.96 | 1542 | 1492 | 381.0 |
| D | 12 | 221 | 475117 | 1243.19 | 1542 | 1492 | 381.0 |
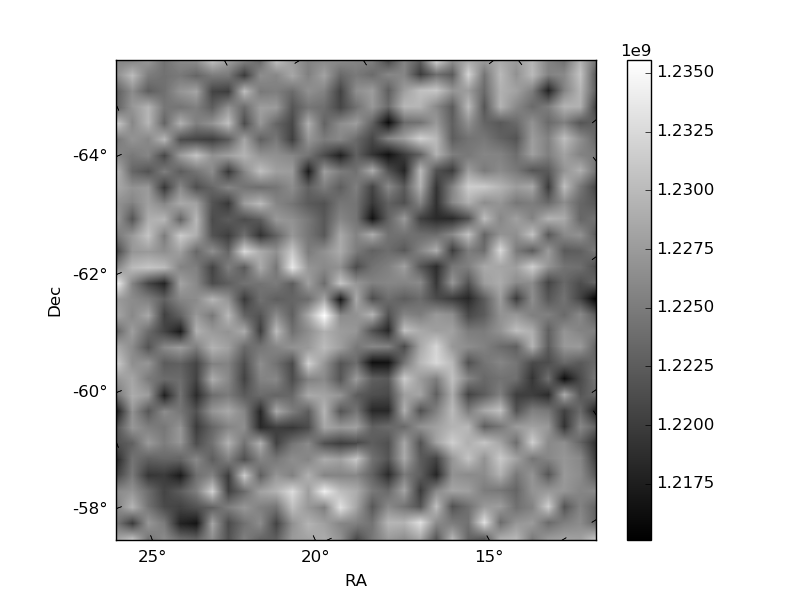
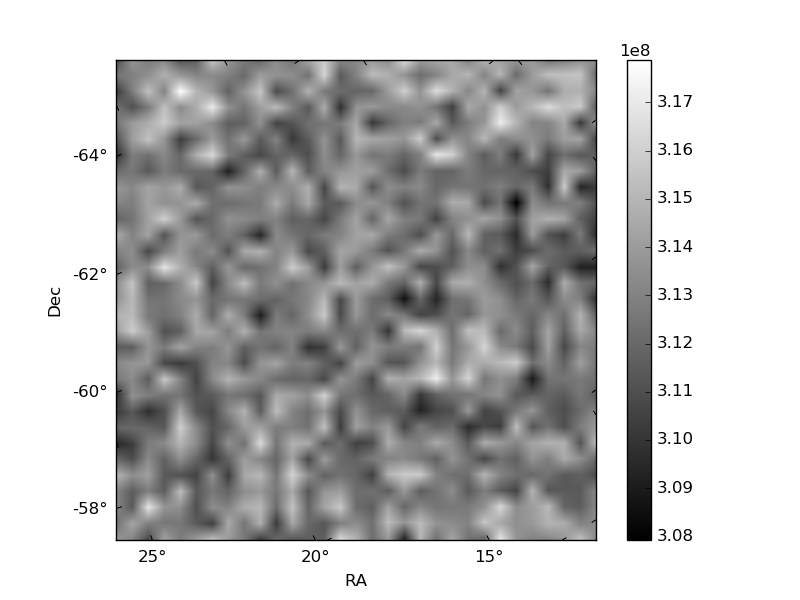
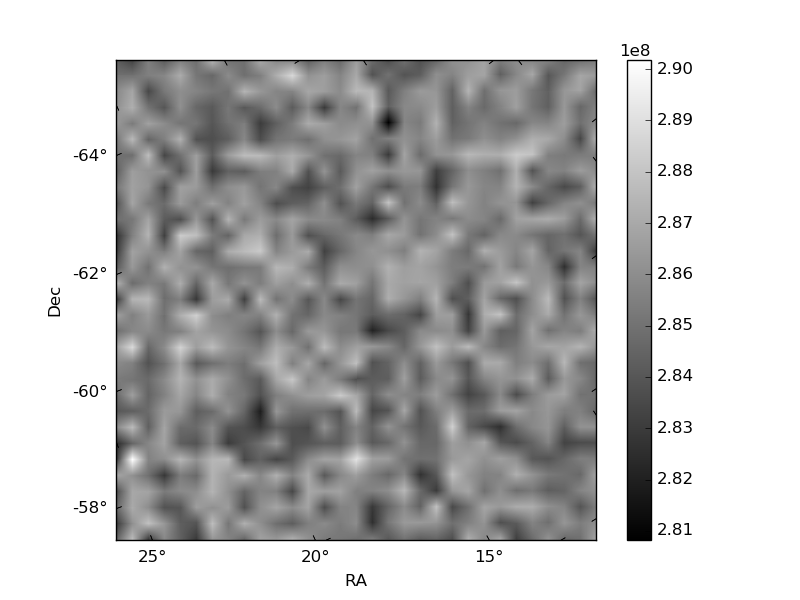
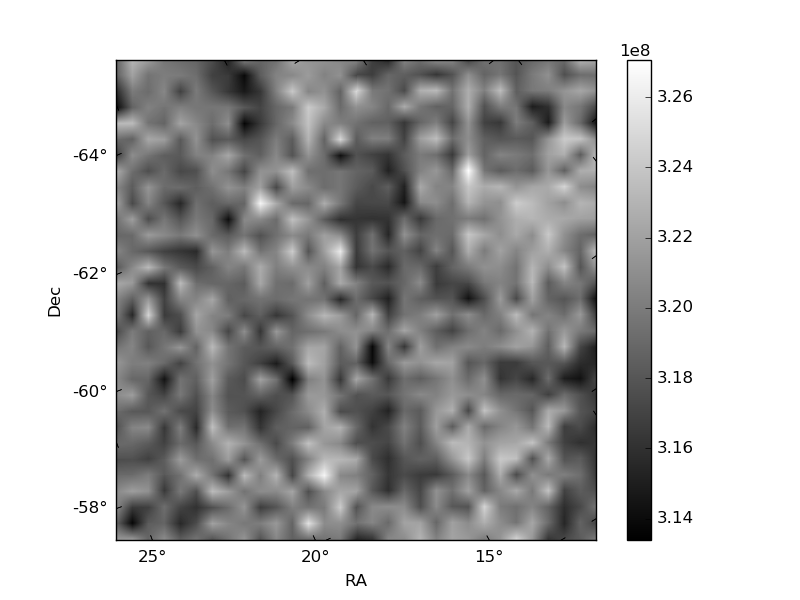
Histogram calculated using DETX and DETY for each event in the final _common_clean file
| Quadrant A | 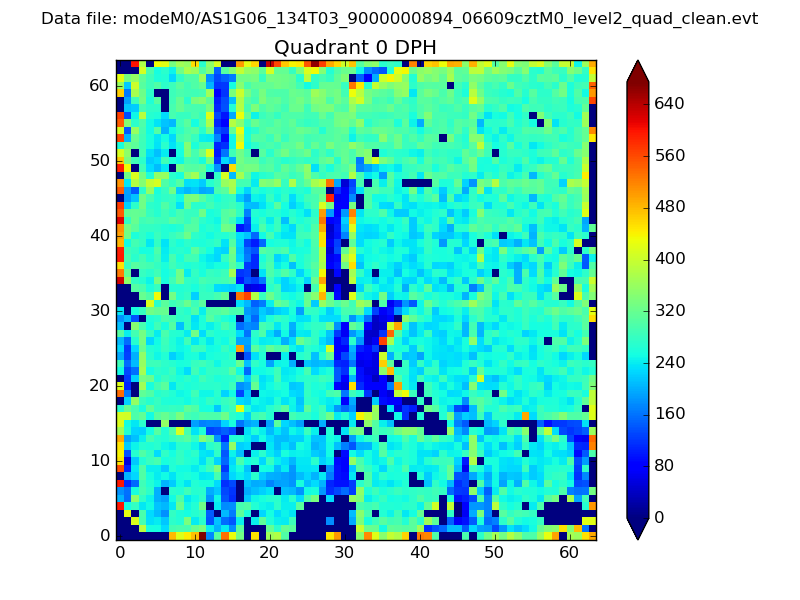 |
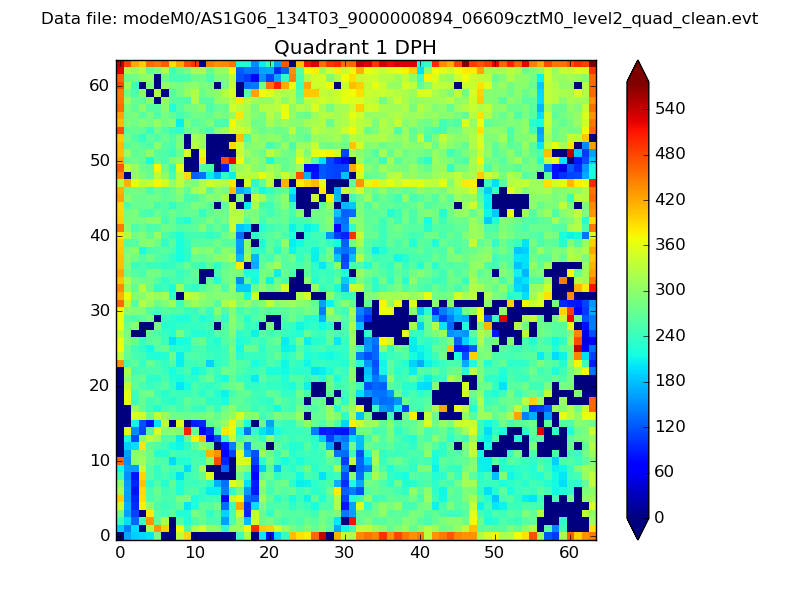 |
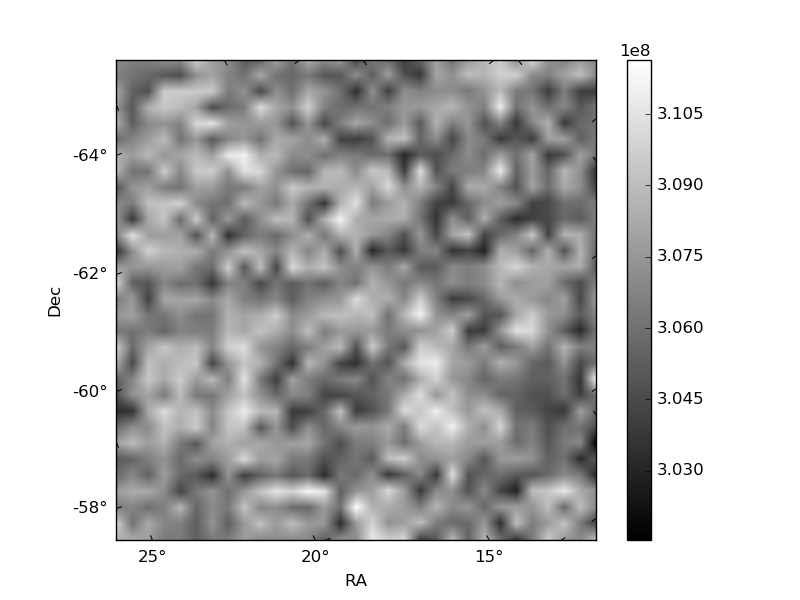
Quadrant B |
|---|---|---|---|
| Quadrant D | 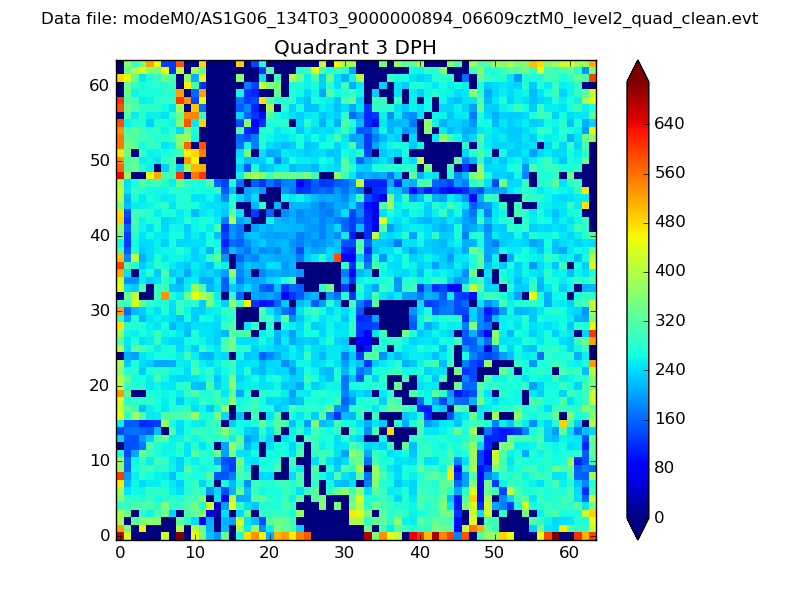 |
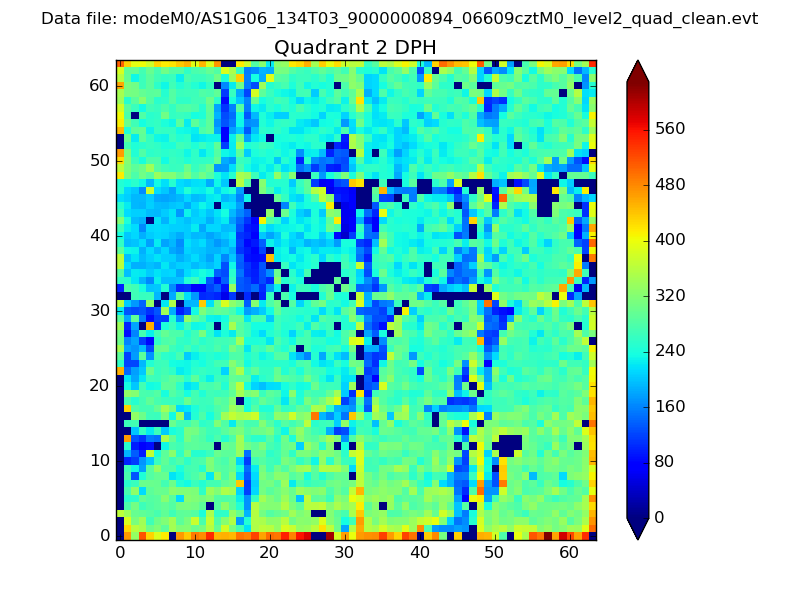 |
Quadrant C |
| Plot type | Count rate plots | Images |
|---|---|---|
| Comparison with Poisson distribution Blue bars denote a histogram of data divided into 1 sec bins. Red curve is a Poisson curve with rate = median count rate of data. |
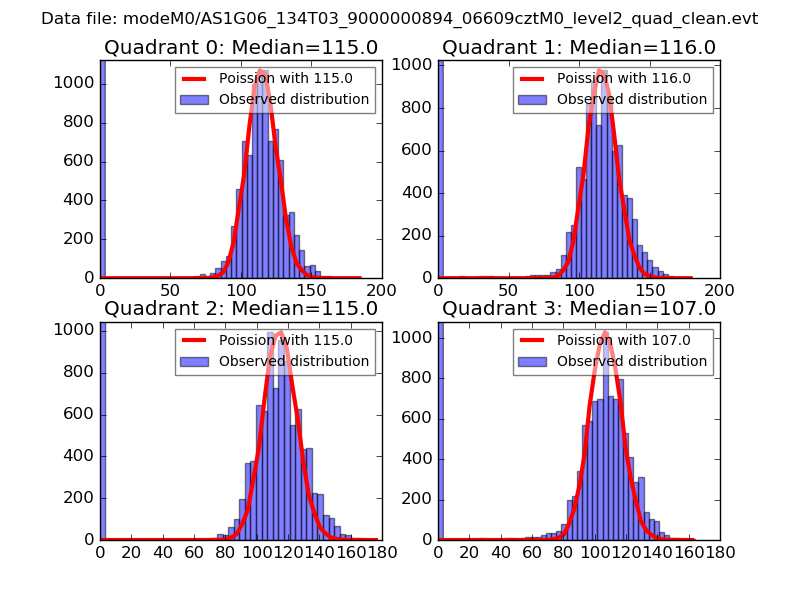 |
 |
| Quadrant-wise count rates Data is divided into 100 sec bins |
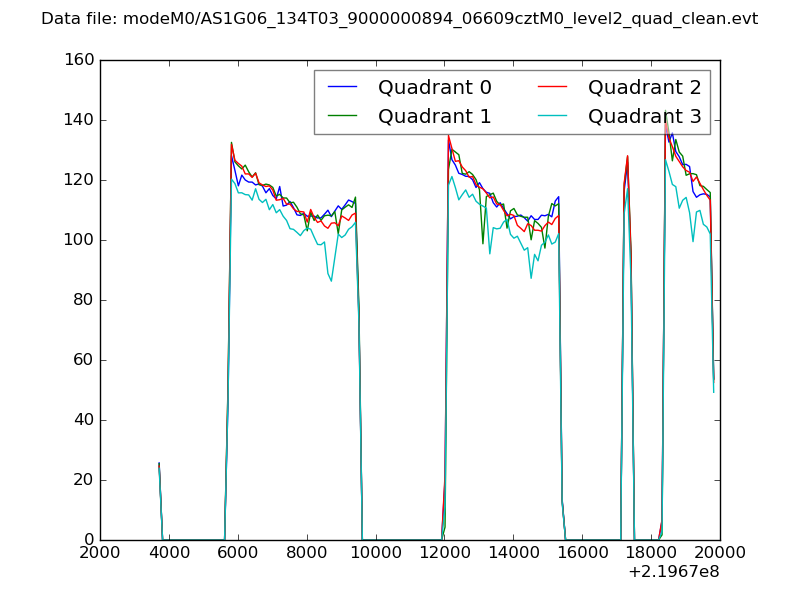 |
|
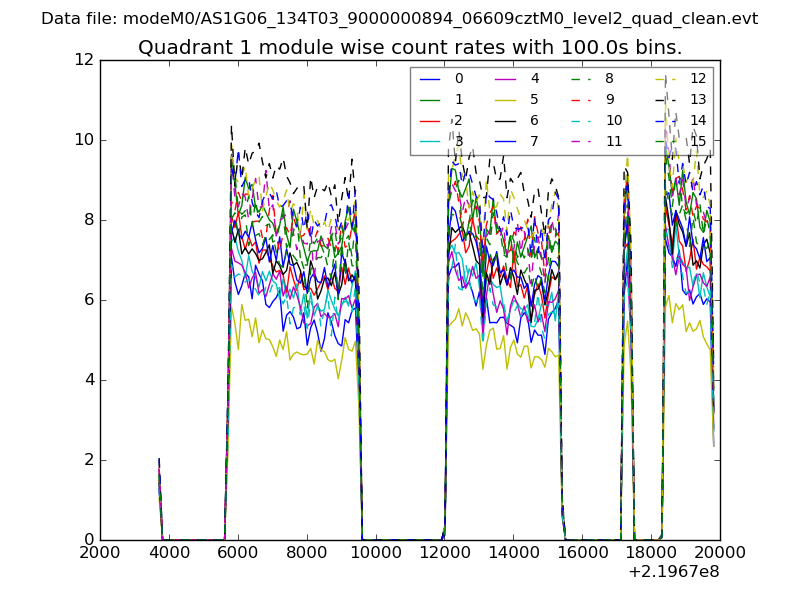
| Module-wise count rates for Quadrant A Data is divided into 100 sec bins |
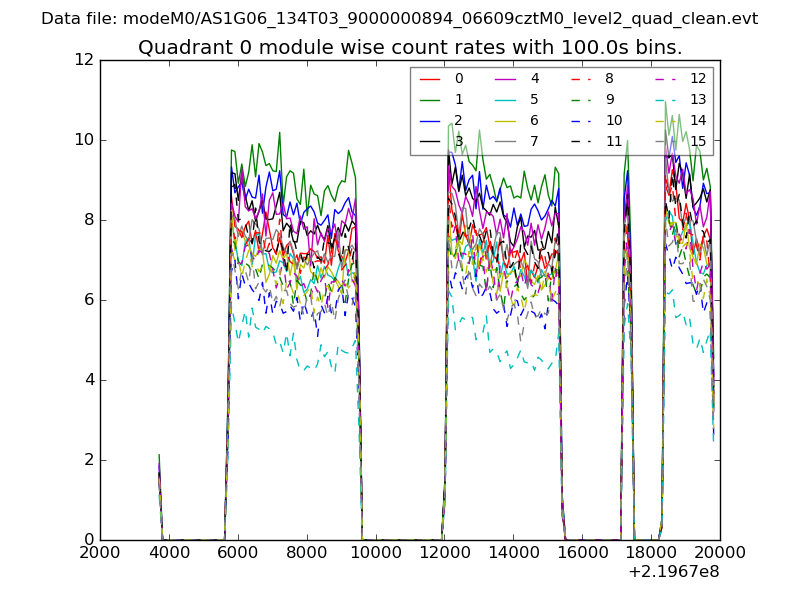 |
 |
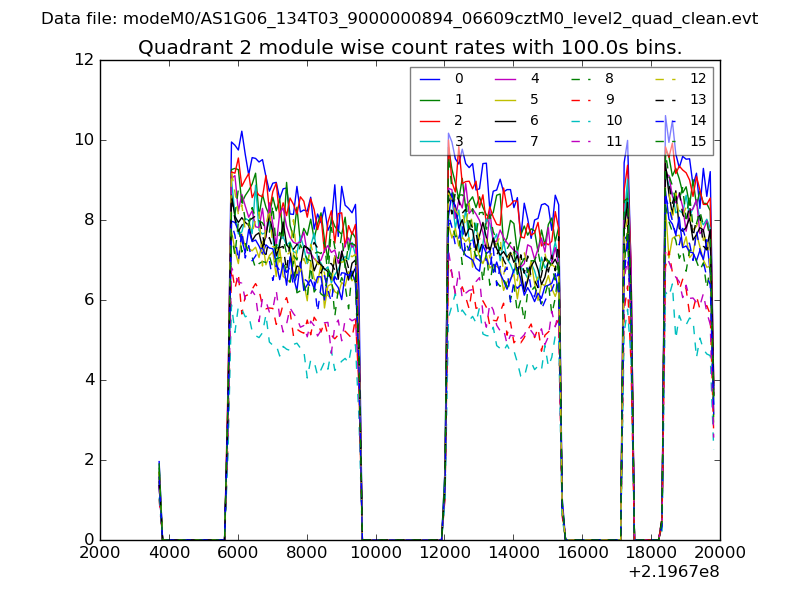
| Module-wise count rates for Quadrant B Data is divided into 100 sec bins |
 |
 |
| Module-wise count rates for Quadrant C Data is divided into 100 sec bins |
 |
 |
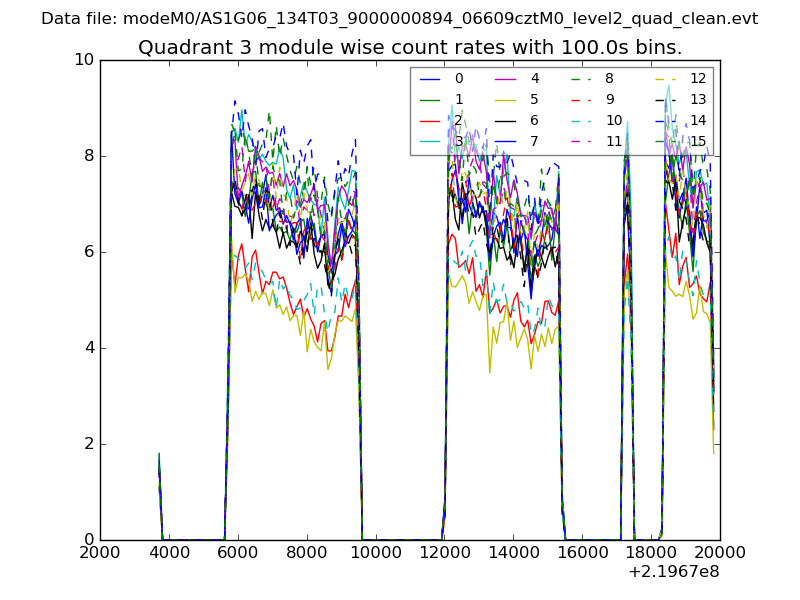
| Module-wise count rates for Quadrant D Data is divided into 100 sec bins |
 |
 |
| Parameter | Plot |
|---|---|
| CZT HV Monitor | 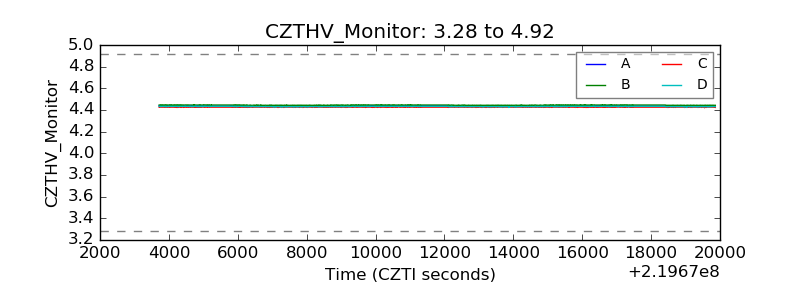 |
| D_VDD | 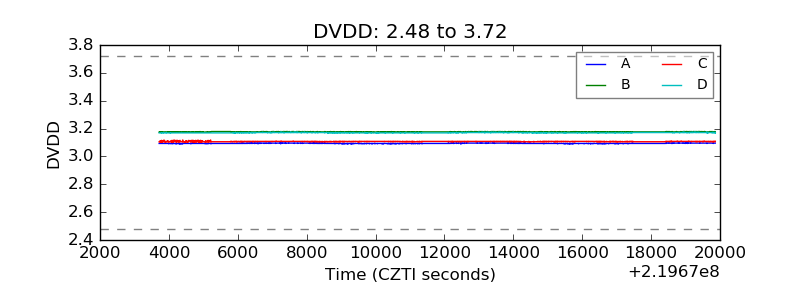 |
| Temperature 1 | 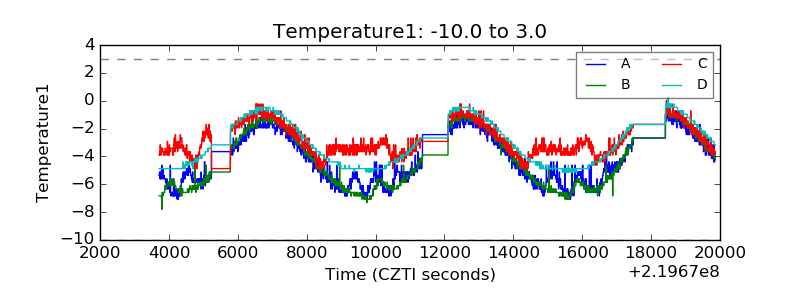 |
| Veto HV Monitor |  |
| Veto LLD | 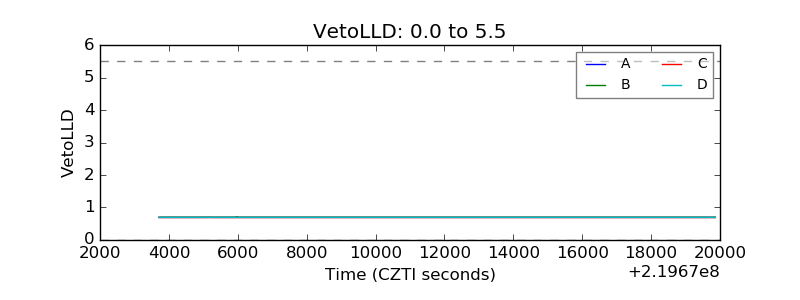 |
| Alpha Counter | 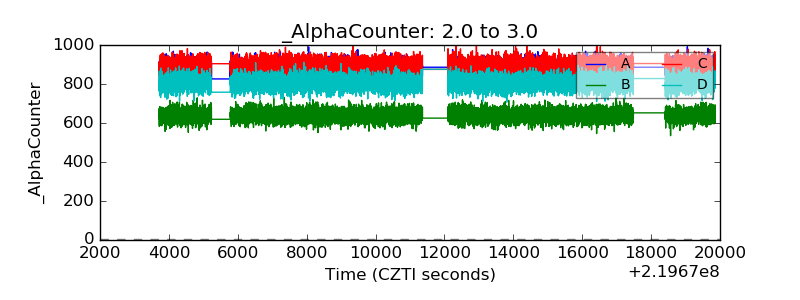 |
| _CPM_Rate | 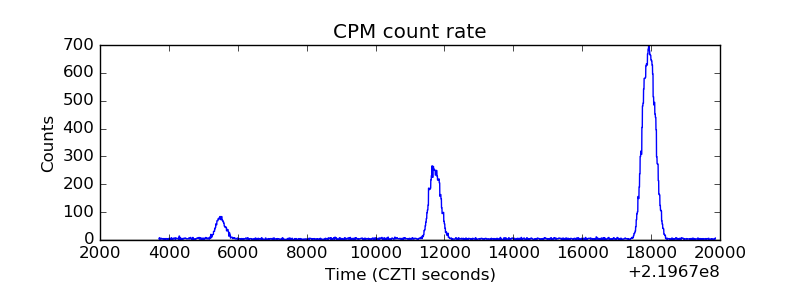 |
| CZT Counter | 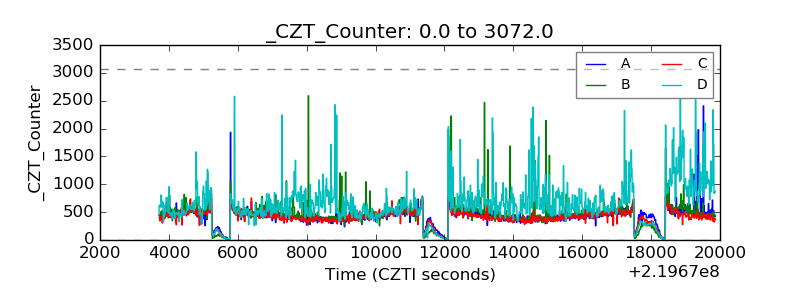 |
| +2.5 Volts monitor |  |
| +5 Volts monitor |  |
| _ROLL_ROT | 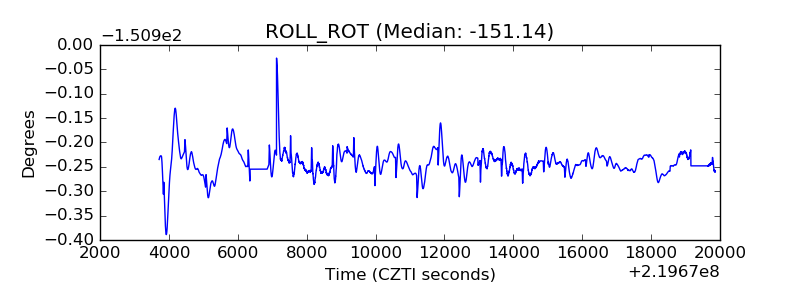 |
| _Roll_DEC | 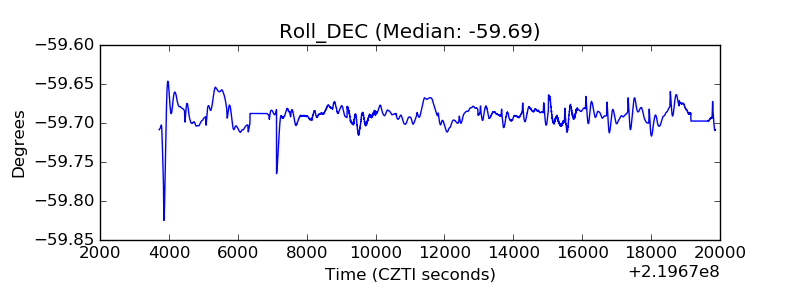 |
| _Roll_RA | 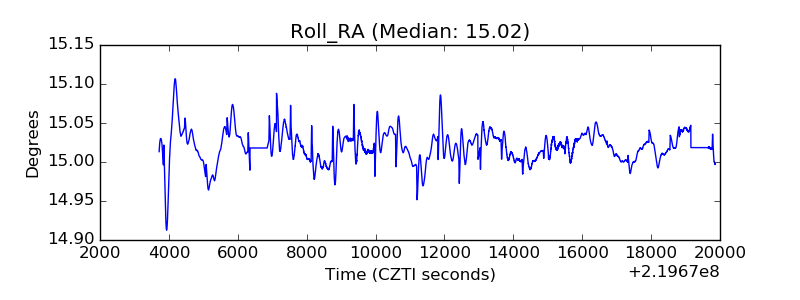 |
| Veto Counter | 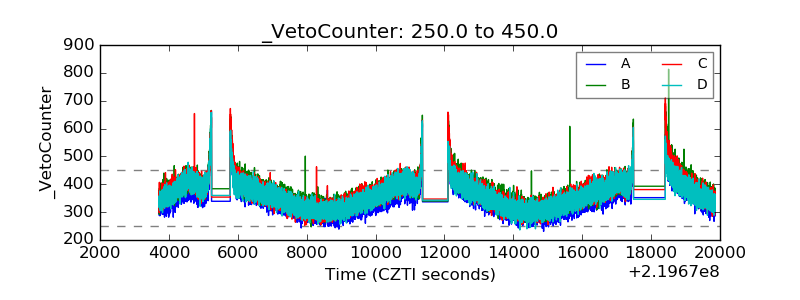 |