| Param | Original file | Final file |
|---|---|---|
| Filename | modeM0/AS1G06_134T03_9000000894_06610cztM0_level2.evt | modeM0/AS1G06_134T03_9000000894_06610cztM0_level2_quad_clean.evt |
| Size (bytes) | 572,768,640 | 83,554,560 |
| Size | 546.2 MB | 79.7 MB |
| Events in quadrant A | 3,904,901 | 532,846 |
| Events in quadrant B | 3,309,270 | 541,770 |
| Events in quadrant C | 2,719,871 | 537,376 |
| Events in quadrant D | 6,986,917 | 479,263 |
| Mode SS | |||
|---|---|---|---|
| Quadrant | BADHDUFLAG | Total packets | Discarded packets |
| A | 0 | 128 | 0 |
| B | 0 | 128 | 0 |
| C | 0 | 128 | 0 |
| D | 0 | 128 | 0 |
| Mode M0 | |||
|---|---|---|---|
| Quadrant | BADHDUFLAG | Total packets | Discarded packets |
| A | 0 | 16049 | 2 |
| B | 0 | 14143 | 1 |
| C | 0 | 12700 | 1 |
| D | 0 | 25294 | 1 |
| Mode M9 | |||
|---|---|---|---|
| Quadrant | BADHDUFLAG | Total packets | Discarded packets |
| A | 0 | 11 | 0 |
| B | 0 | 11 | 0 |
| C | 0 | 11 | 0 |
| D | 0 | 11 | 0 |
| Quadrant | Total seconds | Saturated seconds | Saturation percentage |
|---|---|---|---|
| A | 6285 | 107 | 1.702466% |
| B | 6285 | 109 | 1.734288% |
| C | 6285 | 8 | 0.127287% |
| D | 6285 | 520 | 8.273667% |
Noise dominated data is calculated using 1-second bins in cleaned event files. If a bin has >2000 counts, and if more than 50% of those come from <1% of pixels, then it is considered to be noise-dominated and hence unusable.
| Quadrant | # 1 sec bins | Bins with >0 counts | Bins with >2000 counts | High rate bins dominated by noise | Noise dominated (total time) | Noise dominated (detector-on time) | Marked lightcurve |
|---|---|---|---|---|---|---|---|
| A | 7345 | 6286 | 46 | 46 | 0.63% | 0.73% | 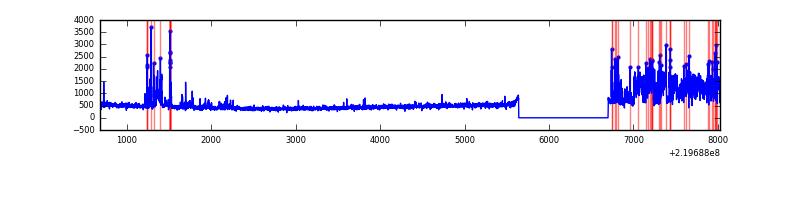 |
| B | 7345 | 6286 | 47 | 47 | 0.64% | 0.75% | 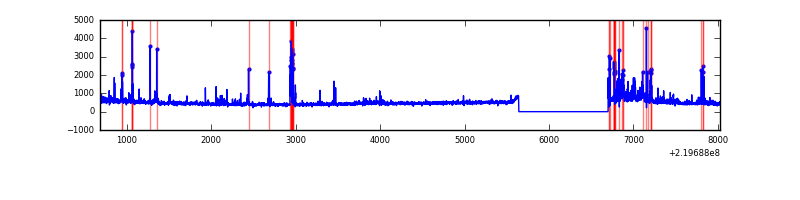 |
| C | 7345 | 6286 | 1 | 1 | 0.01% | 0.02% | 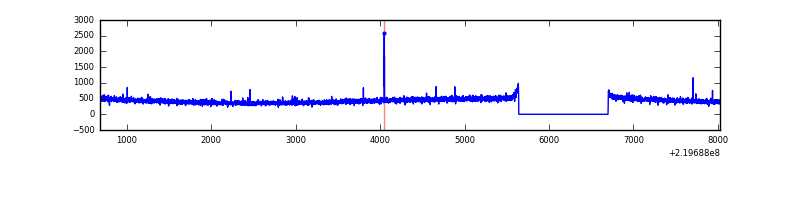 |
| D | 7345 | 6286 | 492 | 492 | 6.70% | 7.83% | 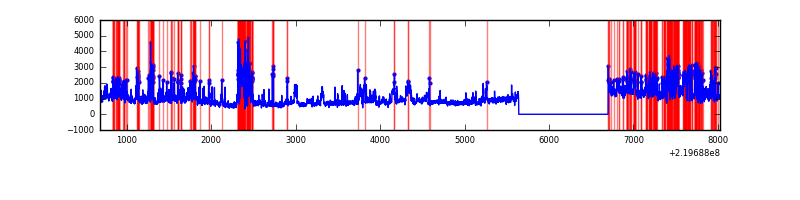 |
Top three noisy pixels from each quadrant. If the there are fewer than three noisy pixels in the level2.evt file, extra rows are filled as -1
| Pixel properties | Quadrant properties | ||||||
|---|---|---|---|---|---|---|---|
| Quadrant | DetID | PixID | Counts | Sigma | Mean | Median | Sigma |
| A | 8 | 15 | 938220 | 6394.21 | 713 | 699 | 146.6 |
| A | 13 | 248 | 151071 | 1025.59 | 713 | 699 | 146.6 |
| A | 14 | 111 | 60036 | 404.7 | 713 | 699 | 146.6 |
| B | 0 | 219 | 178406 | 1291.3 | 722 | 706 | 137.6 |
| B | 4 | 80 | 118934 | 859.13 | 722 | 706 | 137.6 |
| B | 4 | 170 | 85837 | 618.63 | 722 | 706 | 137.6 |
| C | 12 | 4 | 7832 | 44.04 | 691 | 694 | 162.1 |
| C | 9 | 54 | 5744 | 31.16 | 691 | 694 | 162.1 |
| C | 13 | 61 | 5457 | 29.39 | 691 | 694 | 162.1 |
| D | 8 | 195 | 2135806 | 12899.28 | 671 | 649 | 165.5 |
| D | 12 | 221 | 1465873 | 8851.96 | 671 | 649 | 165.5 |
| D | 2 | 33 | 372998 | 2249.5 | 671 | 649 | 165.5 |
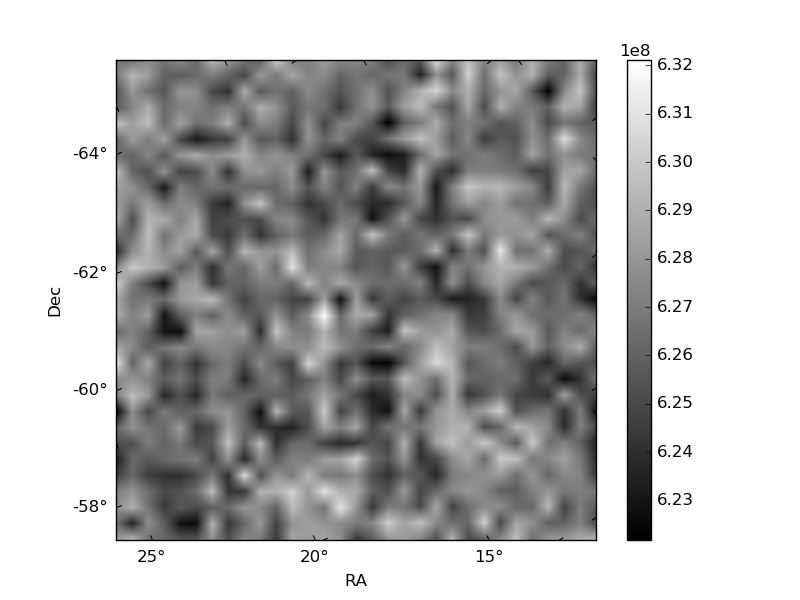
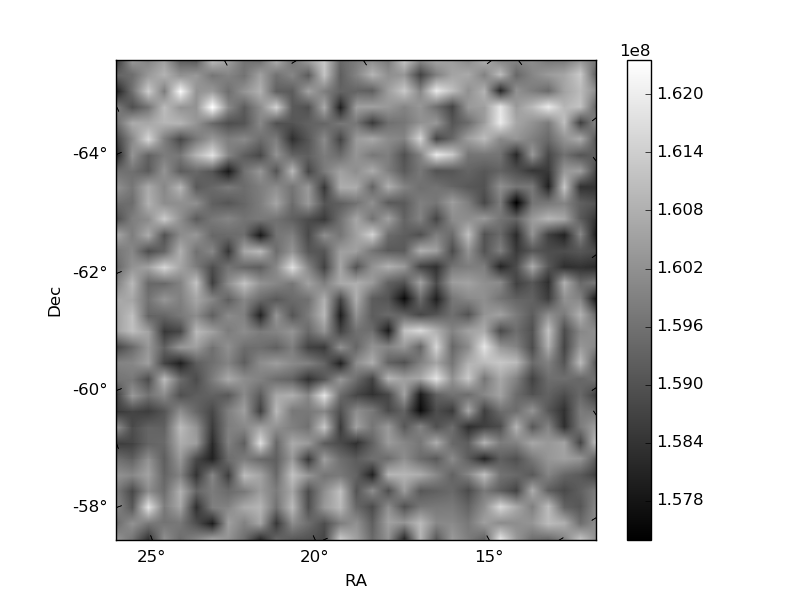
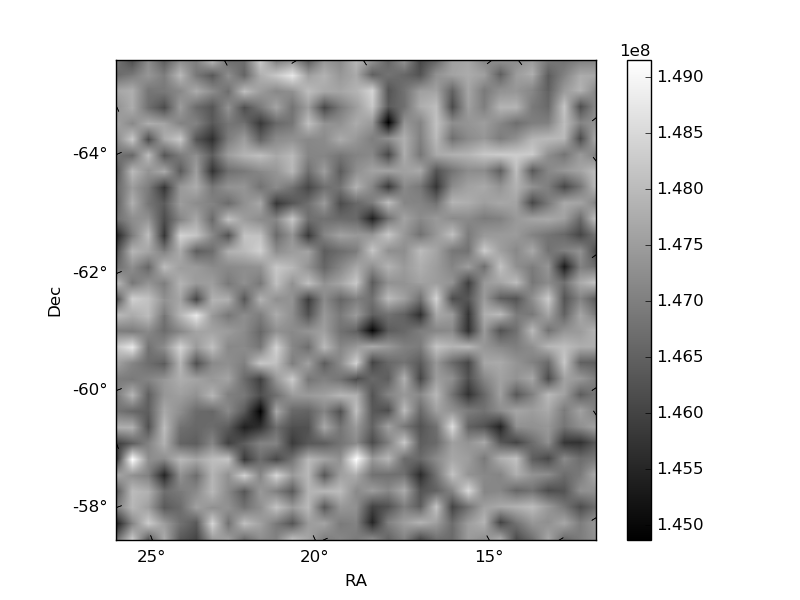
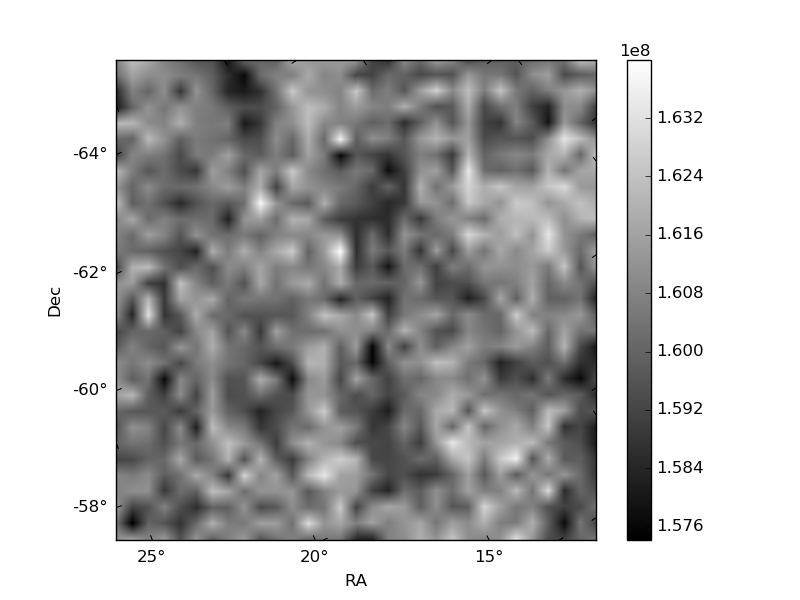
Histogram calculated using DETX and DETY for each event in the final _common_clean file
| Quadrant A | 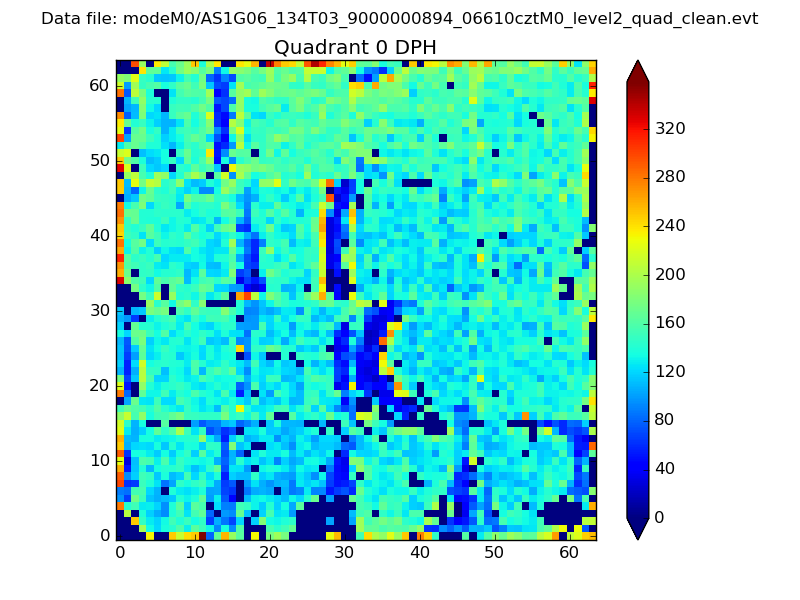 |
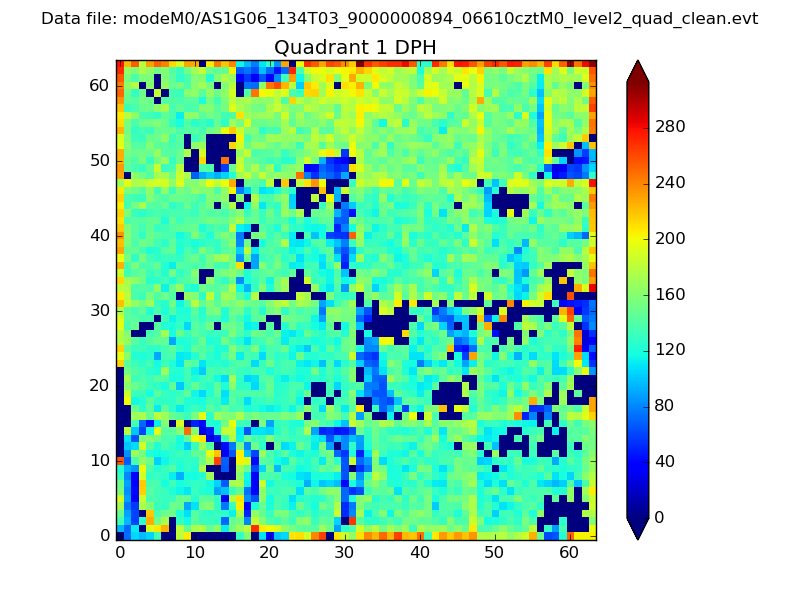 |
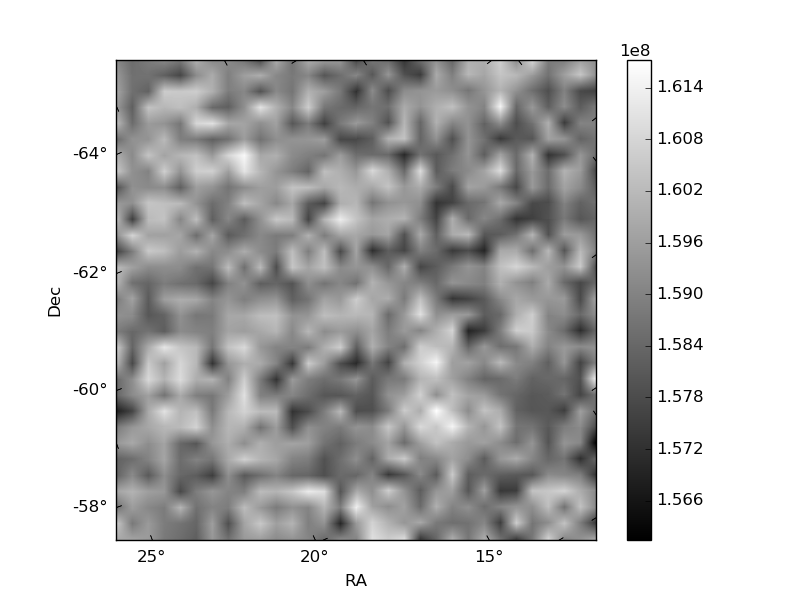
Quadrant B |
|---|---|---|---|
| Quadrant D | 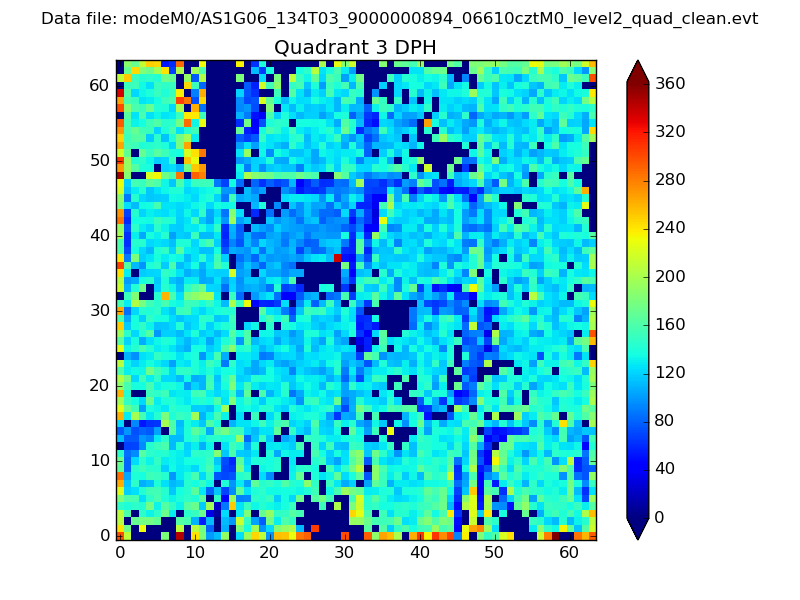 |
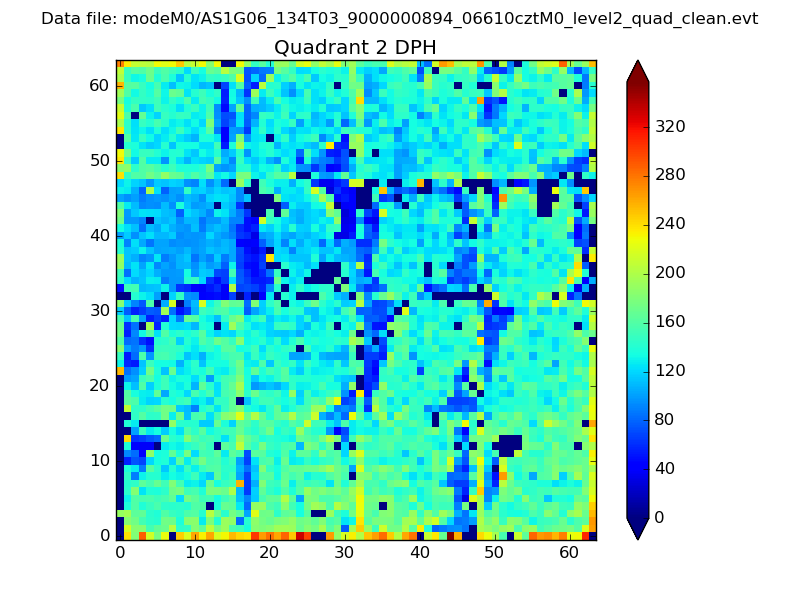 |
Quadrant C |
| Plot type | Count rate plots | Images |
|---|---|---|
| Comparison with Poisson distribution Blue bars denote a histogram of data divided into 1 sec bins. Red curve is a Poisson curve with rate = median count rate of data. |
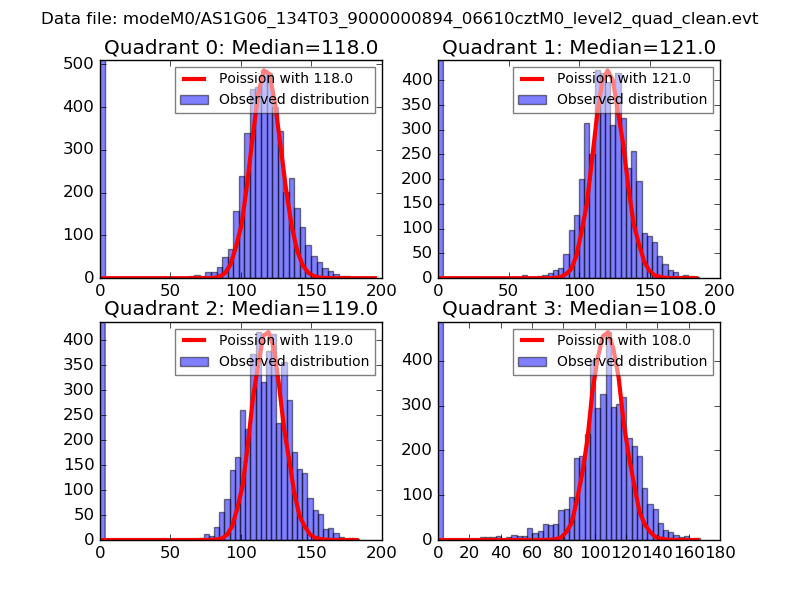 |
 |
| Quadrant-wise count rates Data is divided into 100 sec bins |
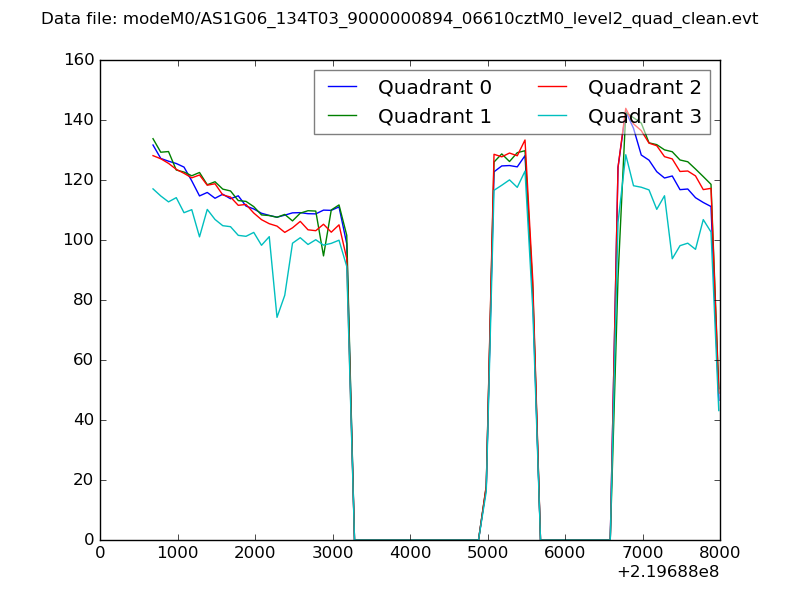 |
|
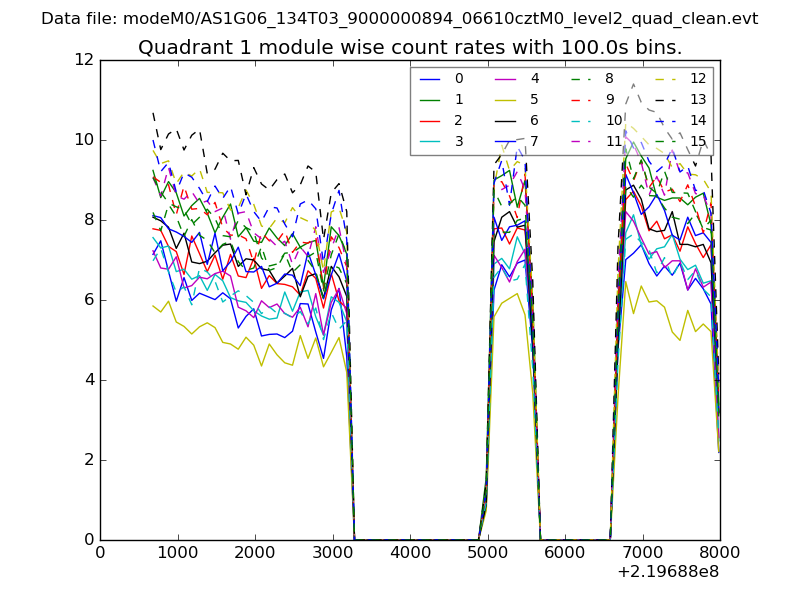
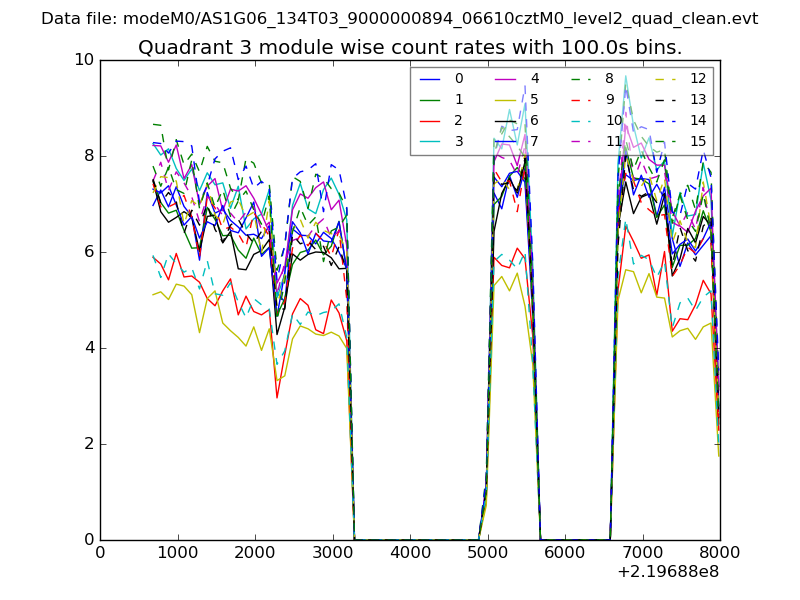
| Module-wise count rates for Quadrant A Data is divided into 100 sec bins |
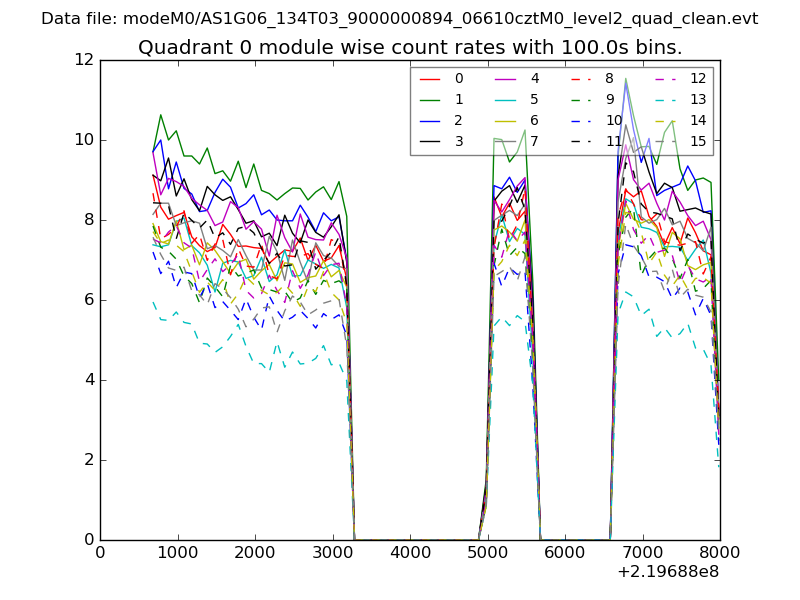 |
 |
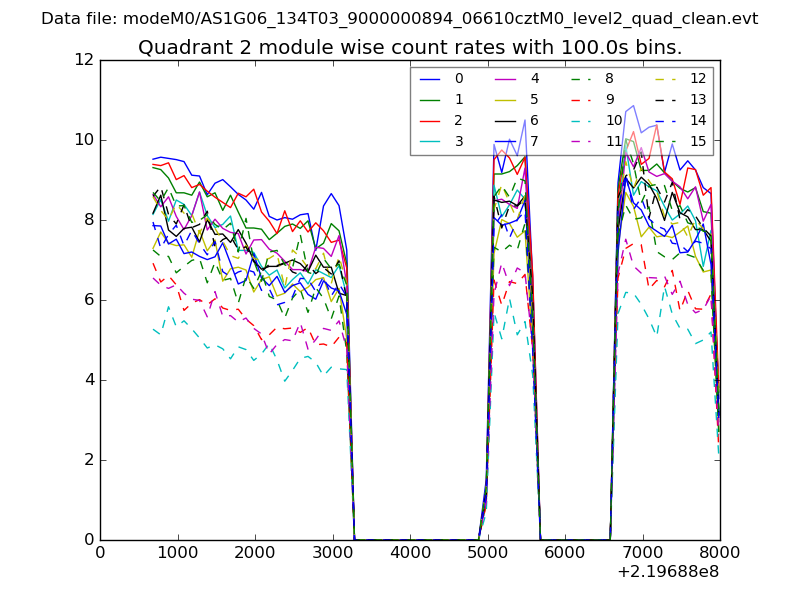
| Module-wise count rates for Quadrant B Data is divided into 100 sec bins |
 |
 |
| Module-wise count rates for Quadrant C Data is divided into 100 sec bins |
 |
 |
| Module-wise count rates for Quadrant D Data is divided into 100 sec bins |
 |
 |
| Parameter | Plot |
|---|---|
| CZT HV Monitor | 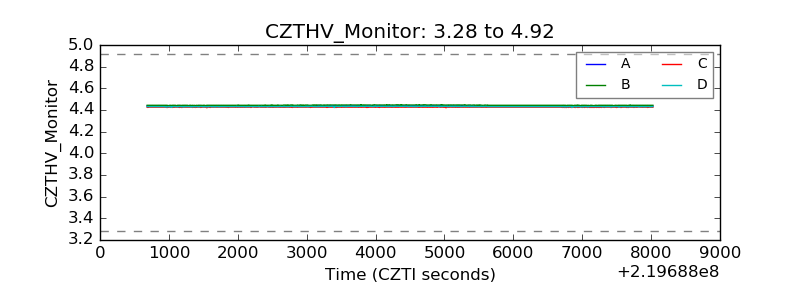 |
| D_VDD | 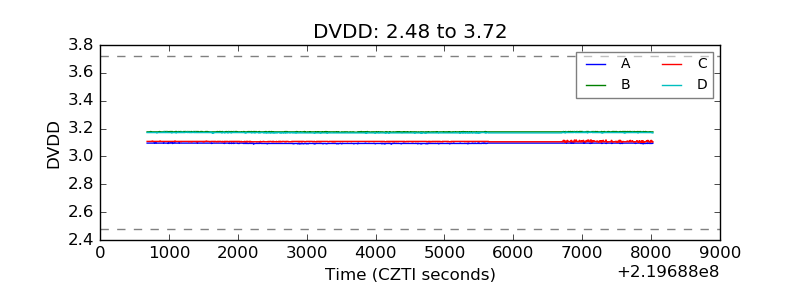 |
| Temperature 1 | 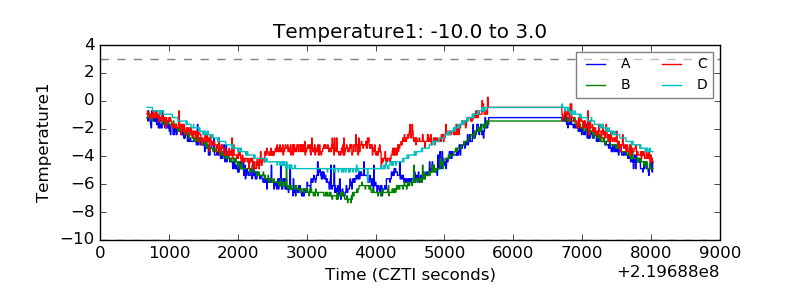 |
| Veto HV Monitor | 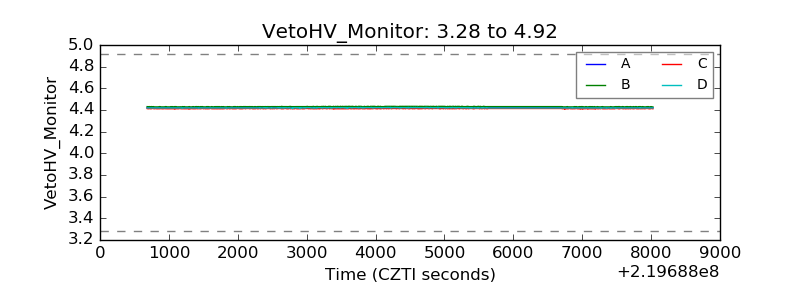 |
| Veto LLD | 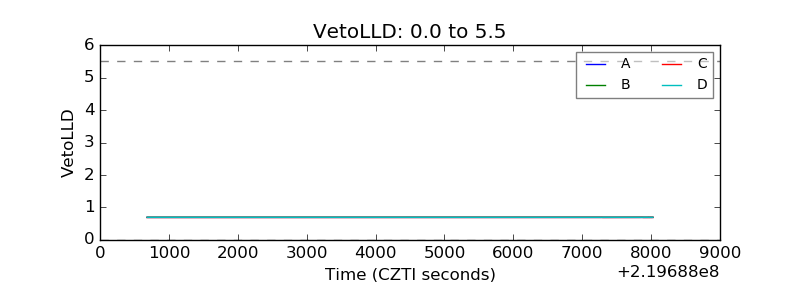 |
| Alpha Counter | 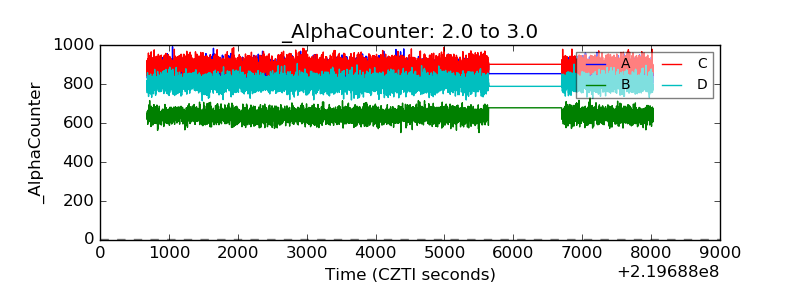 |
| _CPM_Rate | 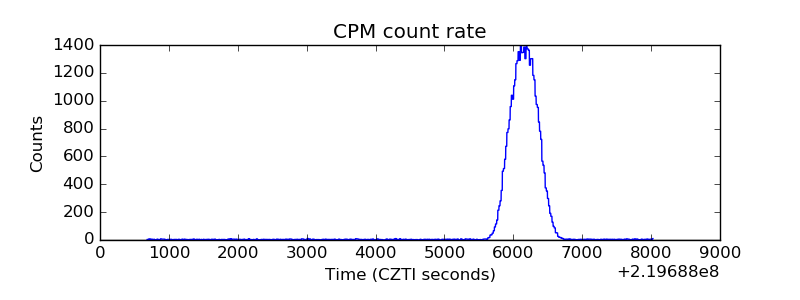 |
| CZT Counter | 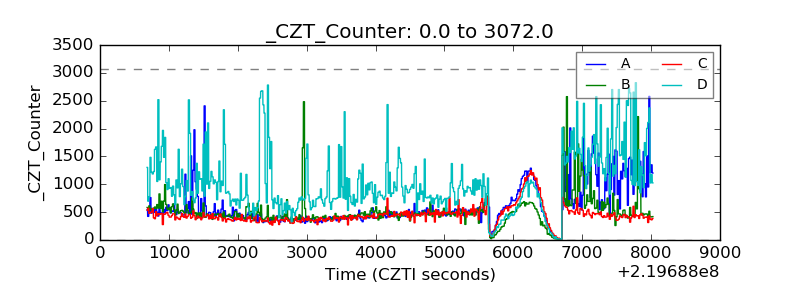 |
| +2.5 Volts monitor |  |
| +5 Volts monitor | 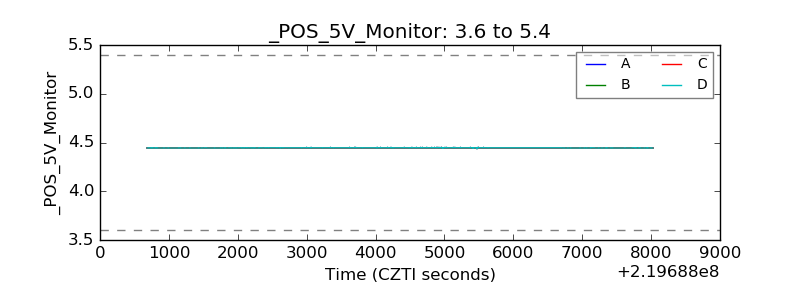 |
| _ROLL_ROT | 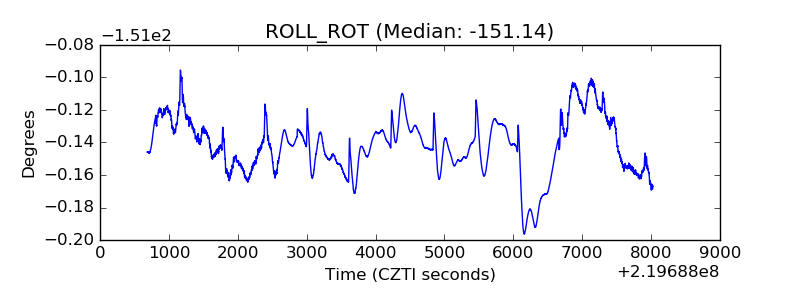 |
| _Roll_DEC | 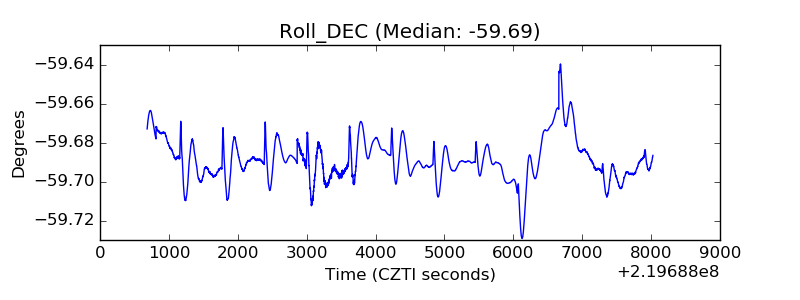 |
| _Roll_RA | 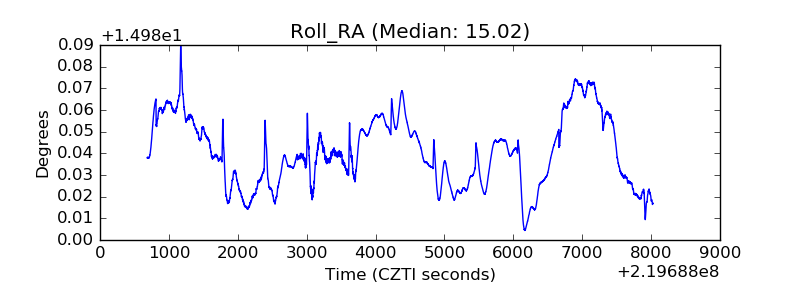 |
| Veto Counter | 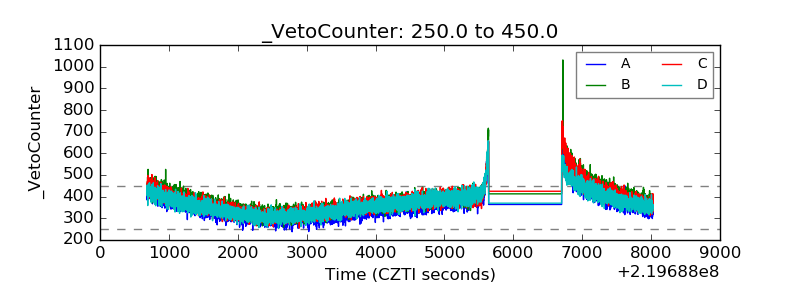 |