| Param | Original file | Final file |
|---|---|---|
| Filename | modeM0/AS1G06_134T03_9000000894_06612cztM0_level2.evt | modeM0/AS1G06_134T03_9000000894_06612cztM0_level2_quad_clean.evt |
| Size (bytes) | 635,688,000 | 87,920,640 |
| Size | 606.2 MB | 83.8 MB |
| Events in quadrant A | 4,384,161 | 564,821 |
| Events in quadrant B | 3,462,935 | 580,144 |
| Events in quadrant C | 2,839,050 | 573,832 |
| Events in quadrant D | 8,137,275 | 500,686 |
| Mode SS | |||
|---|---|---|---|
| Quadrant | BADHDUFLAG | Total packets | Discarded packets |
| A | 0 | 128 | 0 |
| B | 0 | 128 | 0 |
| C | 0 | 128 | 0 |
| D | 0 | 128 | 0 |
| Mode M0 | |||
|---|---|---|---|
| Quadrant | BADHDUFLAG | Total packets | Discarded packets |
| A | 0 | 17298 | 3 |
| B | 0 | 14577 | 2 |
| C | 0 | 12916 | 2 |
| D | 0 | 28686 | 2 |
| Mode M9 | |||
|---|---|---|---|
| Quadrant | BADHDUFLAG | Total packets | Discarded packets |
| A | 0 | 16 | 0 |
| B | 0 | 16 | 0 |
| C | 0 | 16 | 0 |
| D | 0 | 17 | 0 |
| Quadrant | Total seconds | Saturated seconds | Saturation percentage |
|---|---|---|---|
| A | 6346 | 109 | 1.717617% |
| B | 6346 | 117 | 1.843681% |
| C | 6346 | 11 | 0.173338% |
| D | 6346 | 749 | 11.802710% |
Noise dominated data is calculated using 1-second bins in cleaned event files. If a bin has >2000 counts, and if more than 50% of those come from <1% of pixels, then it is considered to be noise-dominated and hence unusable.
| Quadrant | # 1 sec bins | Bins with >0 counts | Bins with >2000 counts | High rate bins dominated by noise | Noise dominated (total time) | Noise dominated (detector-on time) | Marked lightcurve |
|---|---|---|---|---|---|---|---|
| A | 7536 | 6347 | 55 | 55 | 0.73% | 0.87% | 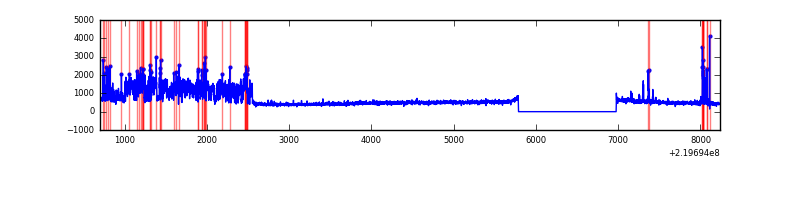 |
| B | 7536 | 6347 | 53 | 53 | 0.70% | 0.84% | 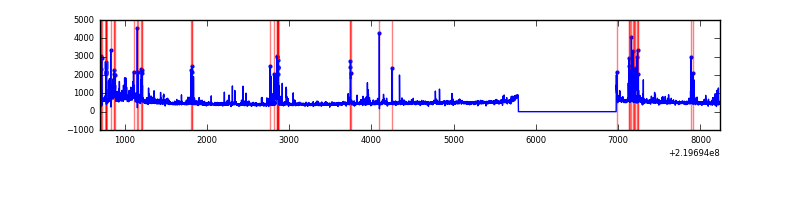 |
| C | 7536 | 6347 | 3 | 3 | 0.04% | 0.05% | 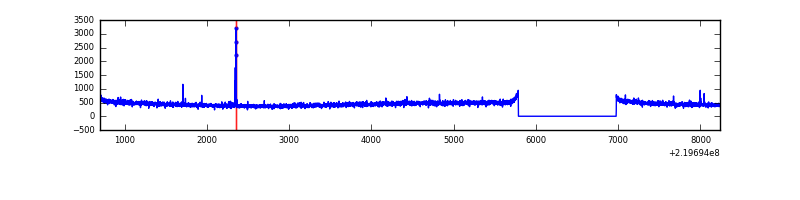 |
| D | 7536 | 6347 | 776 | 776 | 10.30% | 12.23% | 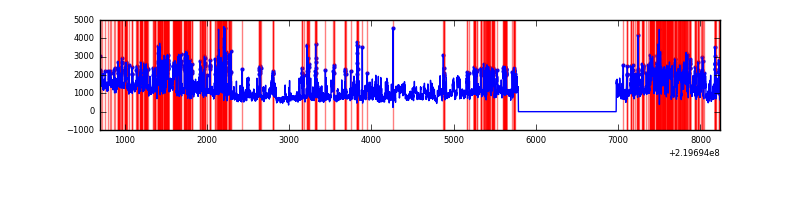 |
Top three noisy pixels from each quadrant. If the there are fewer than three noisy pixels in the level2.evt file, extra rows are filled as -1
| Pixel properties | Quadrant properties | ||||||
|---|---|---|---|---|---|---|---|
| Quadrant | DetID | PixID | Counts | Sigma | Mean | Median | Sigma |
| A | 8 | 15 | 1342156 | 8931.84 | 734 | 720 | 150.2 |
| A | 13 | 248 | 100268 | 662.83 | 734 | 720 | 150.2 |
| A | 14 | 111 | 64406 | 424.04 | 734 | 720 | 150.2 |
| B | 0 | 219 | 270672 | 1915.14 | 745 | 727 | 141.0 |
| B | 4 | 80 | 115155 | 811.82 | 745 | 727 | 141.0 |
| B | 4 | 170 | 82690 | 581.49 | 745 | 727 | 141.0 |
| C | 7 | 255 | 18057 | 104.88 | 715 | 719 | 165.3 |
| C | 8 | 128 | 11575 | 65.67 | 715 | 719 | 165.3 |
| C | 8 | 112 | 6444 | 34.63 | 715 | 719 | 165.3 |
| D | 8 | 195 | 3469950 | 20368.06 | 684 | 660 | 170.3 |
| D | 12 | 221 | 1035640 | 6076.33 | 684 | 660 | 170.3 |
| D | 2 | 33 | 282032 | 1651.92 | 684 | 660 | 170.3 |
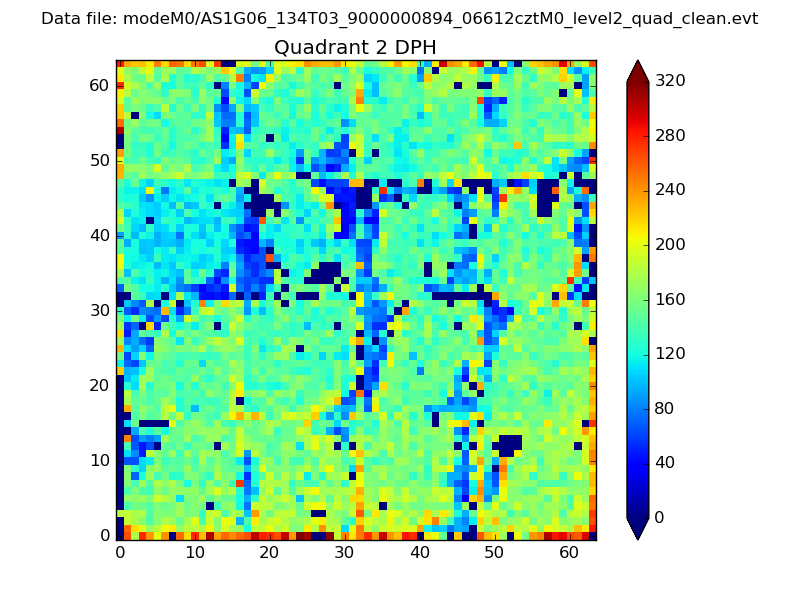
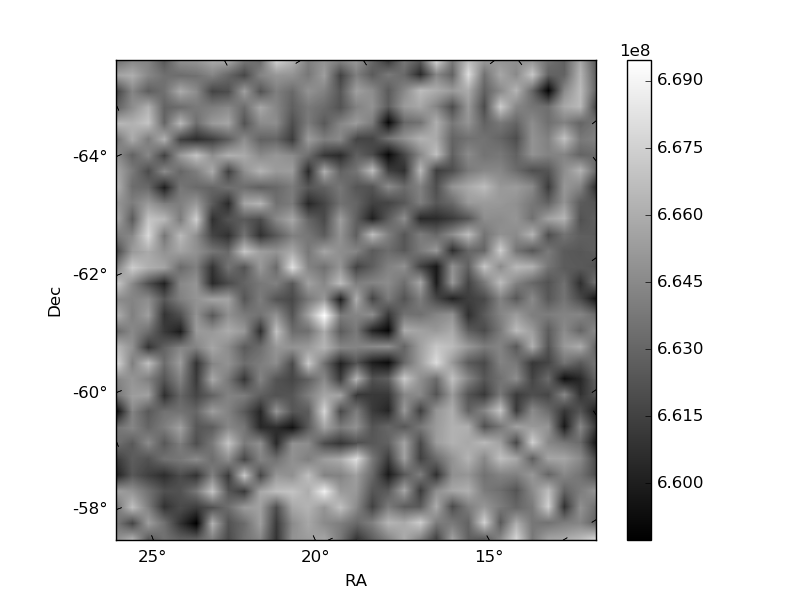
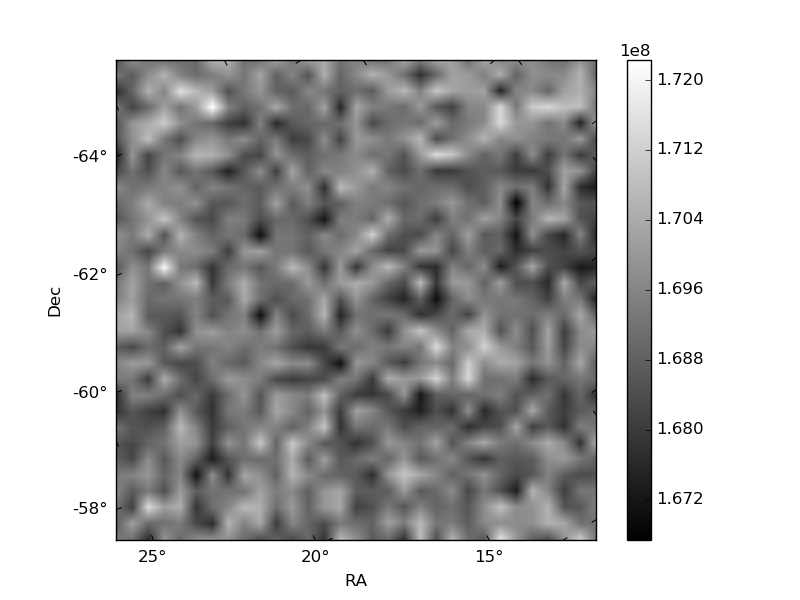
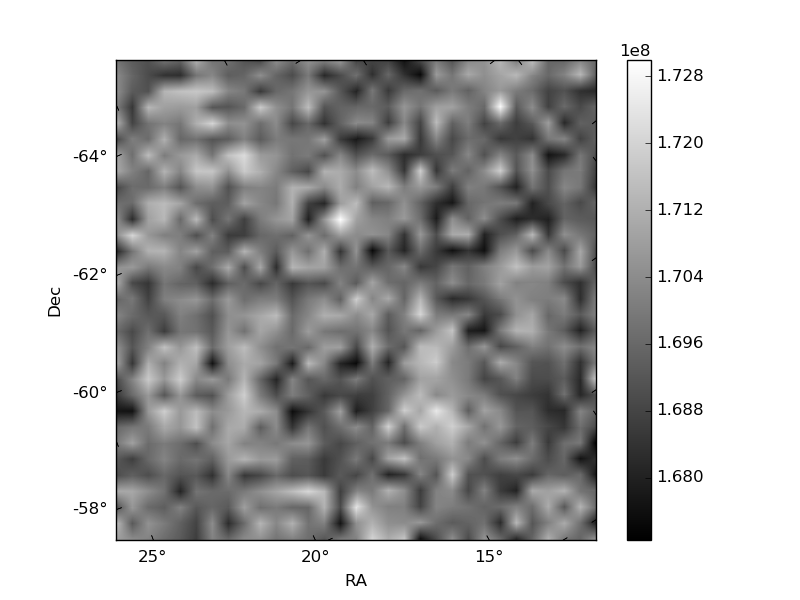
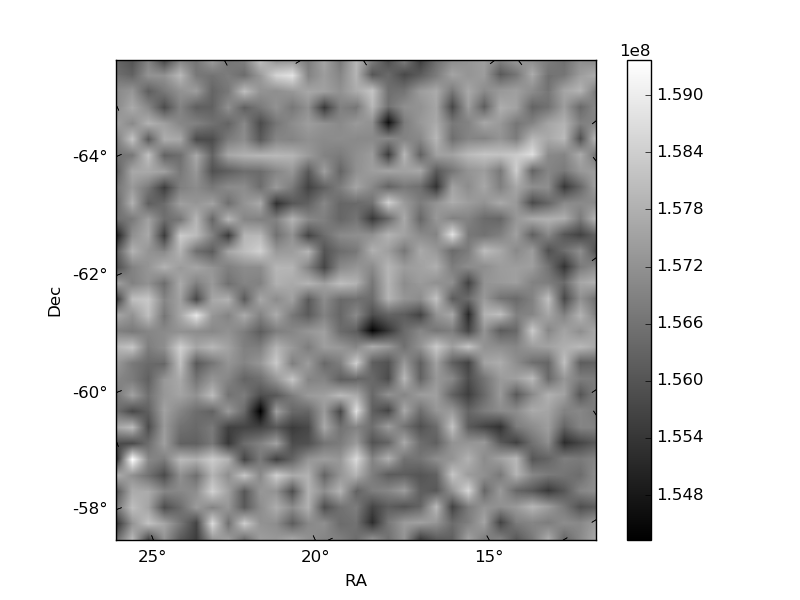
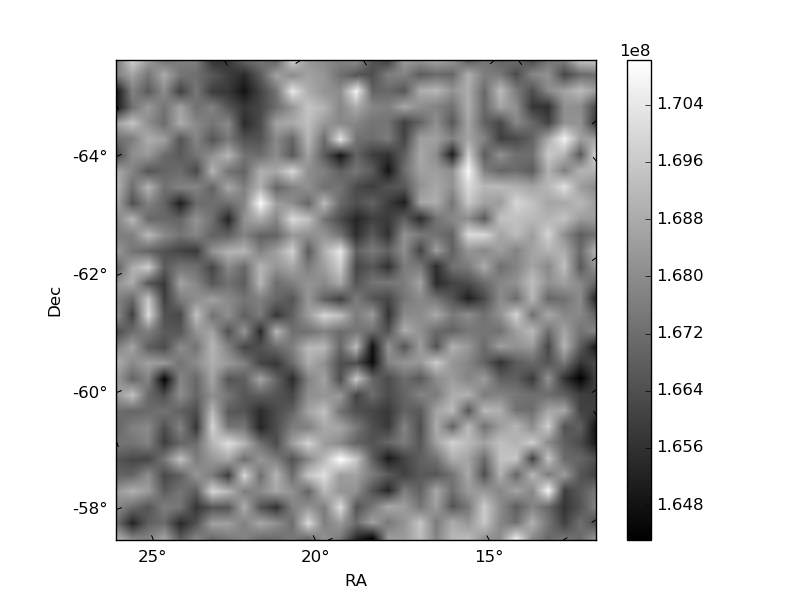
Histogram calculated using DETX and DETY for each event in the final _common_clean file
| Quadrant A | 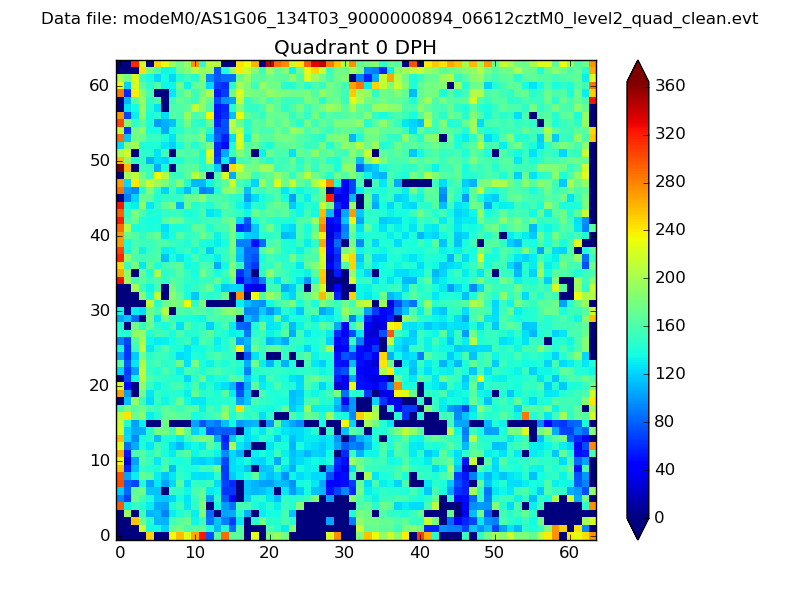 |
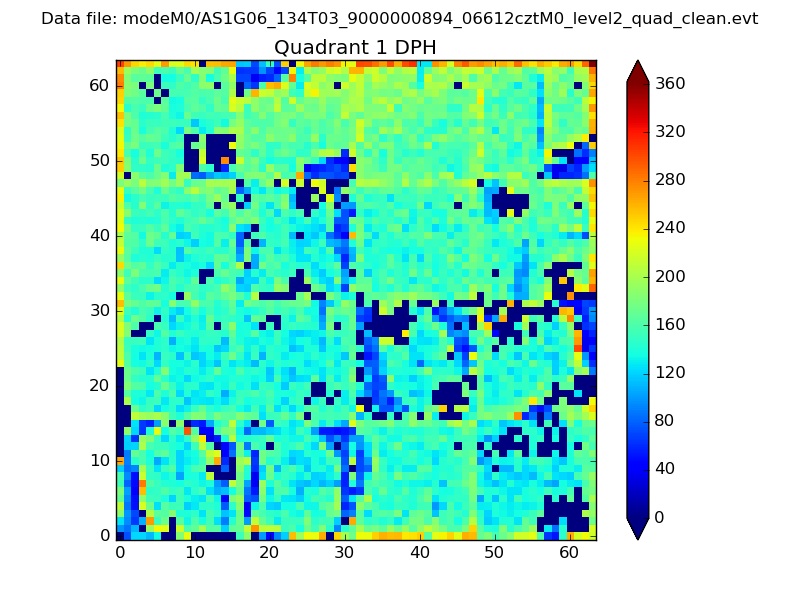 |
Quadrant B |
|---|---|---|---|
| Quadrant D | 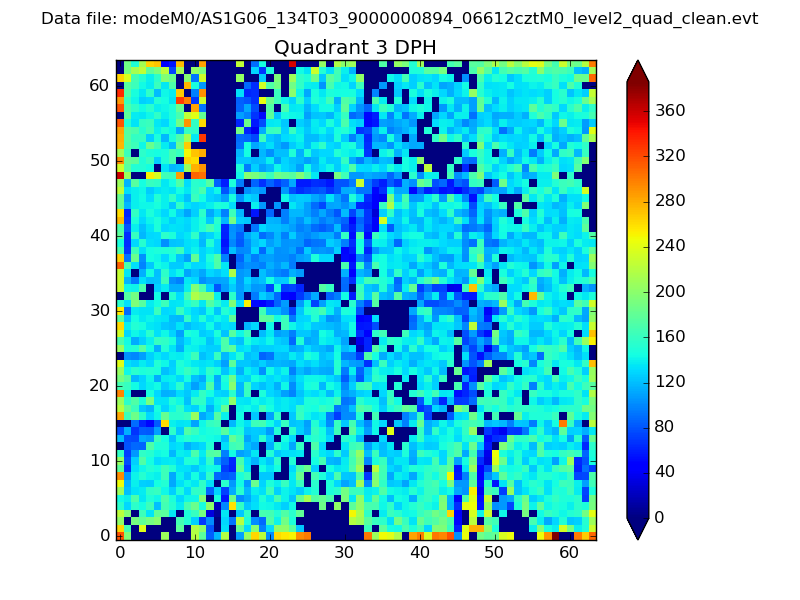 |
 |
Quadrant C |
| Plot type | Count rate plots | Images |
|---|---|---|
| Comparison with Poisson distribution Blue bars denote a histogram of data divided into 1 sec bins. Red curve is a Poisson curve with rate = median count rate of data. |
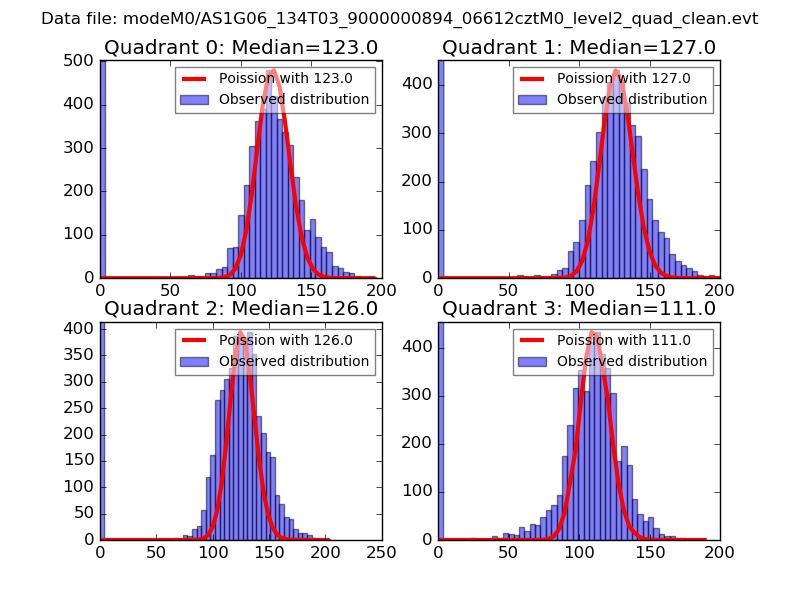 |
 |
| Quadrant-wise count rates Data is divided into 100 sec bins |
 |
|
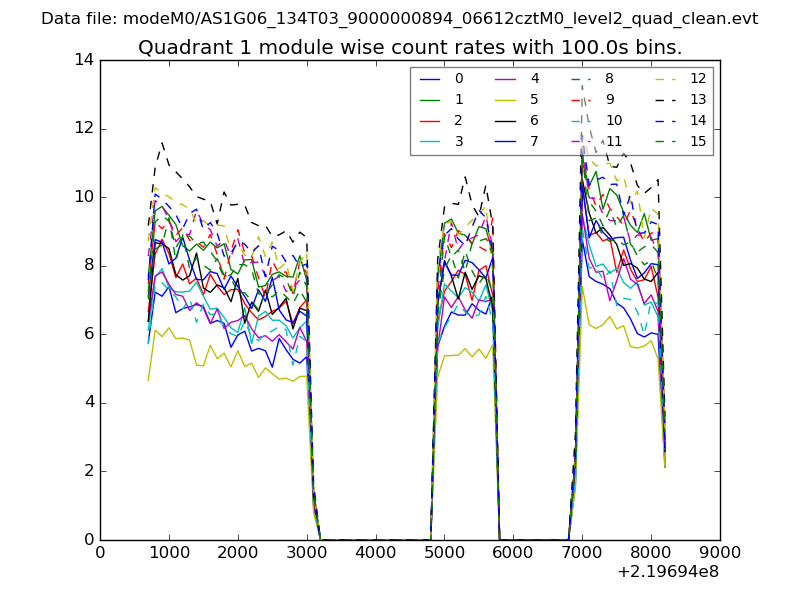
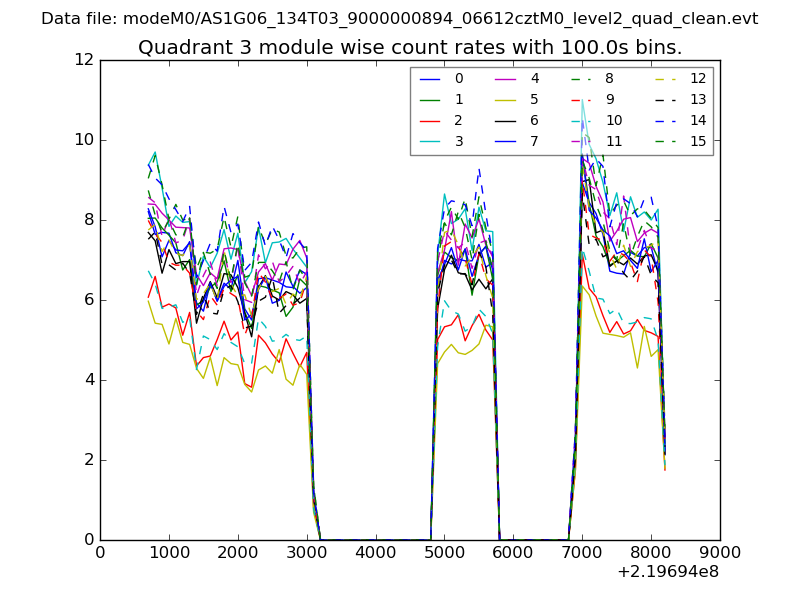
| Module-wise count rates for Quadrant A Data is divided into 100 sec bins |
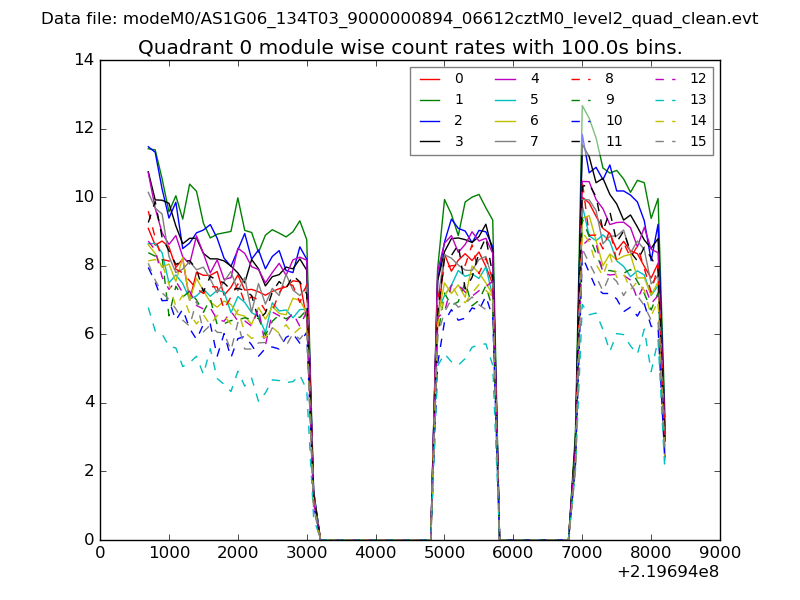 |
 |
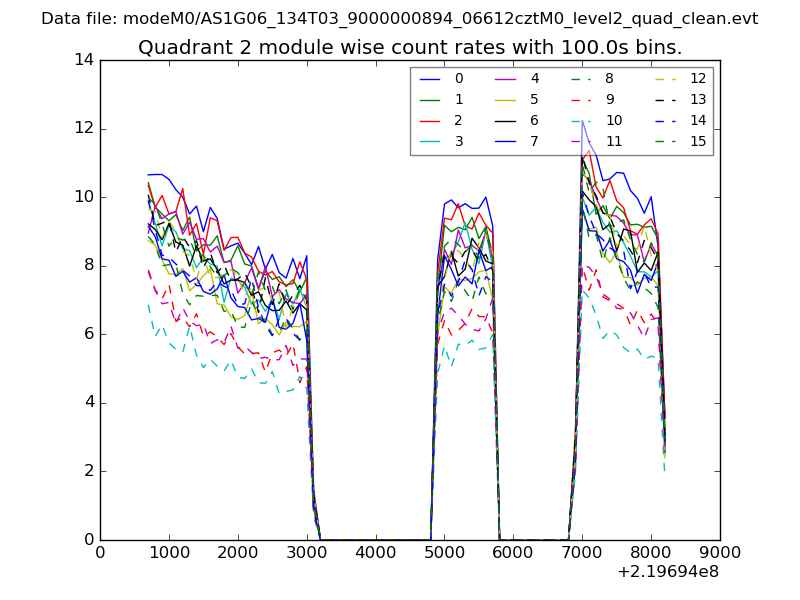
| Module-wise count rates for Quadrant B Data is divided into 100 sec bins |
 |
 |
| Module-wise count rates for Quadrant C Data is divided into 100 sec bins |
 |
 |
| Module-wise count rates for Quadrant D Data is divided into 100 sec bins |
 |
 |
| Parameter | Plot |
|---|---|
| CZT HV Monitor | 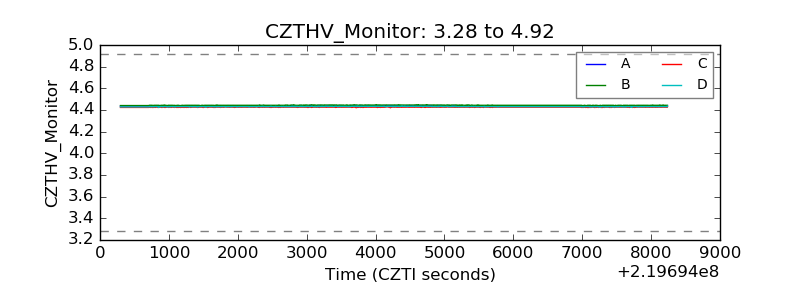 |
| D_VDD |  |
| Temperature 1 | 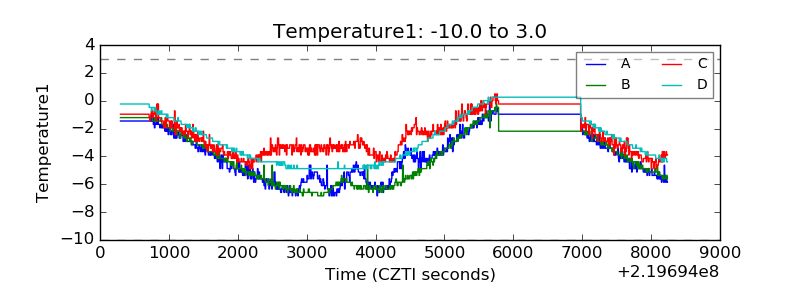 |
| Veto HV Monitor | 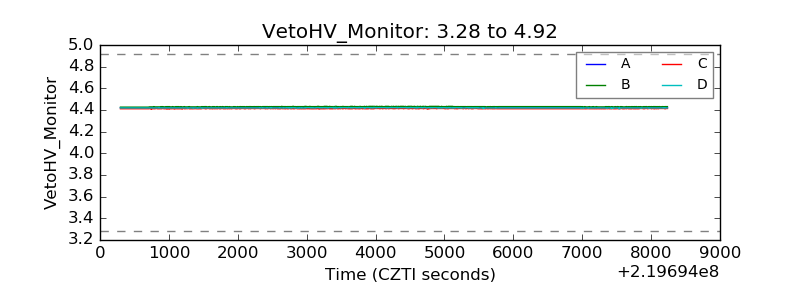 |
| Veto LLD | 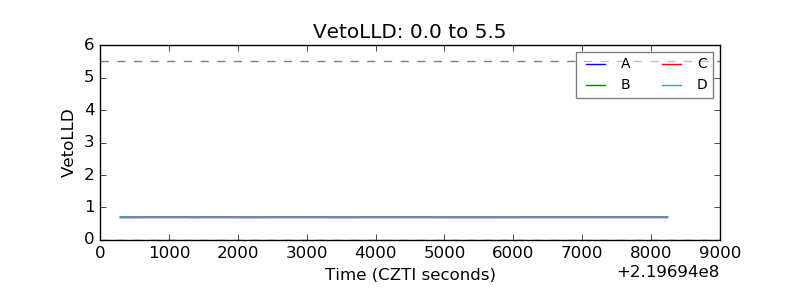 |
| Alpha Counter | 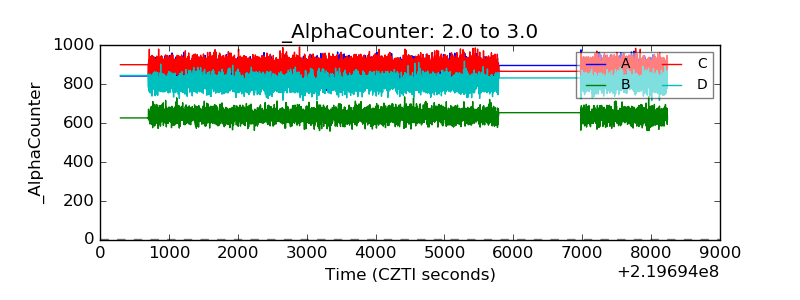 |
| _CPM_Rate | 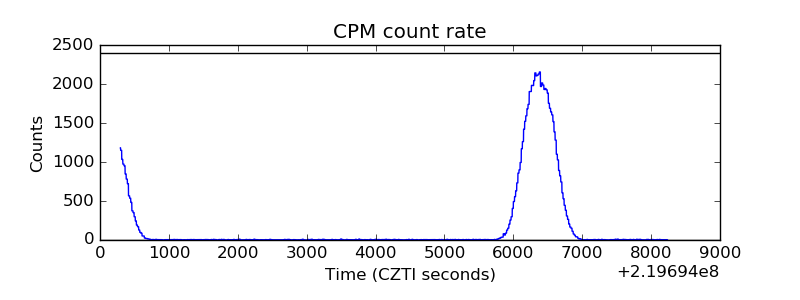 |
| CZT Counter | 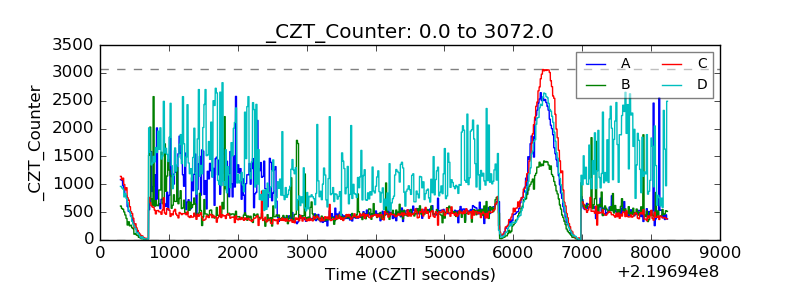 |
| +2.5 Volts monitor |  |
| +5 Volts monitor |  |
| _ROLL_ROT | 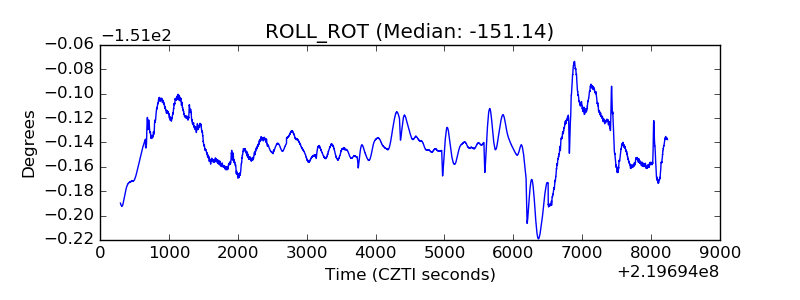 |
| _Roll_DEC | 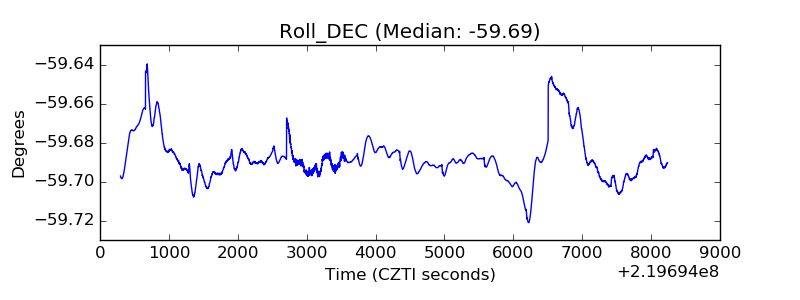 |
| _Roll_RA | 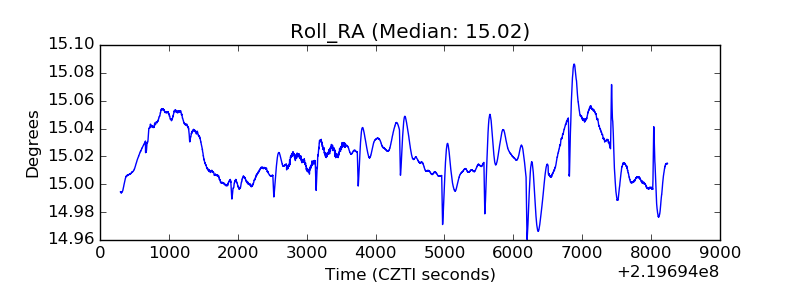 |
| Veto Counter | 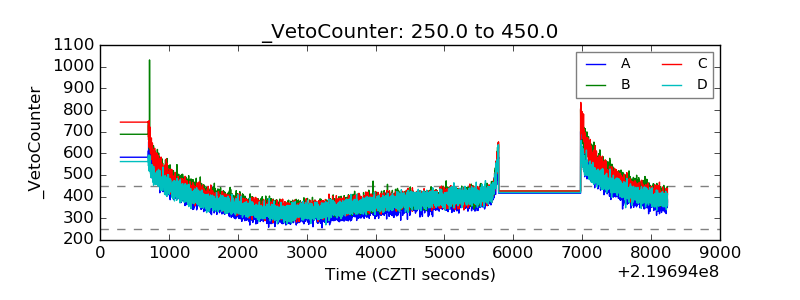 |