| Param | Original file | Final file |
|---|---|---|
| Filename | modeM0/AS1G06_134T03_9000000894_06615cztM0_level2.evt | modeM0/AS1G06_134T03_9000000894_06615cztM0_level2_quad_clean.evt |
| Size (bytes) | 1,245,908,160 | 194,558,400 |
| Size | 1.2 GB | 185.5 MB |
| Events in quadrant A | 8,385,765 | 1,225,281 |
| Events in quadrant B | 7,777,642 | 1,262,990 |
| Events in quadrant C | 6,778,138 | 1,244,622 |
| Events in quadrant D | 13,779,800 | 1,124,579 |
| Mode SS | |||
|---|---|---|---|
| Quadrant | BADHDUFLAG | Total packets | Discarded packets |
| A | 0 | 306 | 0 |
| B | 0 | 306 | 0 |
| C | 0 | 306 | 0 |
| D | 0 | 306 | 0 |
| Mode M0 | |||
|---|---|---|---|
| Quadrant | BADHDUFLAG | Total packets | Discarded packets |
| A | 0 | 34939 | 3 |
| B | 0 | 33024 | 3 |
| C | 0 | 30523 | 3 |
| D | 0 | 51327 | 3 |
| Mode M9 | |||
|---|---|---|---|
| Quadrant | BADHDUFLAG | Total packets | Discarded packets |
| A | 0 | 38 | 0 |
| B | 0 | 38 | 0 |
| C | 0 | 38 | 0 |
| D | 0 | 38 | 0 |
| Quadrant | Total seconds | Saturated seconds | Saturation percentage |
|---|---|---|---|
| A | 14996 | 136 | 0.906909% |
| B | 14996 | 168 | 1.120299% |
| C | 14996 | 26 | 0.173380% |
| D | 14996 | 825 | 5.501467% |
Noise dominated data is calculated using 1-second bins in cleaned event files. If a bin has >2000 counts, and if more than 50% of those come from <1% of pixels, then it is considered to be noise-dominated and hence unusable.
| Quadrant | # 1 sec bins | Bins with >0 counts | Bins with >2000 counts | High rate bins dominated by noise | Noise dominated (total time) | Noise dominated (detector-on time) | Marked lightcurve |
|---|---|---|---|---|---|---|---|
| A | 18806 | 14999 | 56 | 56 | 0.30% | 0.37% | 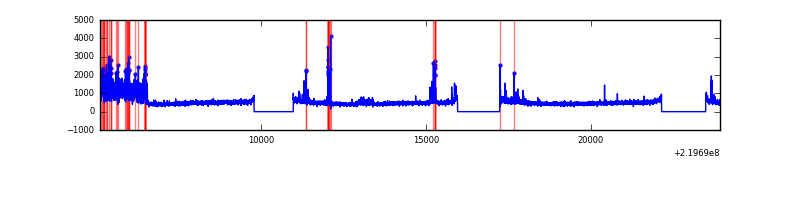 |
| B | 18806 | 14999 | 65 | 65 | 0.35% | 0.43% | 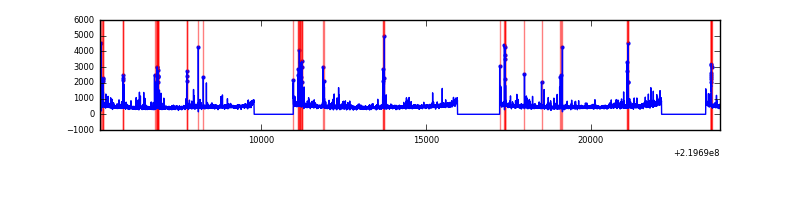 |
| C | 18806 | 14999 | 3 | 3 | 0.02% | 0.02% | 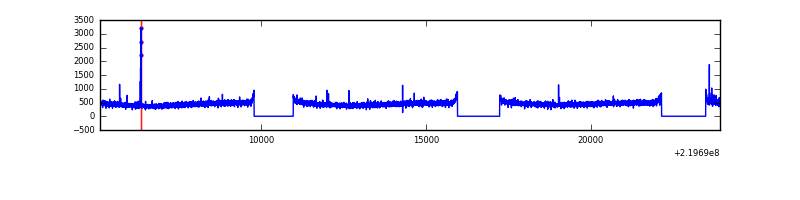 |
| D | 18806 | 14999 | 828 | 828 | 4.40% | 5.52% | 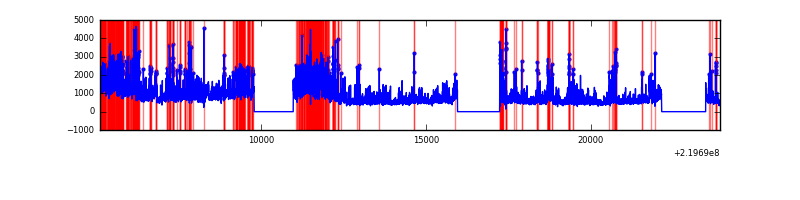 |
Top three noisy pixels from each quadrant. If the there are fewer than three noisy pixels in the level2.evt file, extra rows are filled as -1
| Pixel properties | Quadrant properties | ||||||
|---|---|---|---|---|---|---|---|
| Quadrant | DetID | PixID | Counts | Sigma | Mean | Median | Sigma |
| A | 8 | 15 | 1381378 | 3938.71 | 1744 | 1709 | 350.3 |
| A | 13 | 248 | 163890 | 463.0 | 1744 | 1709 | 350.3 |
| A | 14 | 111 | 67292 | 187.23 | 1744 | 1709 | 350.3 |
| B | 0 | 219 | 339582 | 1024.6 | 1776 | 1734 | 329.7 |
| B | 4 | 81 | 126253 | 377.63 | 1776 | 1734 | 329.7 |
| B | 0 | 214 | 124642 | 372.74 | 1776 | 1734 | 329.7 |
| C | 8 | 128 | 22101 | 51.96 | 1715 | 1728 | 392.1 |
| C | 7 | 255 | 19155 | 44.44 | 1715 | 1728 | 392.1 |
| C | 9 | 54 | 17973 | 41.43 | 1715 | 1728 | 392.1 |
| D | 8 | 195 | 4734052 | 11663.75 | 1667 | 1613 | 405.7 |
| D | 12 | 221 | 823781 | 2026.35 | 1667 | 1613 | 405.7 |
| D | 2 | 136 | 540330 | 1327.74 | 1667 | 1613 | 405.7 |
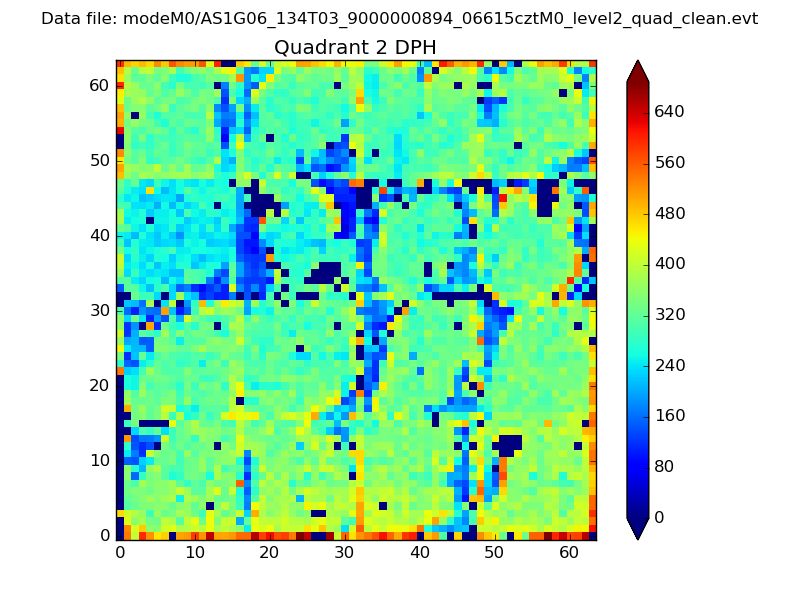
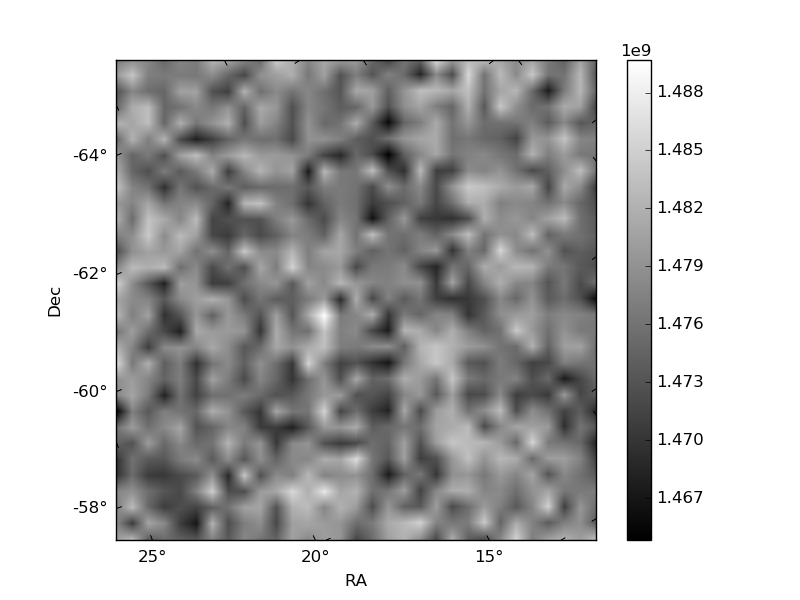
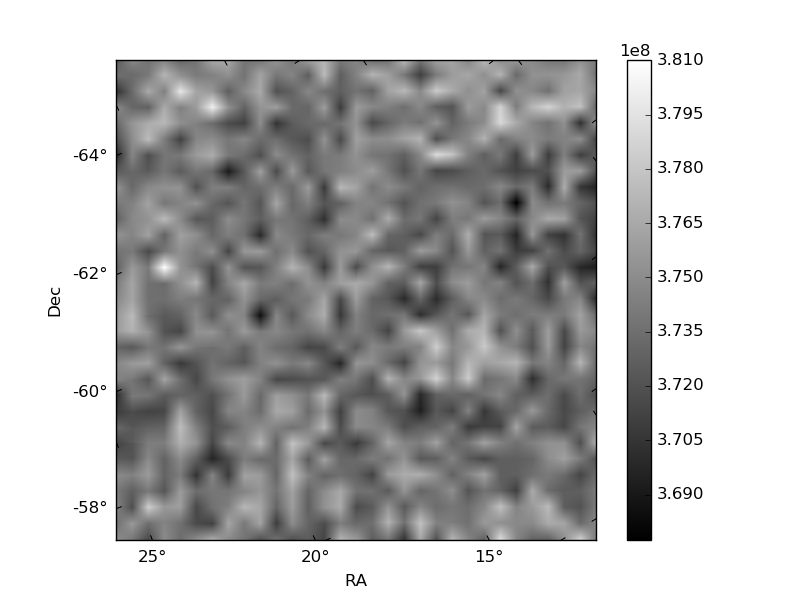
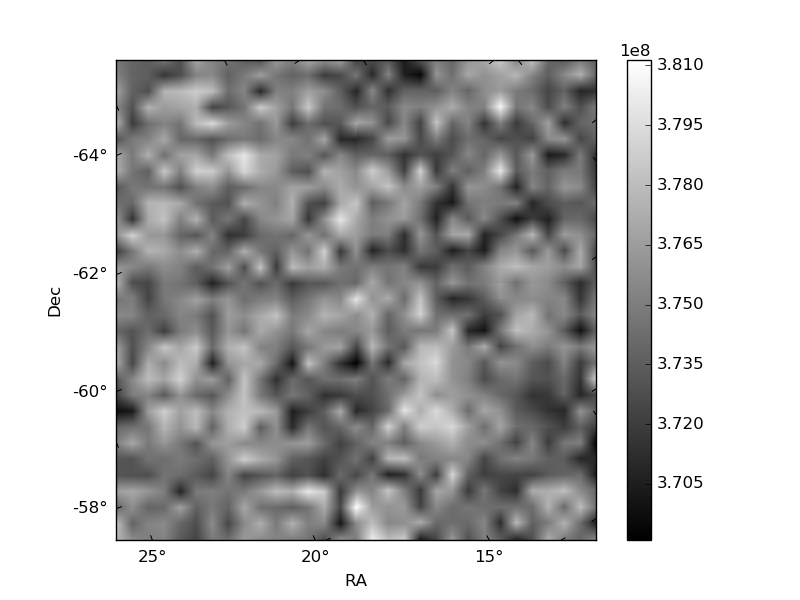
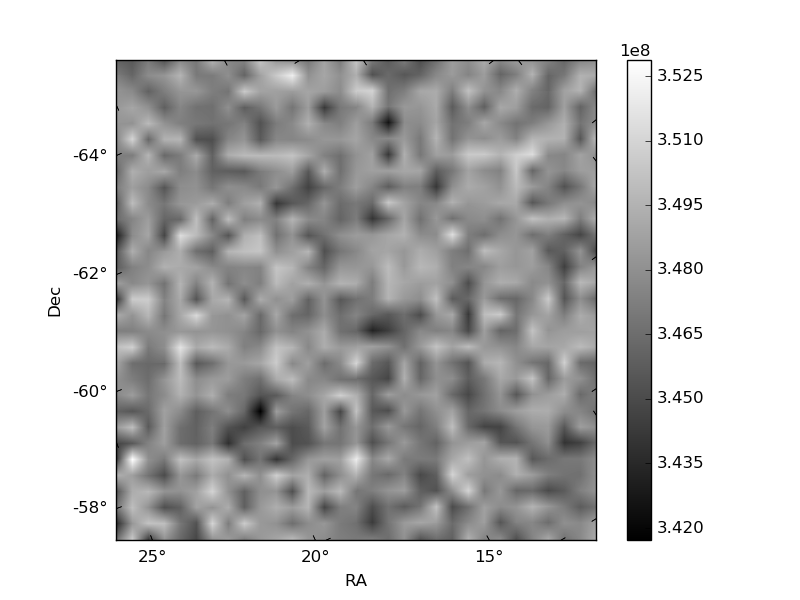
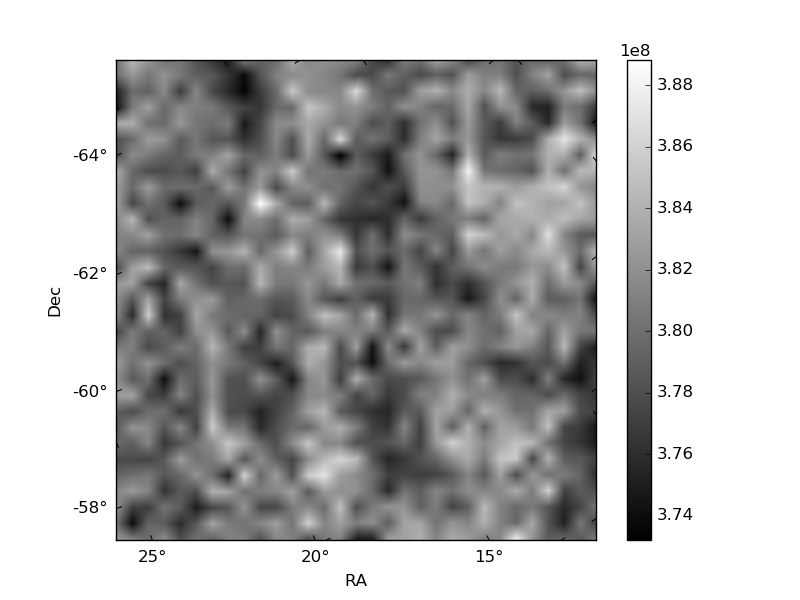
Histogram calculated using DETX and DETY for each event in the final _common_clean file
| Quadrant A | 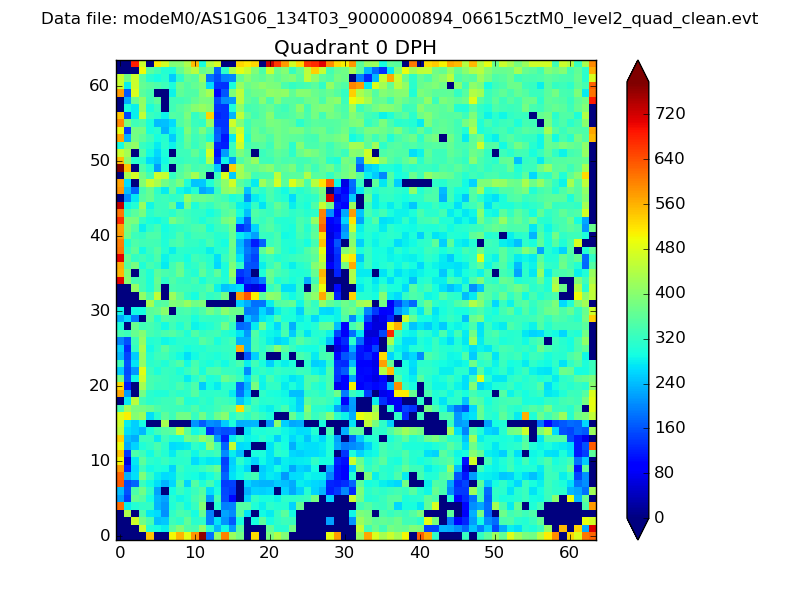 |
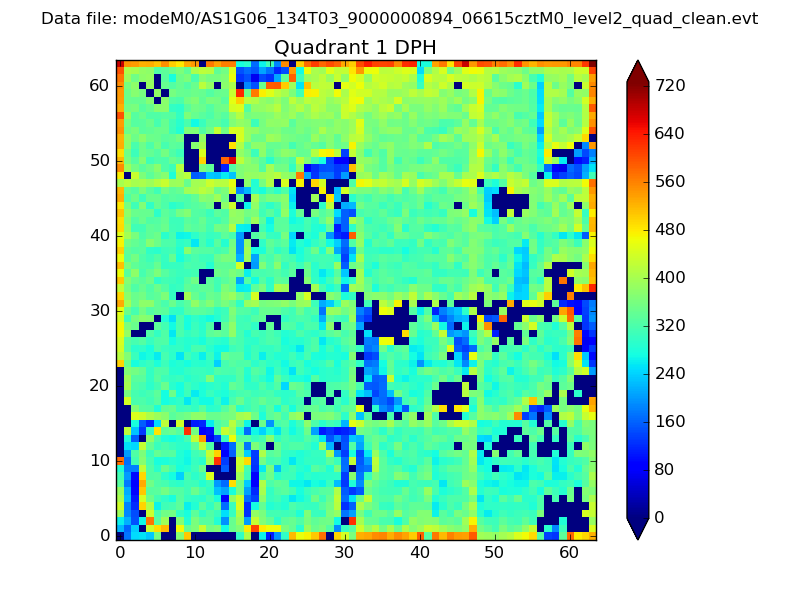 |
Quadrant B |
|---|---|---|---|
| Quadrant D | 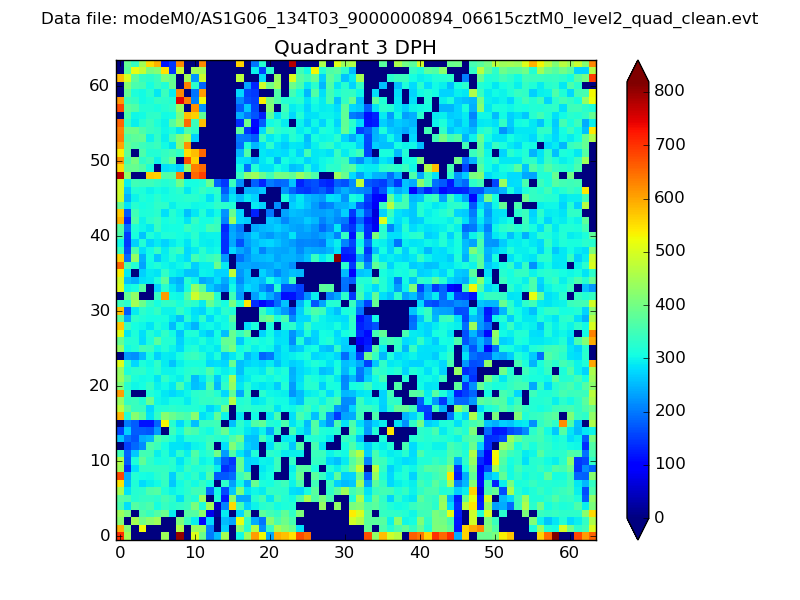 |
 |
Quadrant C |
| Plot type | Count rate plots | Images |
|---|---|---|
| Comparison with Poisson distribution Blue bars denote a histogram of data divided into 1 sec bins. Red curve is a Poisson curve with rate = median count rate of data. |
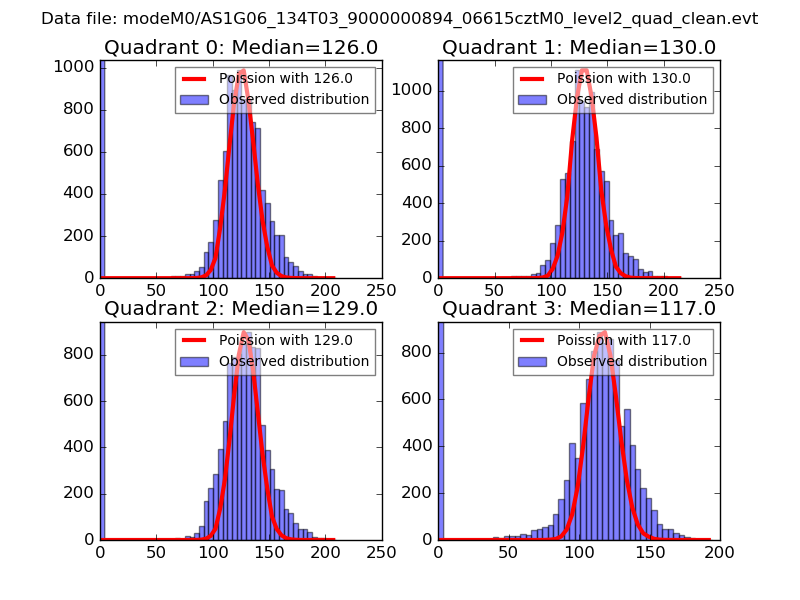 |
 |
| Quadrant-wise count rates Data is divided into 100 sec bins |
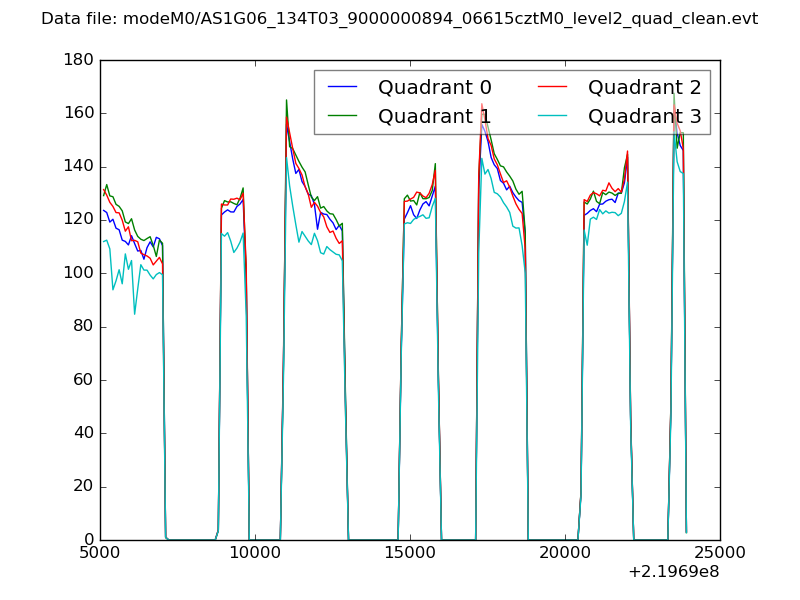 |
|
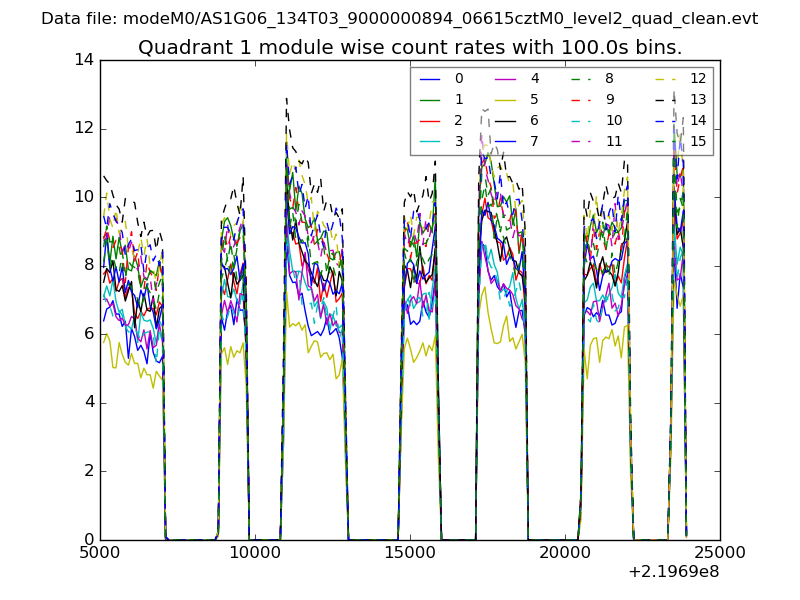
| Module-wise count rates for Quadrant A Data is divided into 100 sec bins |
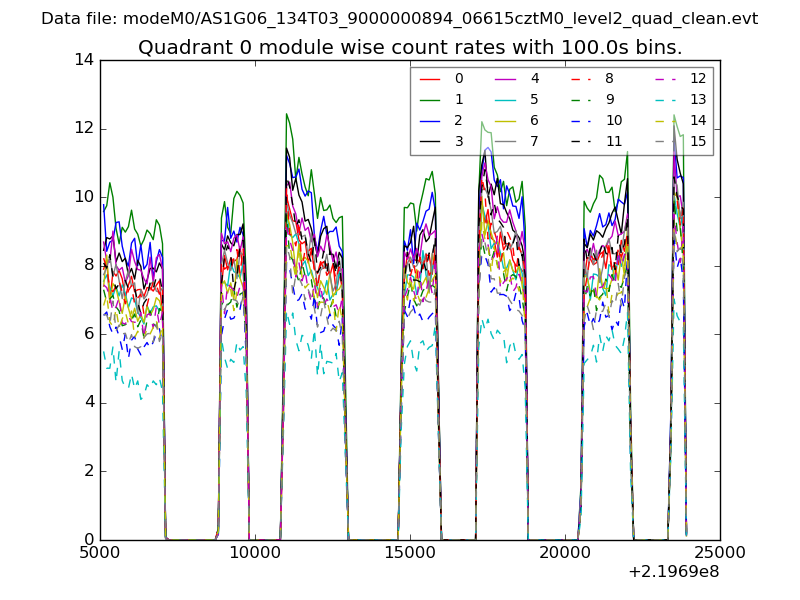 |
 |
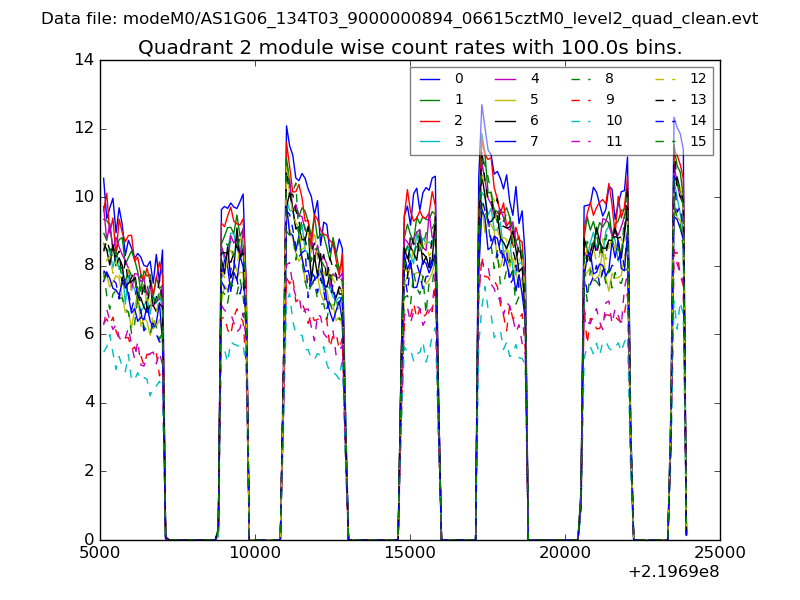
| Module-wise count rates for Quadrant B Data is divided into 100 sec bins |
 |
 |
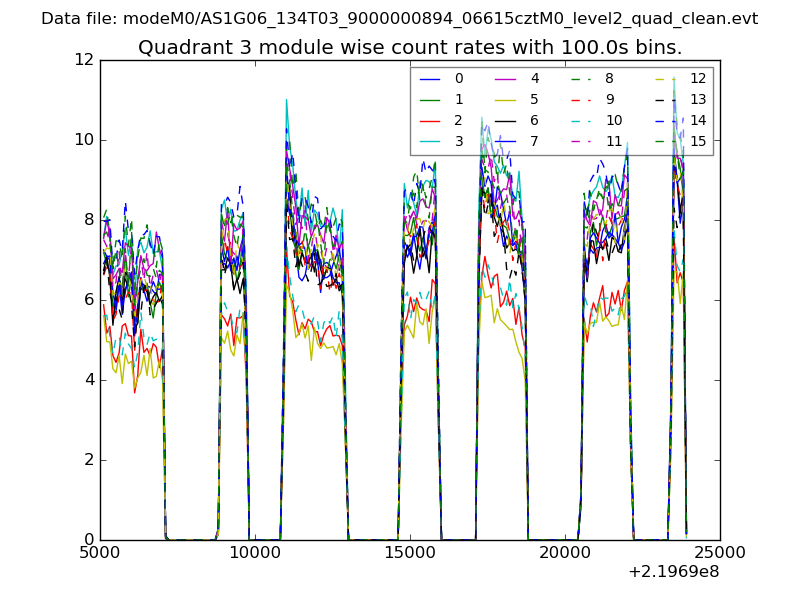
| Module-wise count rates for Quadrant C Data is divided into 100 sec bins |
 |
 |
| Module-wise count rates for Quadrant D Data is divided into 100 sec bins |
 |
 |
| Parameter | Plot |
|---|---|
| CZT HV Monitor | 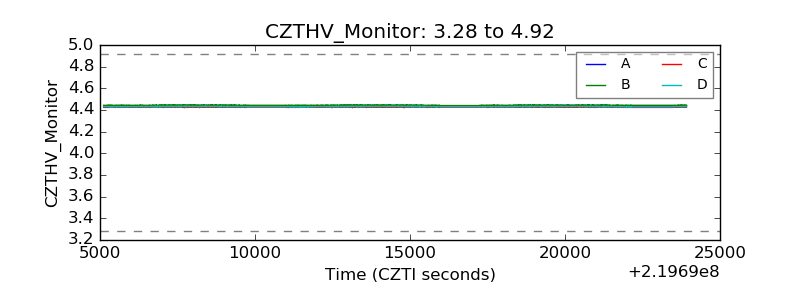 |
| D_VDD | 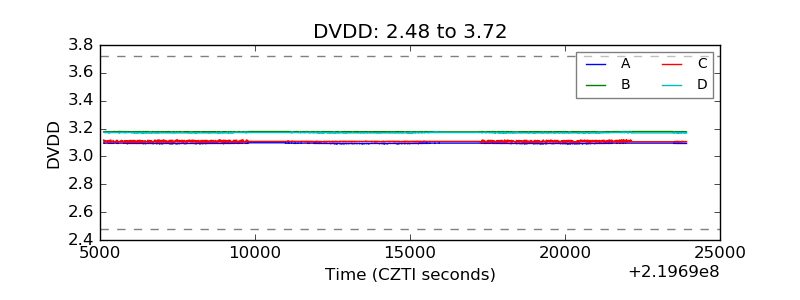 |
| Temperature 1 | 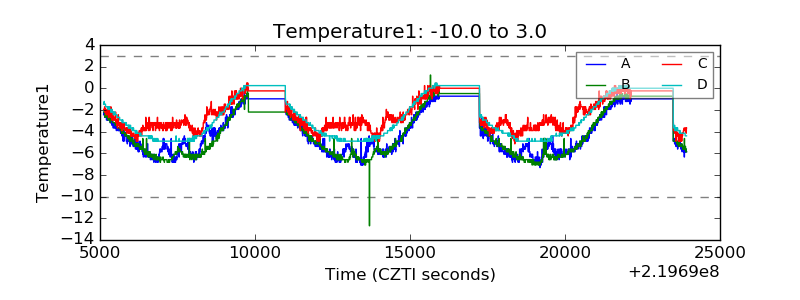 |
| Veto HV Monitor | 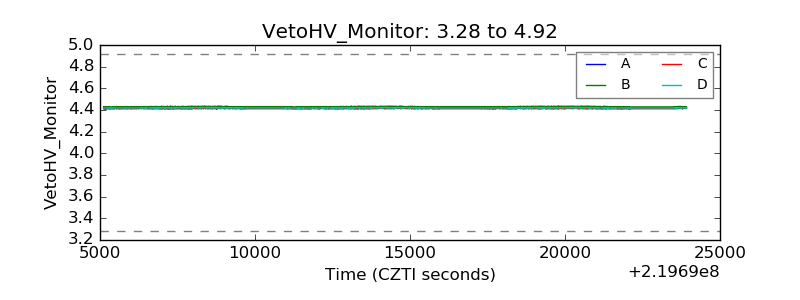 |
| Veto LLD | 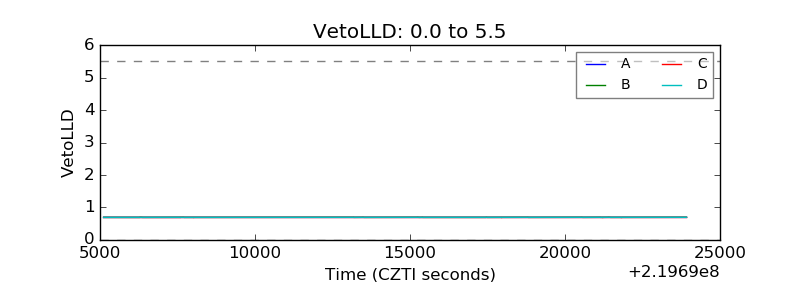 |
| Alpha Counter | 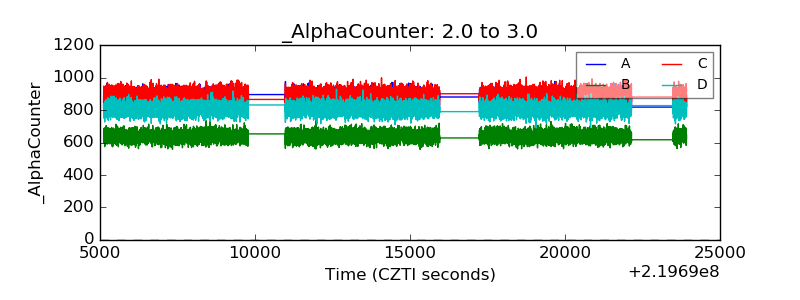 |
| _CPM_Rate | 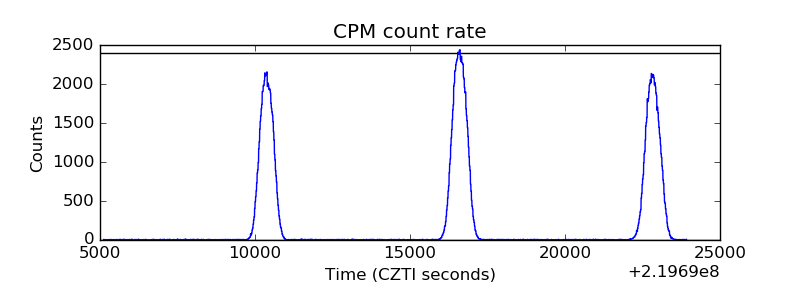 |
| CZT Counter | 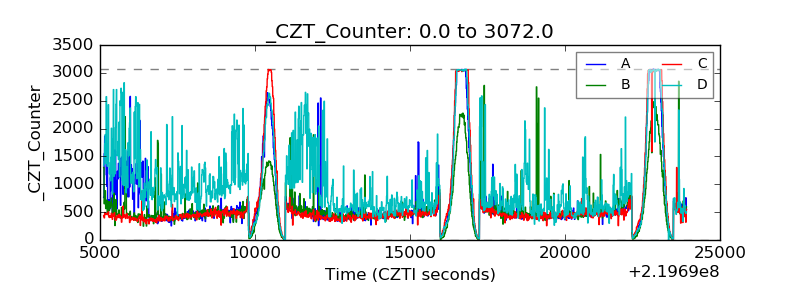 |
| +2.5 Volts monitor | 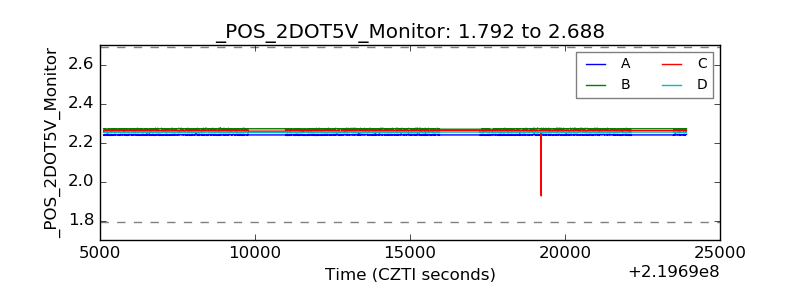 |
| +5 Volts monitor |  |
| _ROLL_ROT | 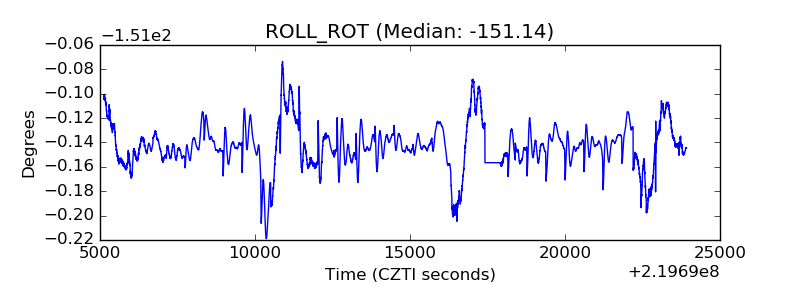 |
| _Roll_DEC | 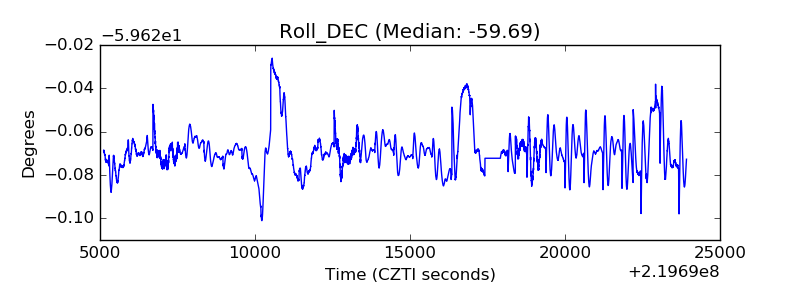 |
| _Roll_RA | 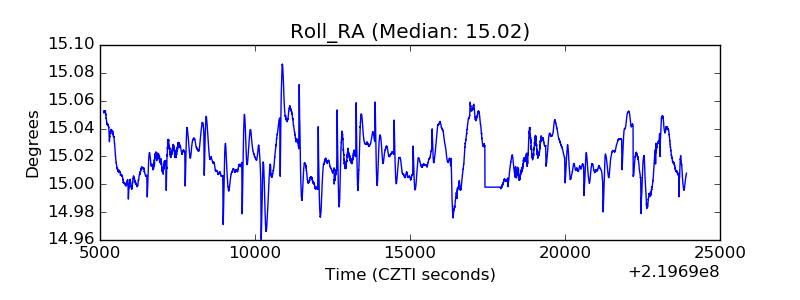 |
| Veto Counter | 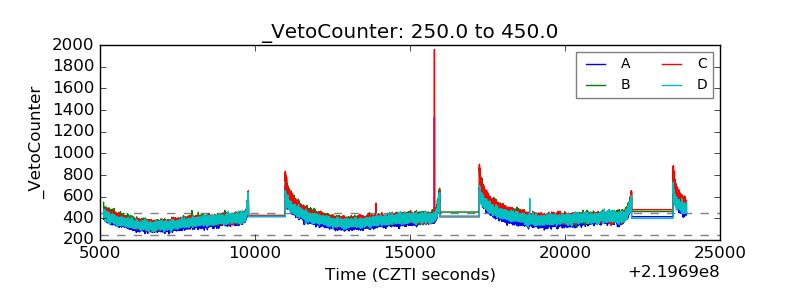 |