| Param | Original file | Final file |
|---|---|---|
| Filename | modeM0/AS1A02_082T01_9000000898cztM0_level2.fits | modeM0/AS1A02_082T01_9000000898cztM0_level2_quad_clean.evt |
| Size (bytes) | 622,638,720 | 555,814,080 |
| Size | 593.8 MB | 530.1 MB |
| Events in quadrant A | 3,748,178 | 3,220,097 |
| Events in quadrant B | 3,640,922 | 3,178,986 |
| Events in quadrant C | 3,716,950 | 3,022,781 |
| Events in quadrant D | 3,126,522 | 2,787,592 |
| Mode M9 | |||
|---|---|---|---|
| Quadrant | BADHDUFLAG | Total packets | Discarded packets |
| A | 0 | 100 | 0 |
| B | 0 | 100 | 0 |
| C | 0 | 100 | 0 |
| D | 0 | 100 | 0 |
| Mode M0 | |||
|---|---|---|---|
| Quadrant | BADHDUFLAG | Total packets | Discarded packets |
| A | 0 | 140220 | 0 |
| B | 0 | 144072 | 0 |
| C | 0 | 138644 | 0 |
| D | 0 | 191866 | 0 |
| Mode SS | |||
|---|---|---|---|
| Quadrant | BADHDUFLAG | Total packets | Discarded packets |
| A | 0 | 1372 | 0 |
| B | 0 | 1372 | 0 |
| C | 0 | 1372 | 0 |
| D | 0 | 1372 | 0 |
| Quadrant | Total seconds | Saturated seconds | Saturation percentage |
|---|---|---|---|
| A | 67399 | 1131 | 1.678066% |
| B | 67399 | 1381 | 2.048992% |
| C | 67399 | 859 | 1.274500% |
| D | 67399 | 2838 | 4.210745% |
Noise dominated data is calculated using 1-second bins in cleaned event files. If a bin has >2000 counts, and if more than 50% of those come from <1% of pixels, then it is considered to be noise-dominated and hence unusable.
| Quadrant | # 1 sec bins | Bins with >0 counts | Bins with >2000 counts | High rate bins dominated by noise | Noise dominated (total time) | Noise dominated (detector-on time) | Marked lightcurve |
|---|---|---|---|---|---|---|---|
| A | 77499 | 67399 | 0 | 0 | 0.00% | 0.00% |  |
| B | 77499 | 67399 | 0 | 0 | 0.00% | 0.00% | 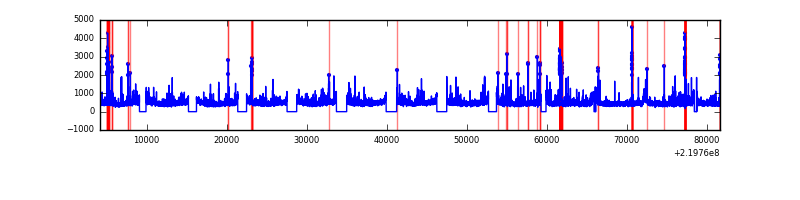 |
| C | 77499 | 67400 | 0 | 0 | 0.00% | 0.00% | 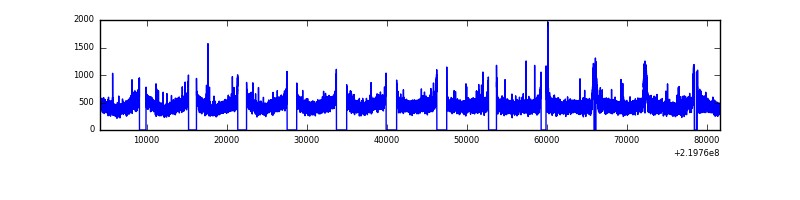 |
| D | 77499 | 67382 | 0 | 0 | 0.00% | 0.00% |  |
Top three noisy pixels from each quadrant. If the there are fewer than three noisy pixels in the level2.evt file, extra rows are filled as -1
| Pixel properties | Quadrant properties | ||||||
|---|---|---|---|---|---|---|---|
| Quadrant | DetID | PixID | Counts | Sigma | Mean | Median | Sigma |
| A | 0 | 29 | 3575 | 10.76 | 971 | 903 | 248.2 |
| A | 7 | 110 | 3182 | 9.18 | 971 | 903 | 248.2 |
| A | 0 | 30 | 2828 | 7.75 | 971 | 903 | 248.2 |
| B | 2 | 9 | 3082 | 10.88 | 958 | 904 | 200.2 |
| B | 12 | 226 | 2493 | 7.94 | 958 | 904 | 200.2 |
| B | 5 | 128 | 2456 | 7.75 | 958 | 904 | 200.2 |
| C | 12 | 241 | 2683 | 6.75 | 981 | 906 | 263.4 |
| C | 1 | 81 | 2680 | 6.73 | 981 | 906 | 263.4 |
| C | 1 | 80 | 2678 | 6.73 | 981 | 906 | 263.4 |
| D | 3 | 14 | 2393 | 6.57 | 891 | 807 | 241.4 |
| D | 11 | 82 | 2311 | 6.23 | 891 | 807 | 241.4 |
| D | 6 | 231 | 2270 | 6.06 | 891 | 807 | 241.4 |
Histogram calculated using DETX and DETY for each event in the final _common_clean file
| Quadrant A | 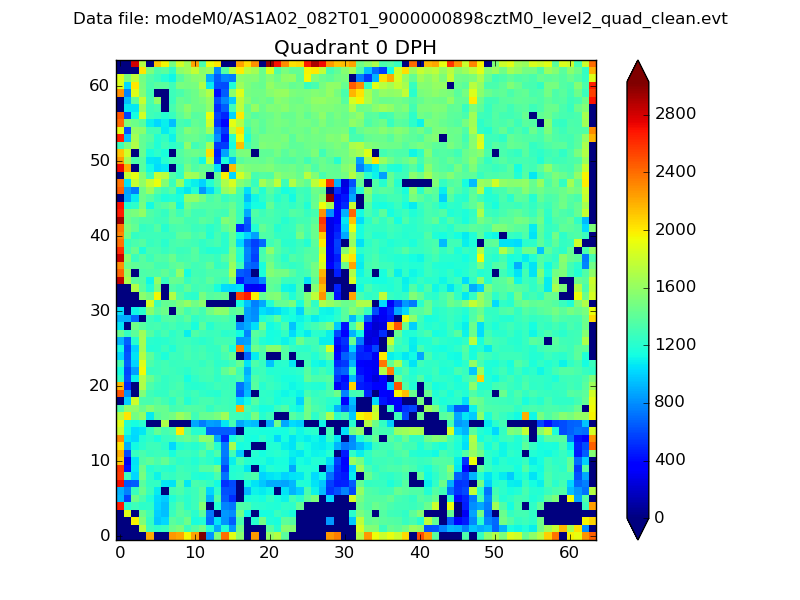 |
 |
Quadrant B |
|---|---|---|---|
| Quadrant D |  |
 |
Quadrant C |
| Plot type | Count rate plots | Images |
|---|---|---|
| Comparison with Poisson distribution Blue bars denote a histogram of data divided into 1 sec bins. Red curve is a Poisson curve with rate = median count rate of data. |
 |
 |
| Quadrant-wise count rates Data is divided into 100 sec bins |
 |
|
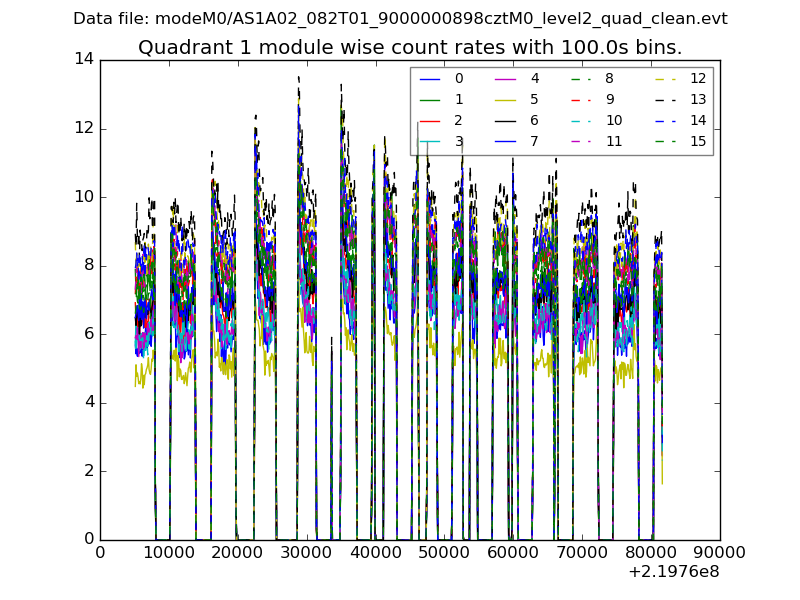
| Module-wise count rates for Quadrant A Data is divided into 100 sec bins |
 |
 |
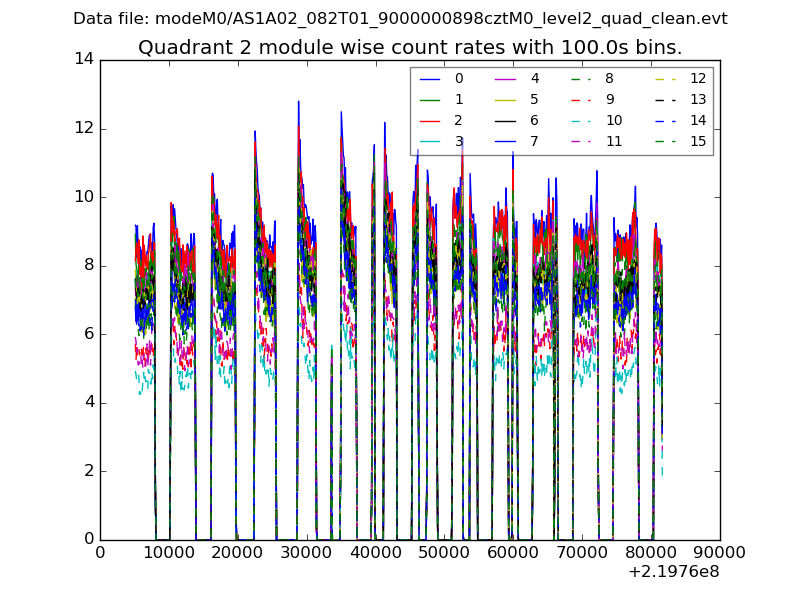
| Module-wise count rates for Quadrant B Data is divided into 100 sec bins |
 |
 |
| Module-wise count rates for Quadrant C Data is divided into 100 sec bins |
 |
 |
| Module-wise count rates for Quadrant D Data is divided into 100 sec bins |
 |
 |
| Parameter | Plot |
|---|---|
| CZT HV Monitor |  |
| D_VDD |  |
| Temperature 1 |  |
| Veto HV Monitor |  |
| Veto LLD | 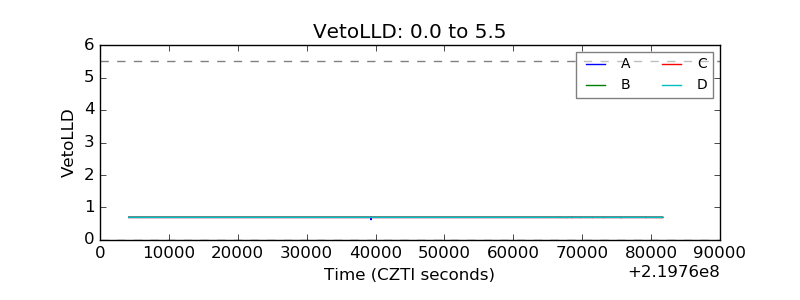 |
| Alpha Counter | 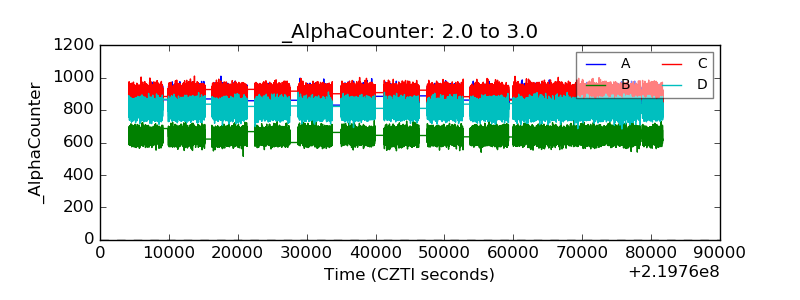 |
| _CPM_Rate |  |
| CZT Counter |  |
| +2.5 Volts monitor | 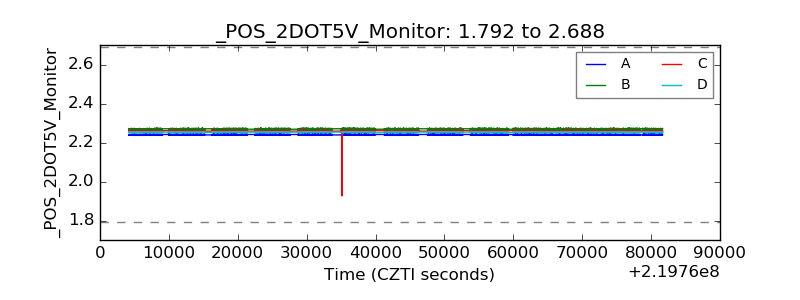 |
| +5 Volts monitor |  |
| _ROLL_ROT |  |
| _Roll_DEC |  |
| _Roll_RA | 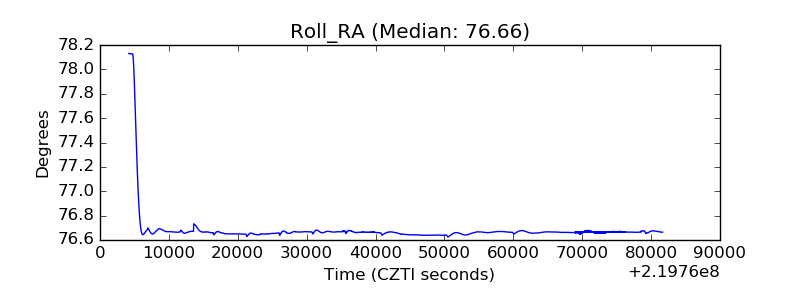 |
| Veto Counter | 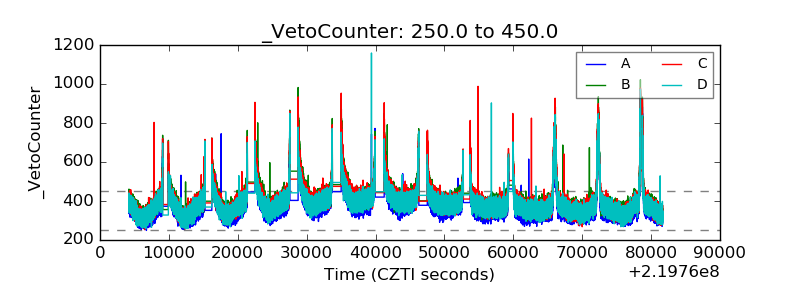 |