| Param | Original file | Final file |
|---|---|---|
| Filename | modeM0/AS1A02_082T01_9000000898_06624cztM0_level2.evt | modeM0/AS1A02_082T01_9000000898_06624cztM0_level2_quad_clean.evt |
| Size (bytes) | 499,824,000 | 93,061,440 |
| Size | 476.7 MB | 88.8 MB |
| Events in quadrant A | 3,322,680 | 594,312 |
| Events in quadrant B | 3,393,976 | 592,770 |
| Events in quadrant C | 3,149,616 | 581,804 |
| Events in quadrant D | 4,797,167 | 563,254 |
| Mode M9 | |||
|---|---|---|---|
| Quadrant | BADHDUFLAG | Total packets | Discarded packets |
| A | 0 | 18 | 0 |
| B | 0 | 18 | 0 |
| C | 0 | 18 | 0 |
| D | 0 | 18 | 0 |
| Mode M0 | |||
|---|---|---|---|
| Quadrant | BADHDUFLAG | Total packets | Discarded packets |
| A | 0 | 14546 | 3 |
| B | 0 | 14665 | 2 |
| C | 0 | 14255 | 2 |
| D | 0 | 19028 | 2 |
| Mode SS | |||
|---|---|---|---|
| Quadrant | BADHDUFLAG | Total packets | Discarded packets |
| A | 0 | 144 | 0 |
| B | 0 | 144 | 0 |
| C | 0 | 144 | 0 |
| D | 0 | 144 | 0 |
| Quadrant | Total seconds | Saturated seconds | Saturation percentage |
|---|---|---|---|
| A | 6978 | 74 | 1.060476% |
| B | 6978 | 80 | 1.146460% |
| C | 6978 | 46 | 0.659215% |
| D | 6978 | 211 | 3.023789% |
Noise dominated data is calculated using 1-second bins in cleaned event files. If a bin has >2000 counts, and if more than 50% of those come from <1% of pixels, then it is considered to be noise-dominated and hence unusable.
| Quadrant | # 1 sec bins | Bins with >0 counts | Bins with >2000 counts | High rate bins dominated by noise | Noise dominated (total time) | Noise dominated (detector-on time) | Marked lightcurve |
|---|---|---|---|---|---|---|---|
| A | 8803 | 6980 | 1 | 1 | 0.01% | 0.01% | 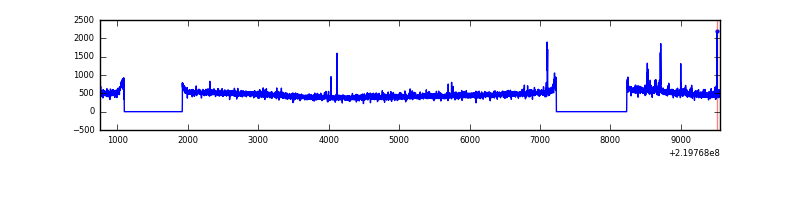 |
| B | 8803 | 6980 | 0 | 0 | 0.00% | 0.00% | 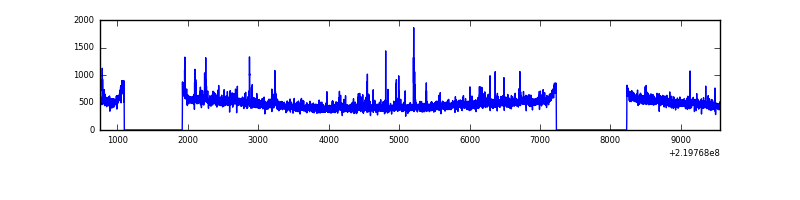 |
| C | 8803 | 6980 | 0 | 0 | 0.00% | 0.00% | 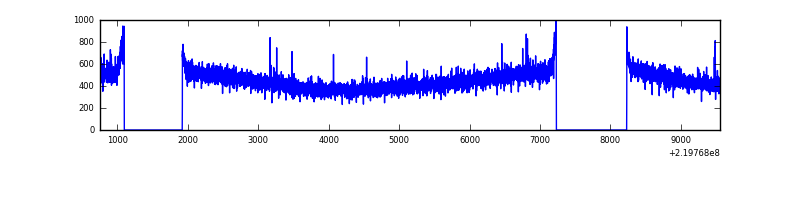 |
| D | 8803 | 6980 | 102 | 102 | 1.16% | 1.46% | 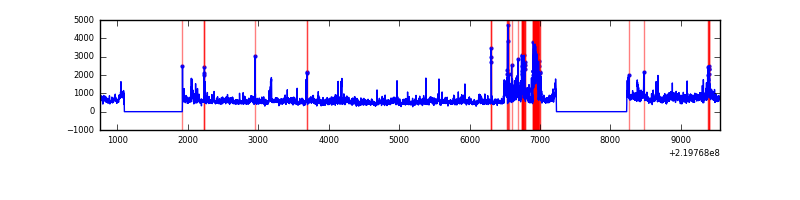 |
Top three noisy pixels from each quadrant. If the there are fewer than three noisy pixels in the level2.evt file, extra rows are filled as -1
| Pixel properties | Quadrant properties | ||||||
|---|---|---|---|---|---|---|---|
| Quadrant | DetID | PixID | Counts | Sigma | Mean | Median | Sigma |
| A | 8 | 15 | 92359 | 535.28 | 834 | 814 | 171.0 |
| A | 14 | 111 | 15667 | 86.85 | 834 | 814 | 171.0 |
| A | 0 | 226 | 7857 | 41.18 | 834 | 814 | 171.0 |
| B | 0 | 219 | 78950 | 479.64 | 838 | 817 | 162.9 |
| B | 4 | 48 | 41475 | 249.59 | 838 | 817 | 162.9 |
| B | 4 | 81 | 19356 | 113.81 | 838 | 817 | 162.9 |
| C | 12 | 4 | 9946 | 48.35 | 805 | 807 | 189.0 |
| C | 13 | 61 | 6223 | 28.65 | 805 | 807 | 189.0 |
| C | 3 | 202 | 2040 | 6.52 | 805 | 807 | 189.0 |
| D | 8 | 195 | 1094615 | 5633.64 | 797 | 773 | 194.2 |
| D | 2 | 33 | 467426 | 2403.41 | 797 | 773 | 194.2 |
| D | 13 | 172 | 72704 | 370.47 | 797 | 773 | 194.2 |
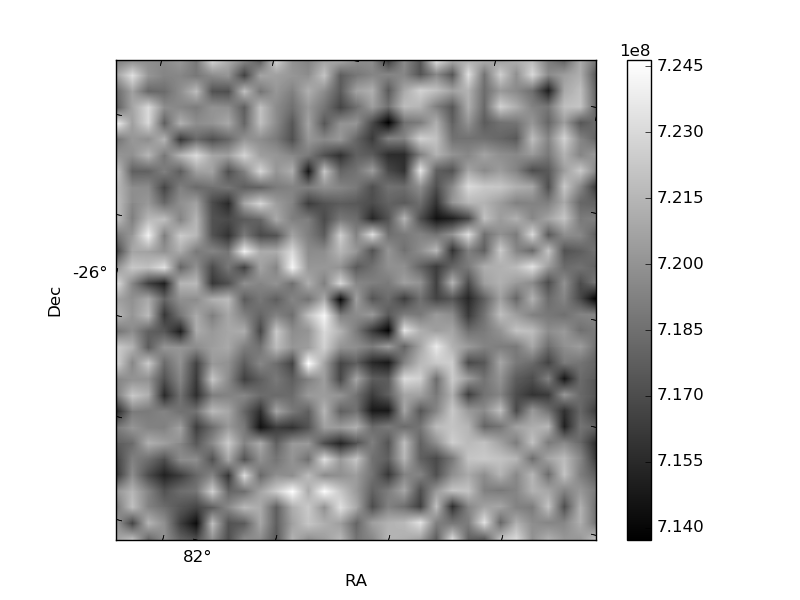
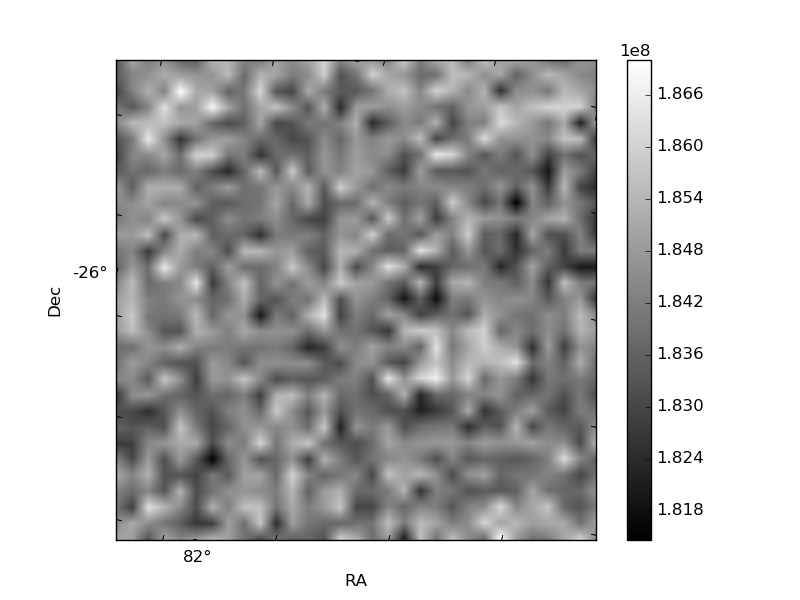
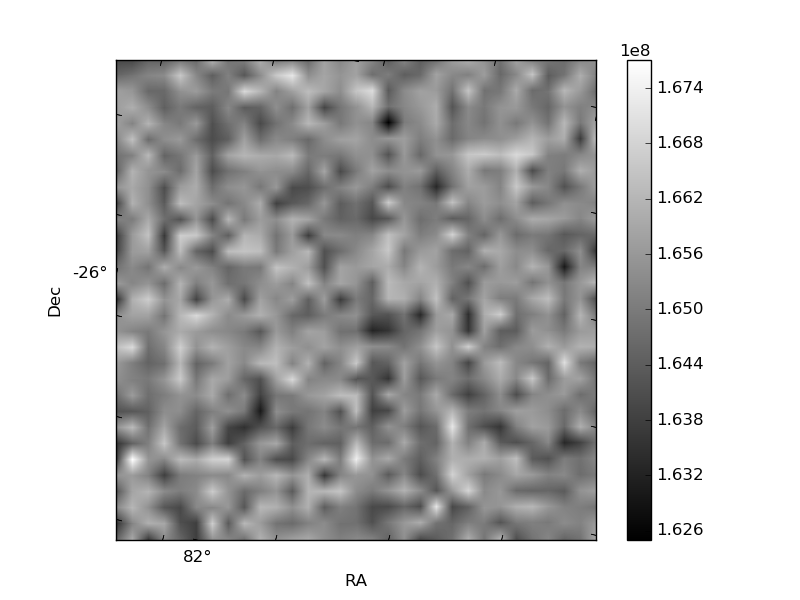
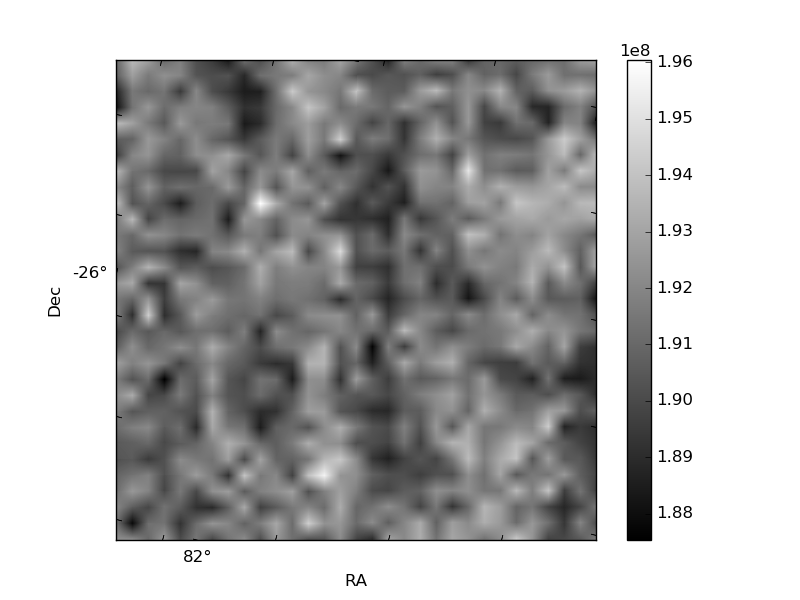
Histogram calculated using DETX and DETY for each event in the final _common_clean file
| Quadrant A | 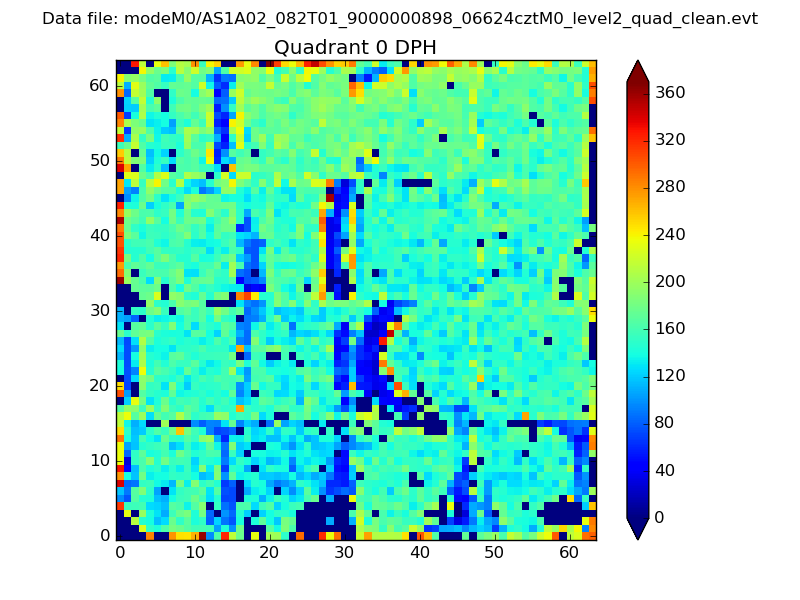 |
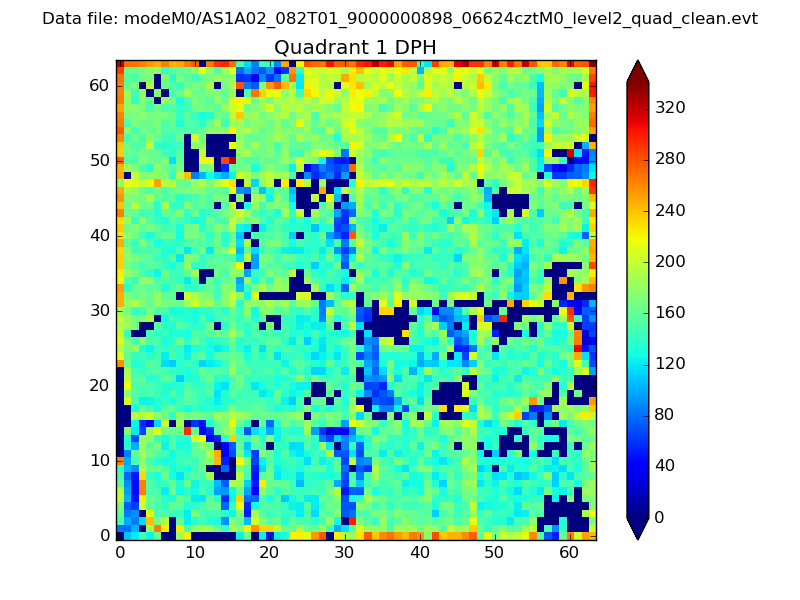 |
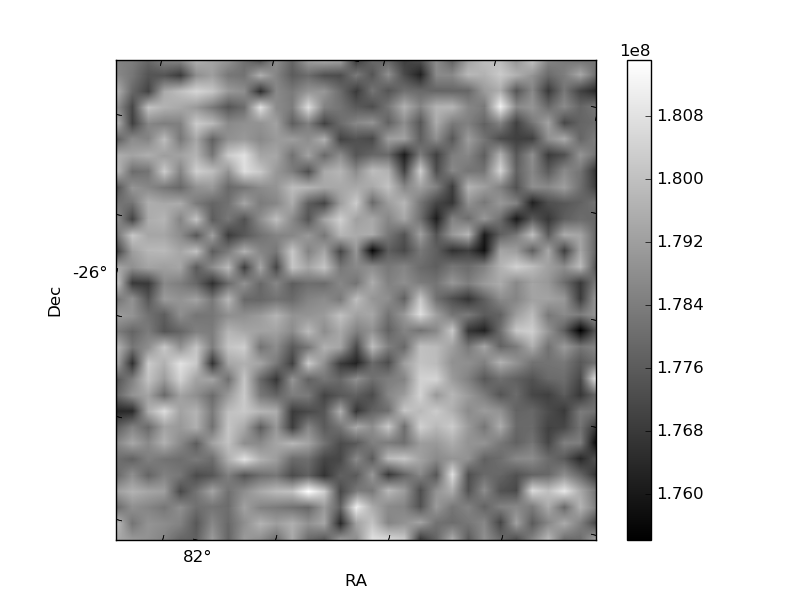
Quadrant B |
|---|---|---|---|
| Quadrant D | 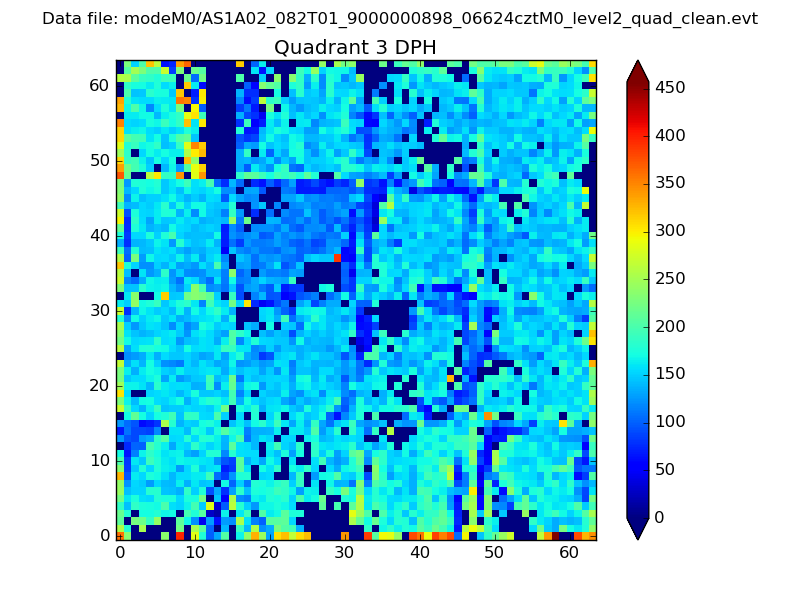 |
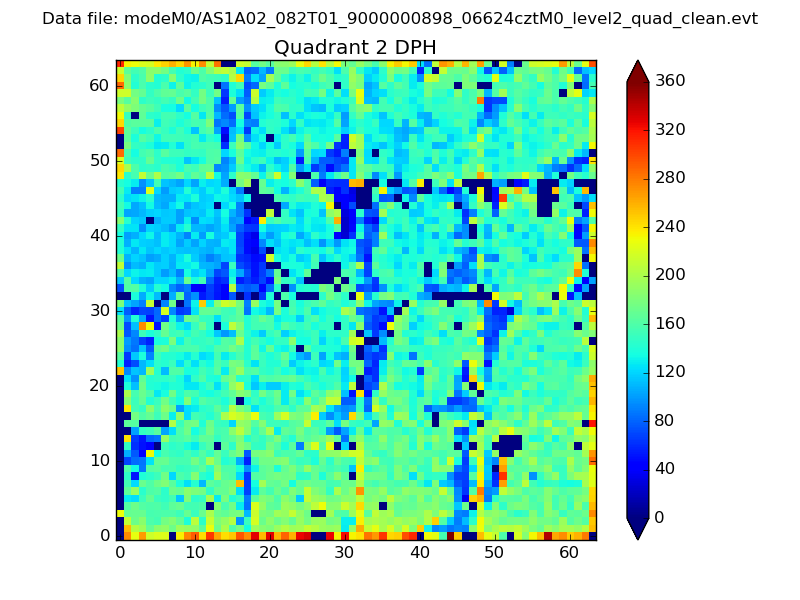 |
Quadrant C |
| Plot type | Count rate plots | Images |
|---|---|---|
| Comparison with Poisson distribution Blue bars denote a histogram of data divided into 1 sec bins. Red curve is a Poisson curve with rate = median count rate of data. |
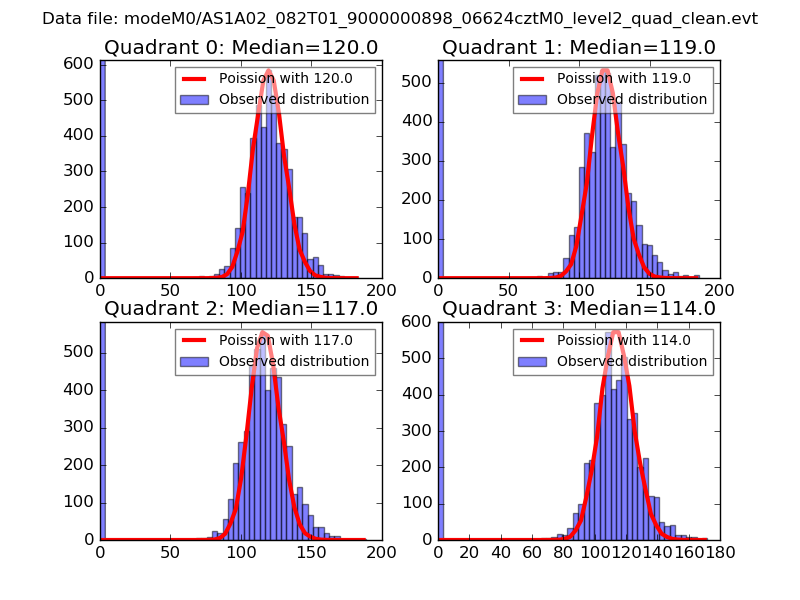 |
 |
| Quadrant-wise count rates Data is divided into 100 sec bins |
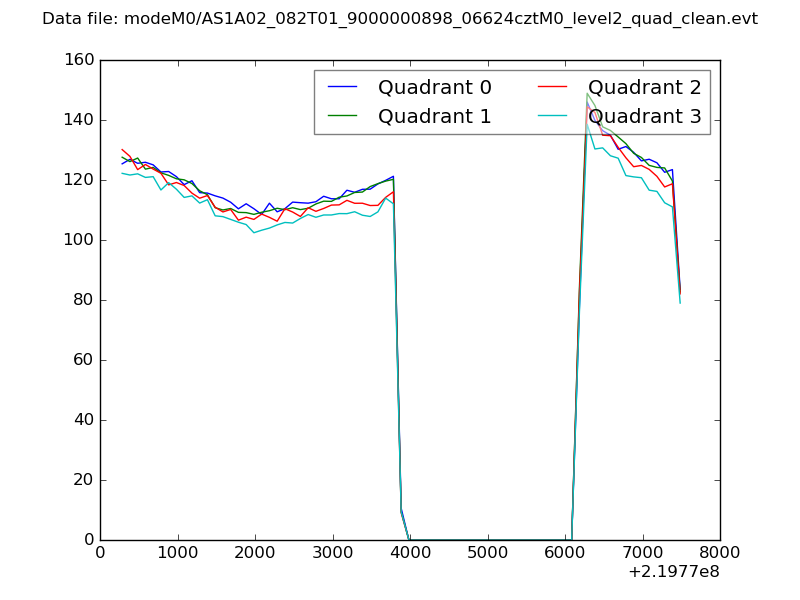 |
|
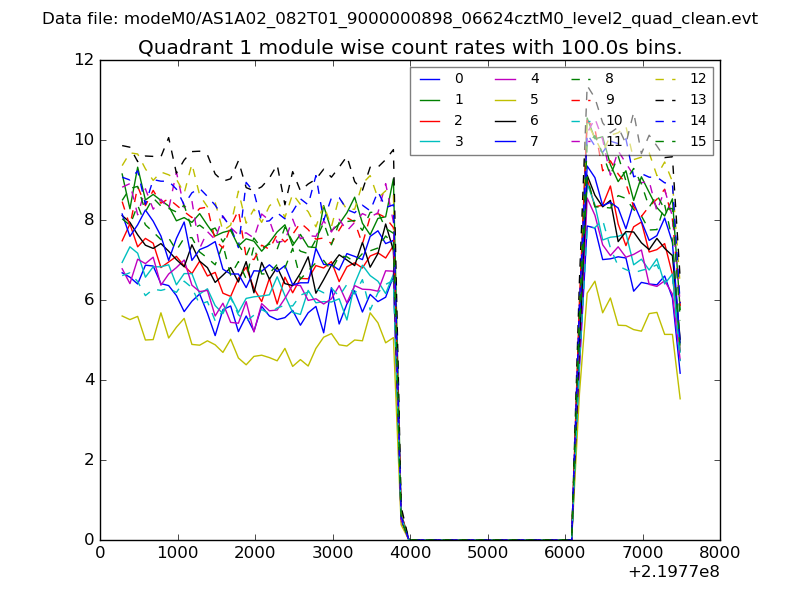
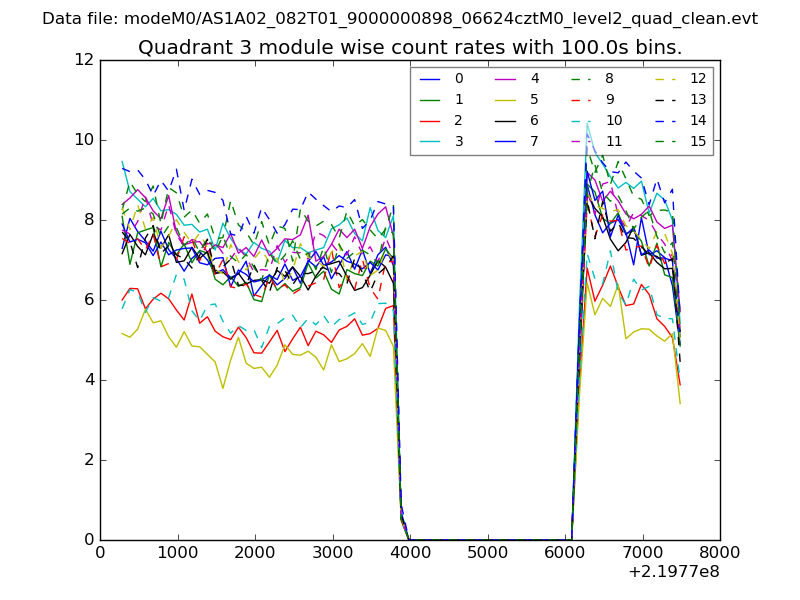
| Module-wise count rates for Quadrant A Data is divided into 100 sec bins |
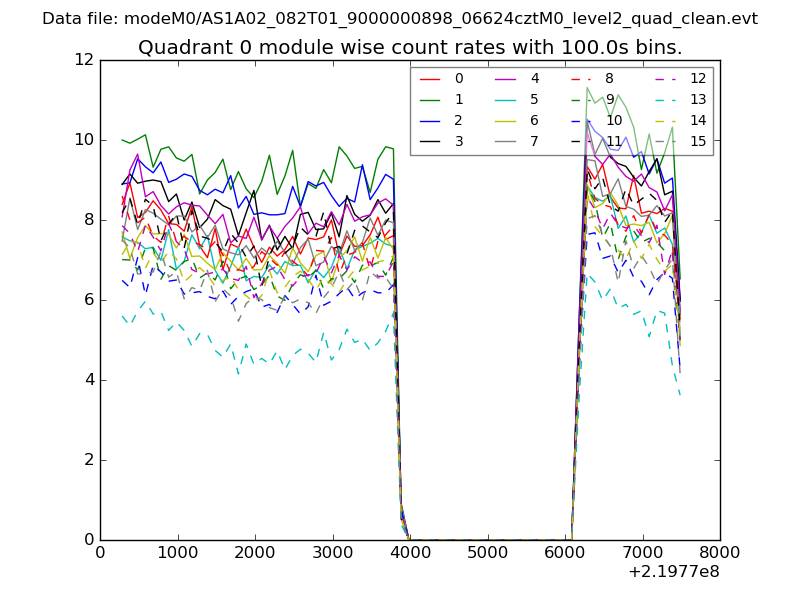 |
 |
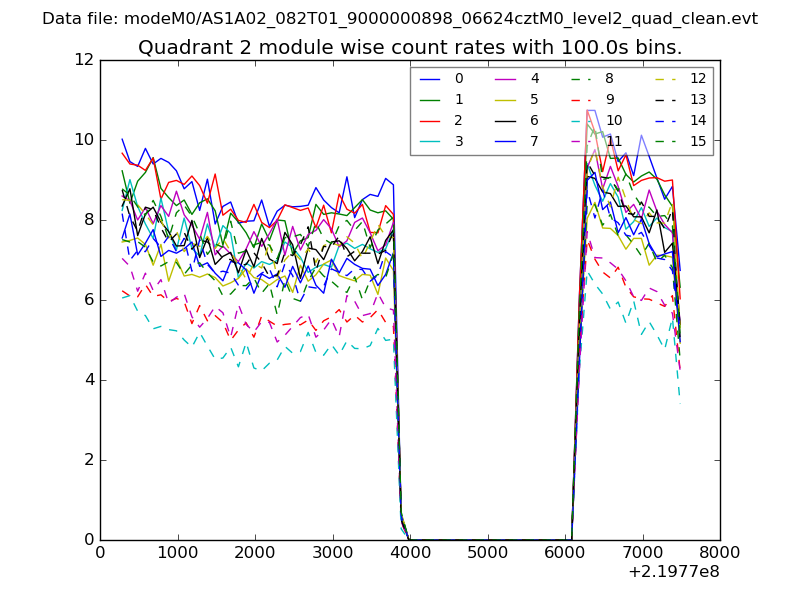
| Module-wise count rates for Quadrant B Data is divided into 100 sec bins |
 |
 |
| Module-wise count rates for Quadrant C Data is divided into 100 sec bins |
 |
 |
| Module-wise count rates for Quadrant D Data is divided into 100 sec bins |
 |
 |
| Parameter | Plot |
|---|---|
| CZT HV Monitor | 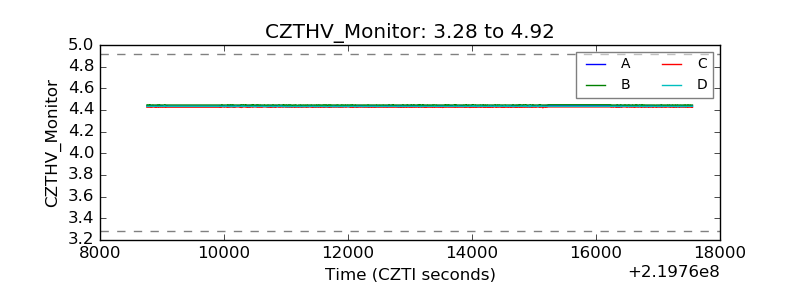 |
| D_VDD | 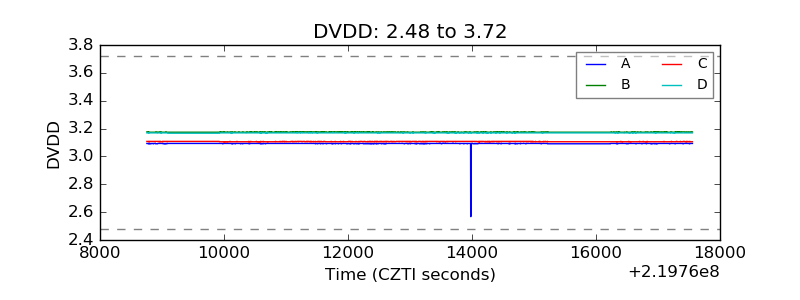 |
| Temperature 1 | 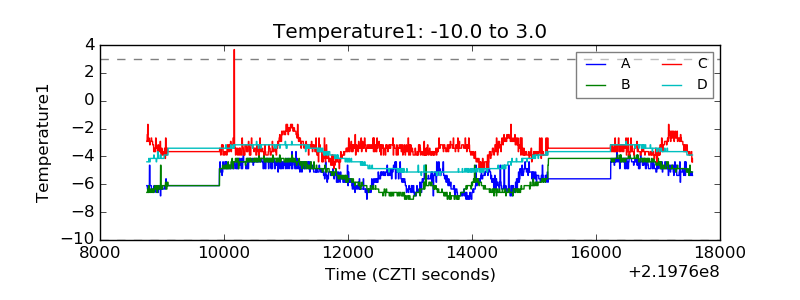 |
| Veto HV Monitor | 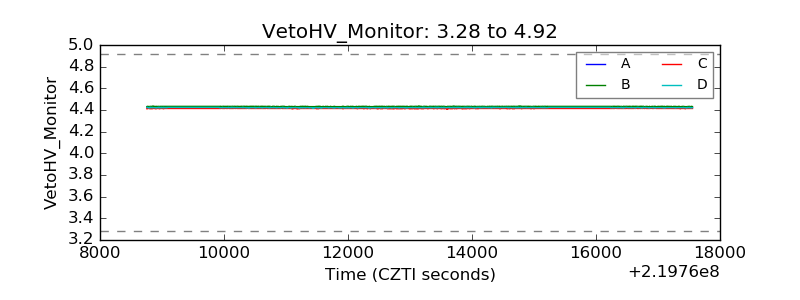 |
| Veto LLD | 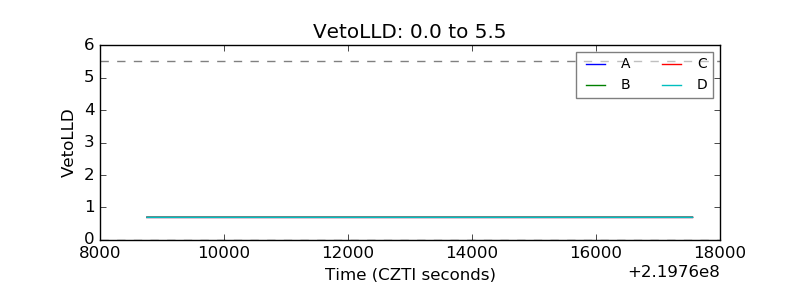 |
| Alpha Counter | 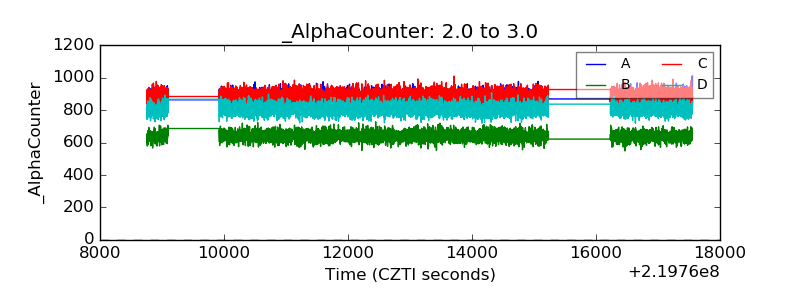 |
| _CPM_Rate | 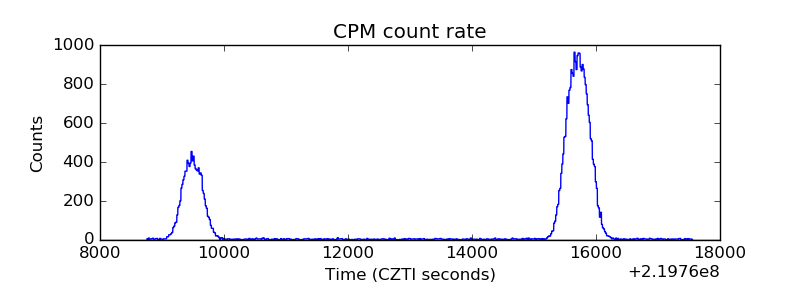 |
| CZT Counter | 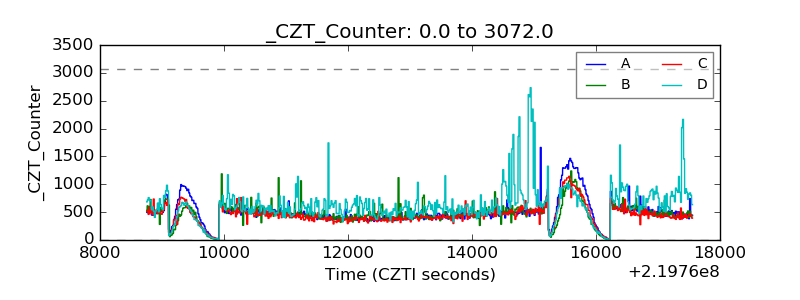 |
| +2.5 Volts monitor | 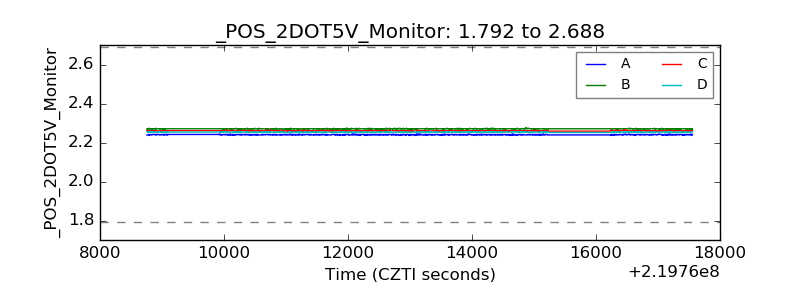 |
| +5 Volts monitor | 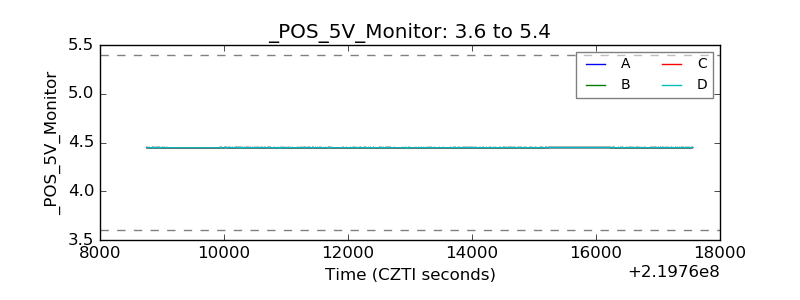 |
| _ROLL_ROT | 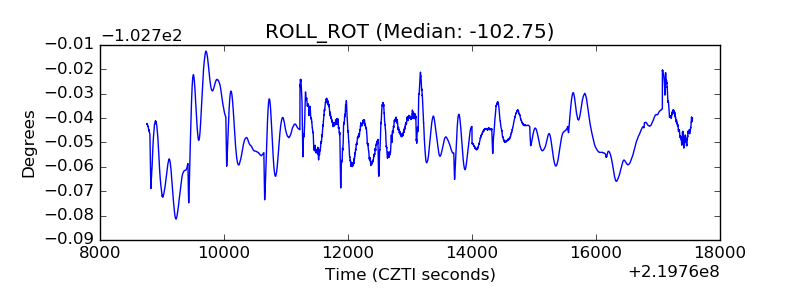 |
| _Roll_DEC | 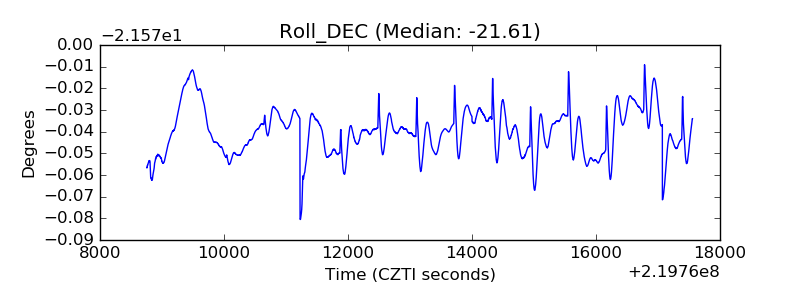 |
| _Roll_RA | 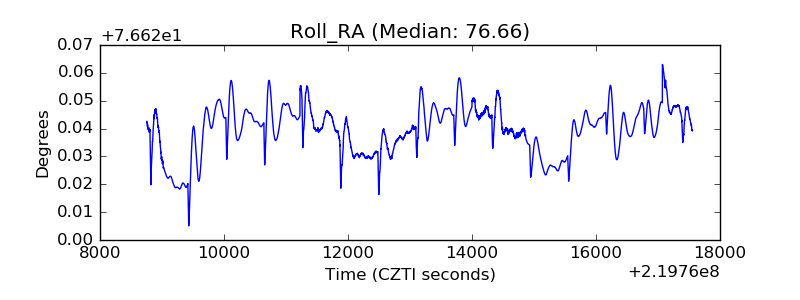 |
| Veto Counter | 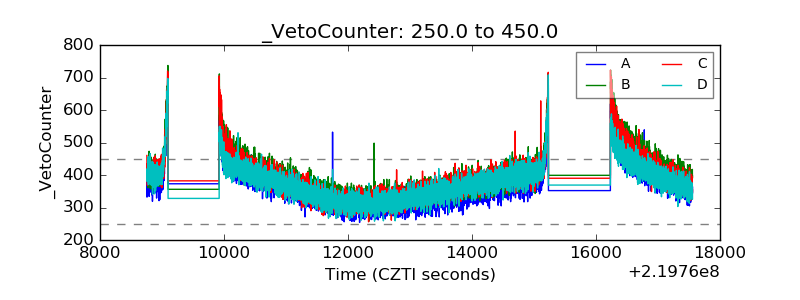 |