| Param | Original file | Final file |
|---|---|---|
| Filename | modeM0/AS1A02_082T01_9000000898_06626cztM0_level2.evt | modeM0/AS1A02_082T01_9000000898_06626cztM0_level2_quad_clean.evt |
| Size (bytes) | 1,199,010,240 | 230,446,080 |
| Size | 1.1 GB | 219.8 MB |
| Events in quadrant A | 7,982,529 | 1,485,622 |
| Events in quadrant B | 8,251,667 | 1,475,397 |
| Events in quadrant C | 7,477,633 | 1,446,287 |
| Events in quadrant D | 11,448,578 | 1,397,995 |
| Mode M9 | |||
|---|---|---|---|
| Quadrant | BADHDUFLAG | Total packets | Discarded packets |
| A | 0 | 29 | 0 |
| B | 0 | 29 | 0 |
| C | 0 | 29 | 0 |
| D | 0 | 29 | 0 |
| Mode M0 | |||
|---|---|---|---|
| Quadrant | BADHDUFLAG | Total packets | Discarded packets |
| A | 0 | 35396 | 4 |
| B | 0 | 35998 | 3 |
| C | 0 | 34570 | 3 |
| D | 0 | 45822 | 3 |
| Mode SS | |||
|---|---|---|---|
| Quadrant | BADHDUFLAG | Total packets | Discarded packets |
| A | 0 | 348 | 0 |
| B | 0 | 348 | 0 |
| C | 0 | 348 | 0 |
| D | 0 | 348 | 0 |
| Quadrant | Total seconds | Saturated seconds | Saturation percentage |
|---|---|---|---|
| A | 17035 | 111 | 0.651600% |
| B | 17035 | 159 | 0.933372% |
| C | 17035 | 55 | 0.322865% |
| D | 17035 | 331 | 1.943058% |
Noise dominated data is calculated using 1-second bins in cleaned event files. If a bin has >2000 counts, and if more than 50% of those come from <1% of pixels, then it is considered to be noise-dominated and hence unusable.
| Quadrant | # 1 sec bins | Bins with >0 counts | Bins with >2000 counts | High rate bins dominated by noise | Noise dominated (total time) | Noise dominated (detector-on time) | Marked lightcurve |
|---|---|---|---|---|---|---|---|
| A | 19970 | 17038 | 7 | 7 | 0.04% | 0.04% |  |
| B | 19970 | 17038 | 33 | 33 | 0.17% | 0.19% |  |
| C | 19970 | 17038 | 0 | 0 | 0.00% | 0.00% | 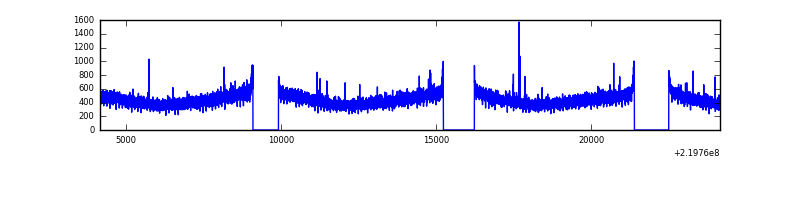 |
| D | 19970 | 17038 | 164 | 164 | 0.82% | 0.96% |  |
Top three noisy pixels from each quadrant. If the there are fewer than three noisy pixels in the level2.evt file, extra rows are filled as -1
| Pixel properties | Quadrant properties | ||||||
|---|---|---|---|---|---|---|---|
| Quadrant | DetID | PixID | Counts | Sigma | Mean | Median | Sigma |
| A | 8 | 15 | 286798 | 712.44 | 1980 | 1935 | 399.8 |
| A | 13 | 248 | 50015 | 120.25 | 1980 | 1935 | 399.8 |
| A | 14 | 111 | 22500 | 51.43 | 1980 | 1935 | 399.8 |
| B | 0 | 219 | 323430 | 842.46 | 1992 | 1945 | 381.6 |
| B | 4 | 81 | 62436 | 158.52 | 1992 | 1945 | 381.6 |
| B | 4 | 48 | 61674 | 156.52 | 1992 | 1945 | 381.6 |
| C | 12 | 4 | 18322 | 36.96 | 1910 | 1917 | 443.9 |
| C | 13 | 61 | 15000 | 29.48 | 1910 | 1917 | 443.9 |
| C | 1 | 16 | 8489 | 14.81 | 1910 | 1917 | 443.9 |
| D | 8 | 195 | 2908277 | 6324.56 | 1893 | 1836 | 459.5 |
| D | 2 | 33 | 712930 | 1547.37 | 1893 | 1836 | 459.5 |
| D | 1 | 239 | 147851 | 317.74 | 1893 | 1836 | 459.5 |
Histogram calculated using DETX and DETY for each event in the final _common_clean file
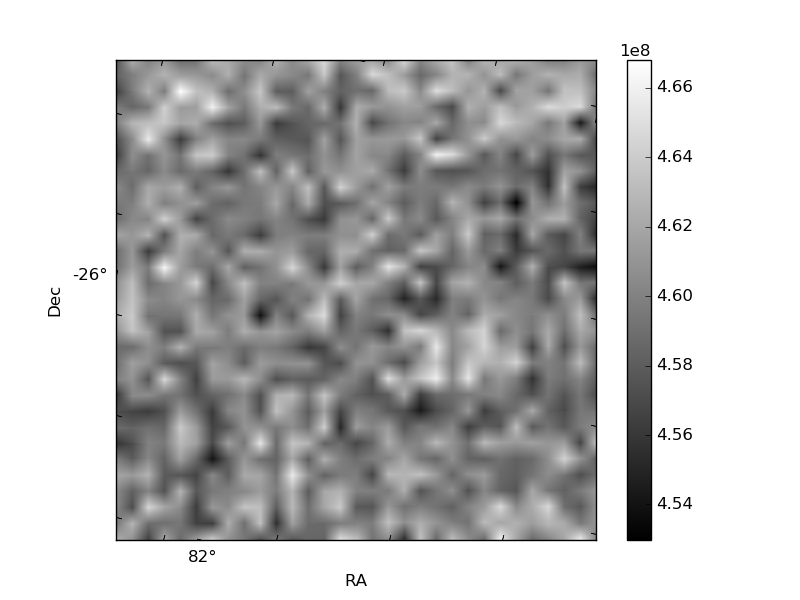
| Quadrant A | 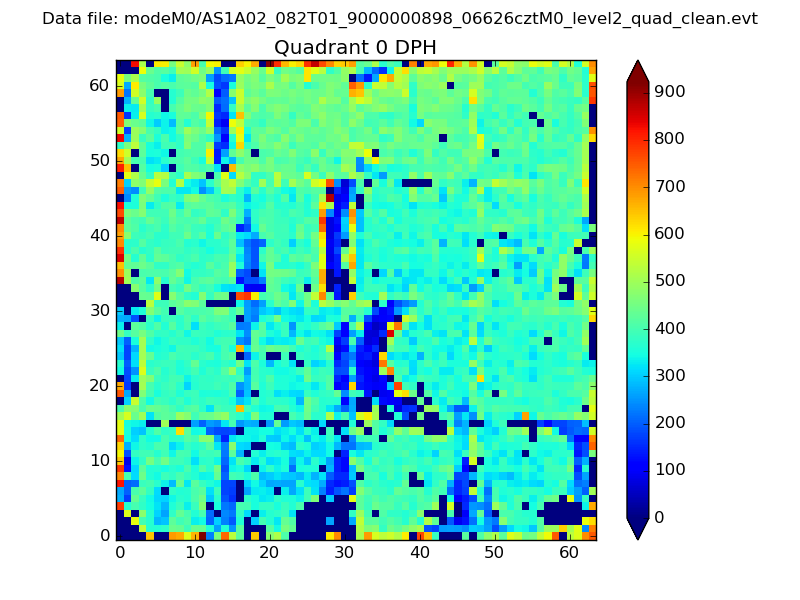 |
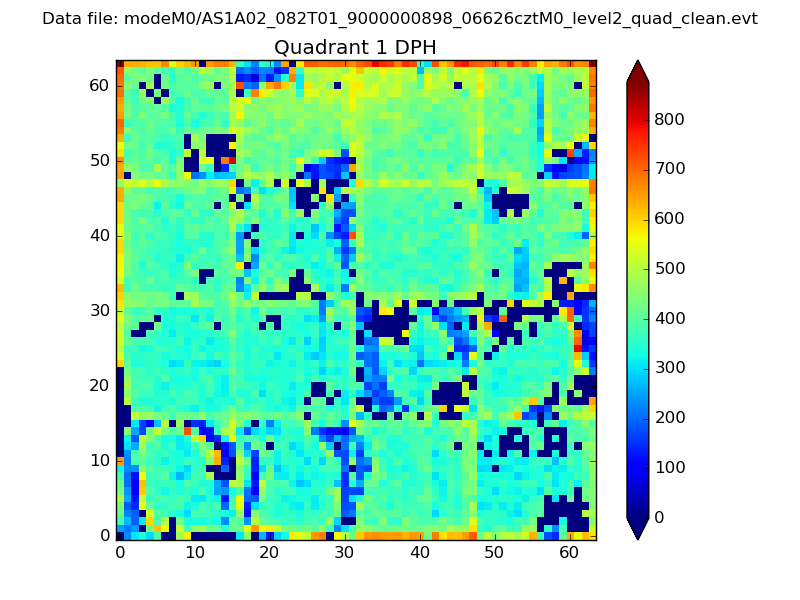 |
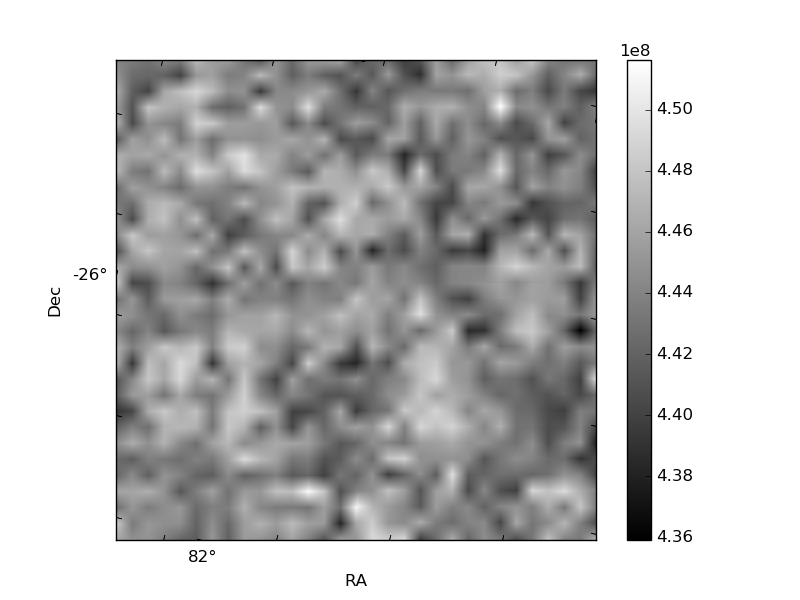
Quadrant B |
|---|---|---|---|
| Quadrant D | 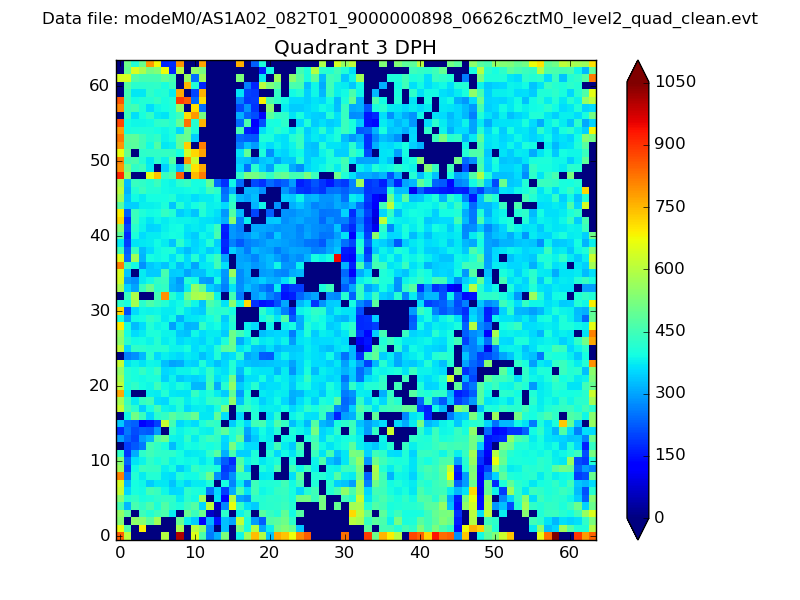 |
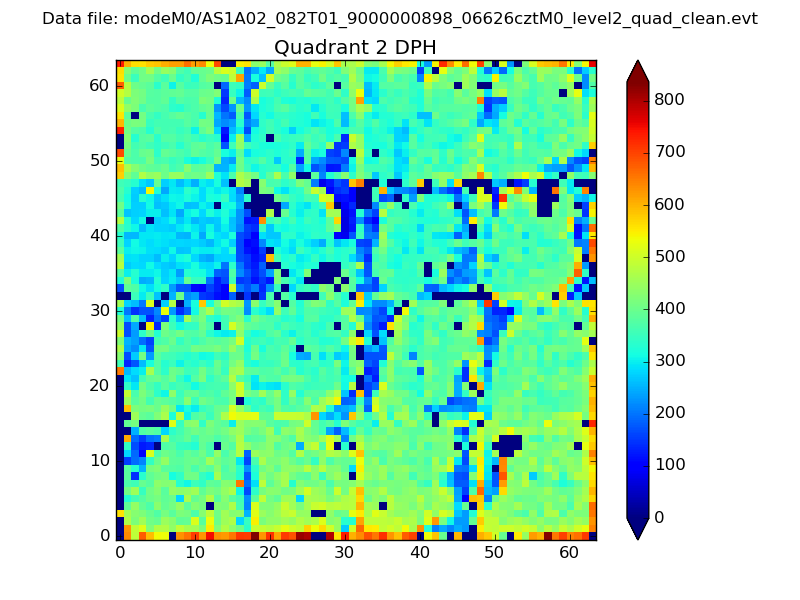 |
Quadrant C |
| Plot type | Count rate plots | Images |
|---|---|---|
| Comparison with Poisson distribution Blue bars denote a histogram of data divided into 1 sec bins. Red curve is a Poisson curve with rate = median count rate of data. |
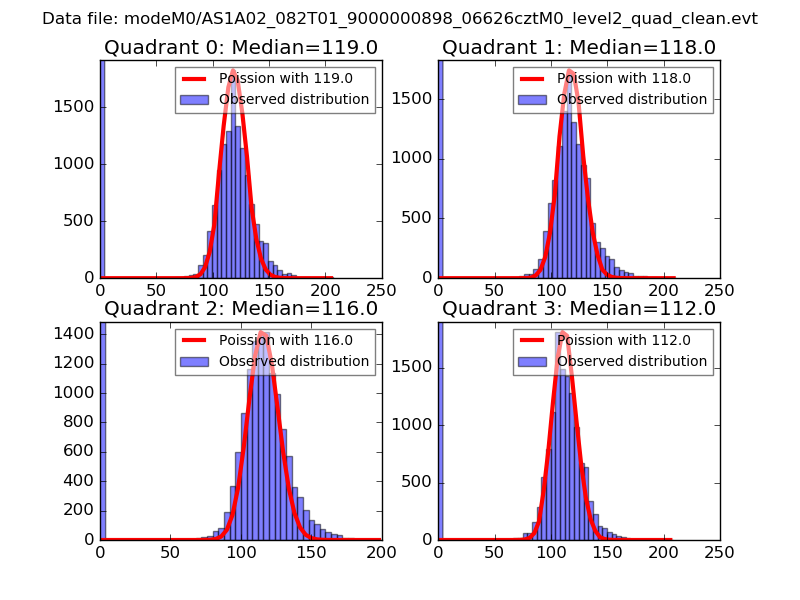 |
 |
| Quadrant-wise count rates Data is divided into 100 sec bins |
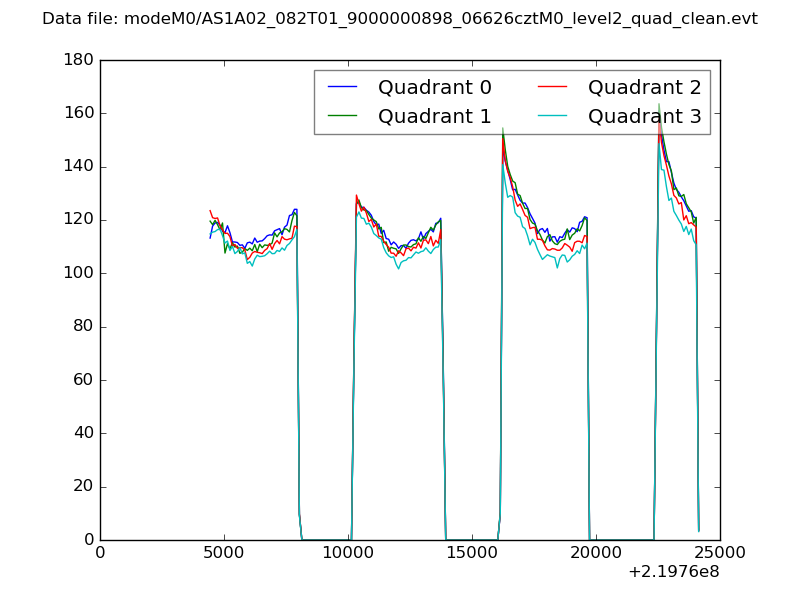 |
|
| Module-wise count rates for Quadrant A Data is divided into 100 sec bins |
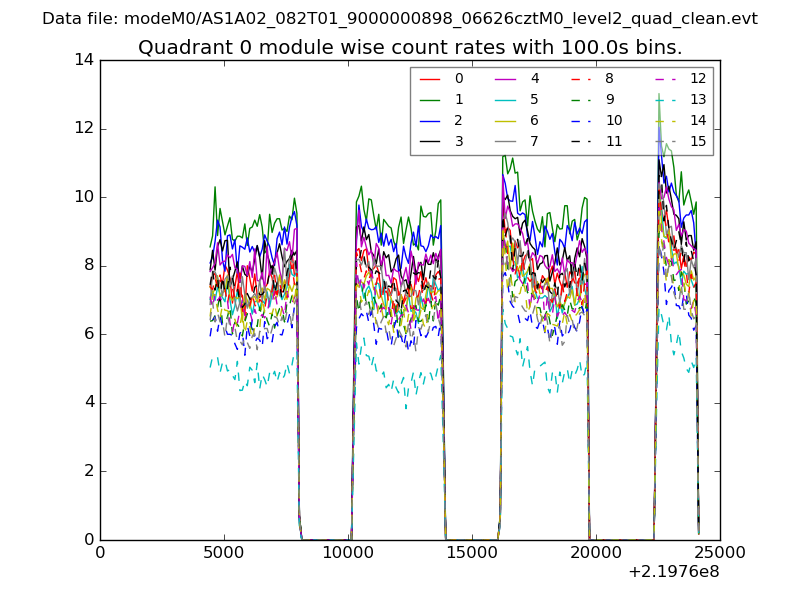 |
 |
| Module-wise count rates for Quadrant B Data is divided into 100 sec bins |
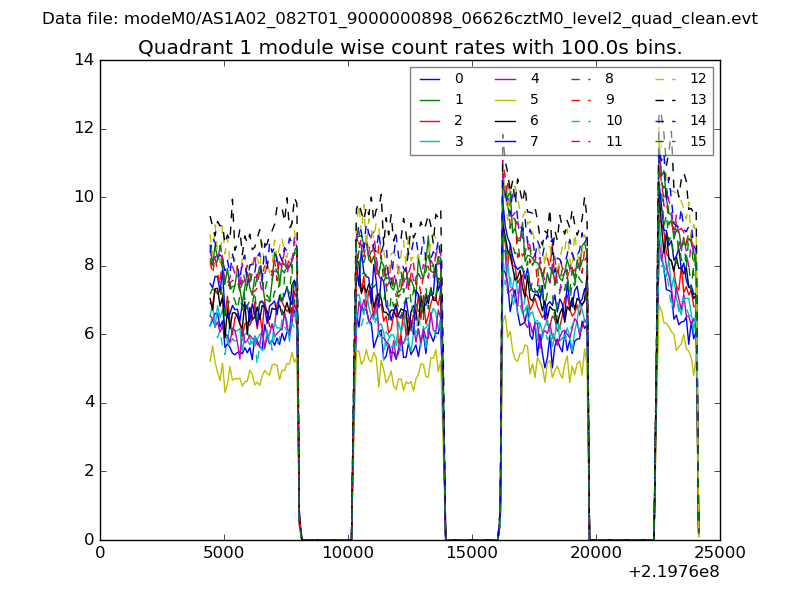 |
 |
| Module-wise count rates for Quadrant C Data is divided into 100 sec bins |
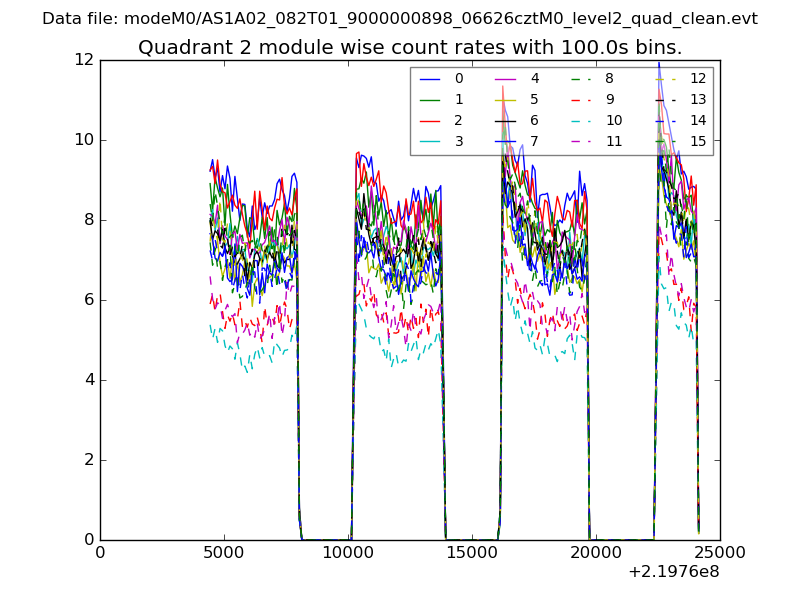 |
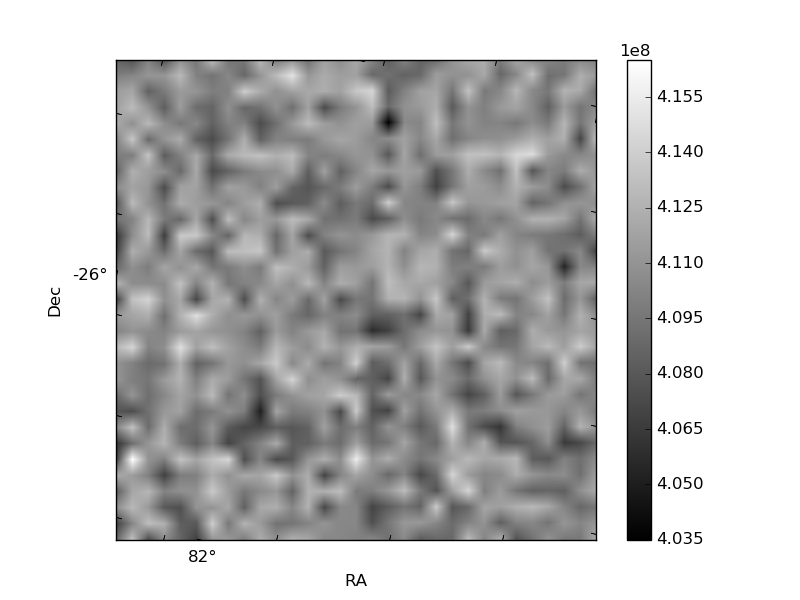 |
| Module-wise count rates for Quadrant D Data is divided into 100 sec bins |
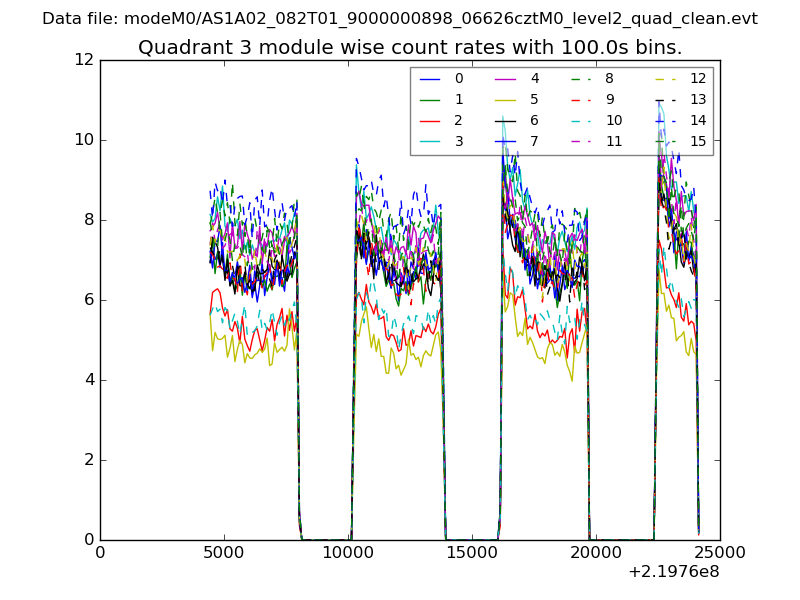 |
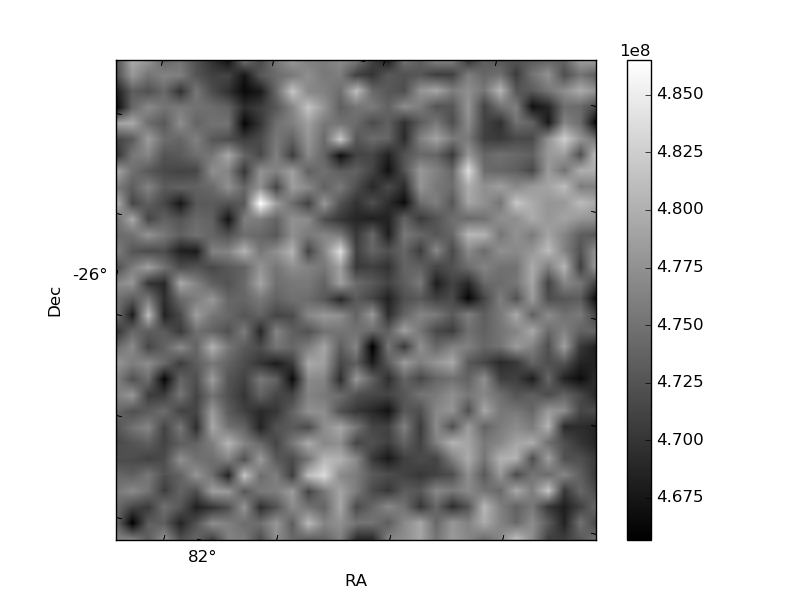 |
| Parameter | Plot |
|---|---|
| CZT HV Monitor | 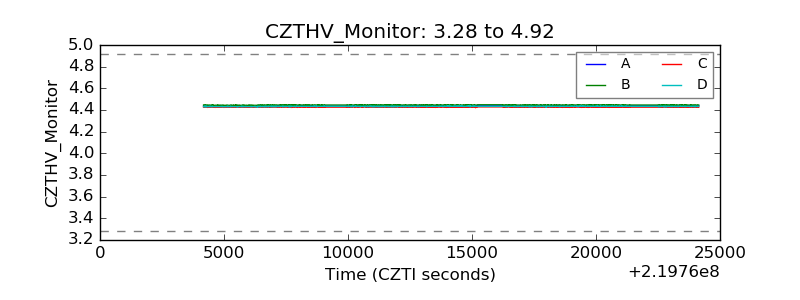 |
| D_VDD | 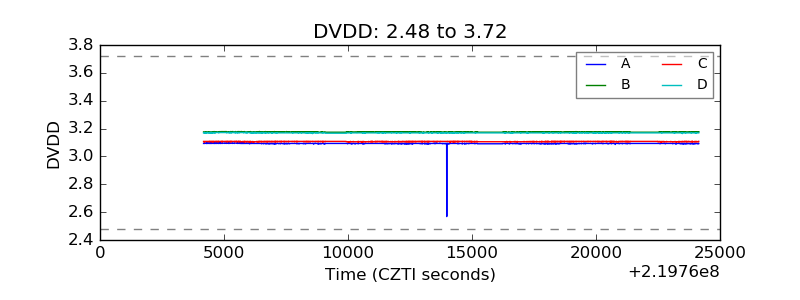 |
| Temperature 1 | 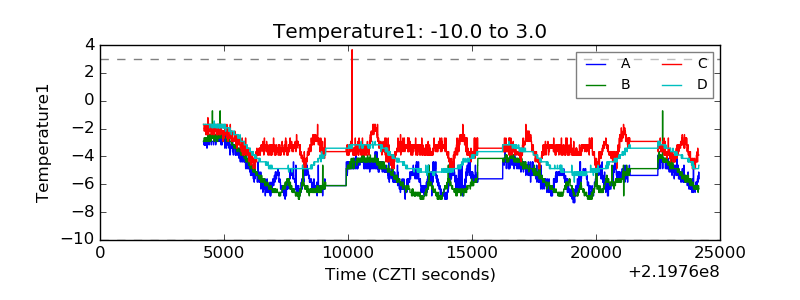 |
| Veto HV Monitor | 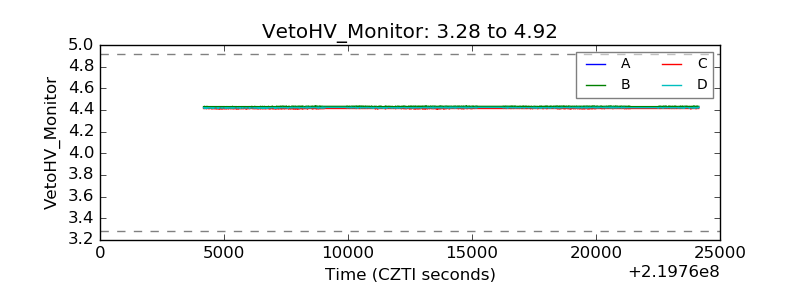 |
| Veto LLD | 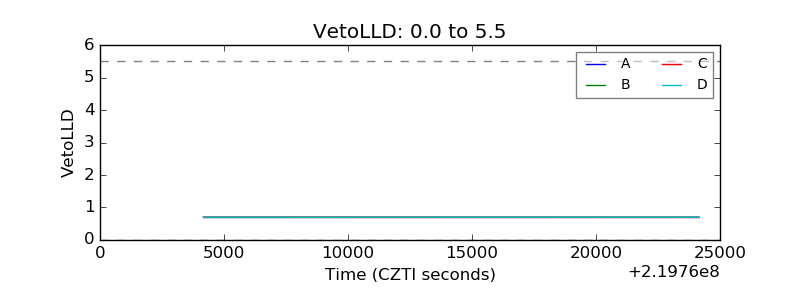 |
| Alpha Counter | 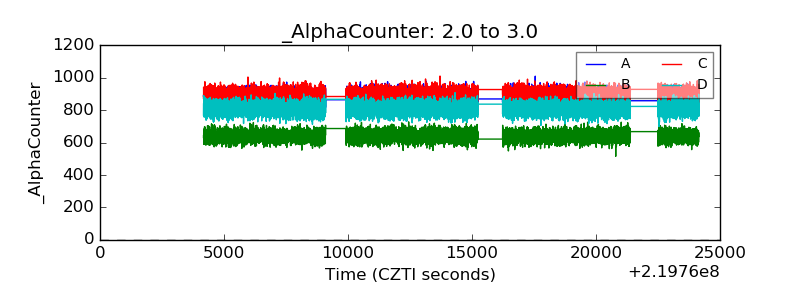 |
| _CPM_Rate | 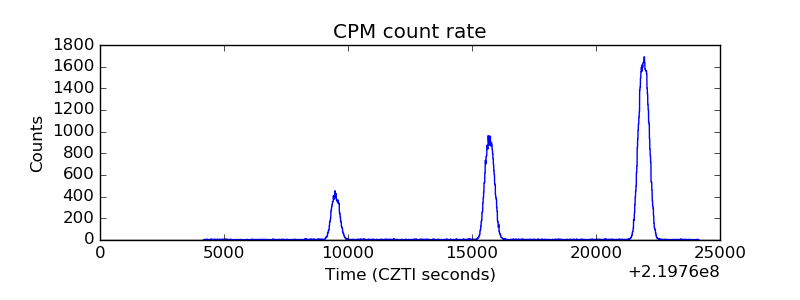 |
| CZT Counter | 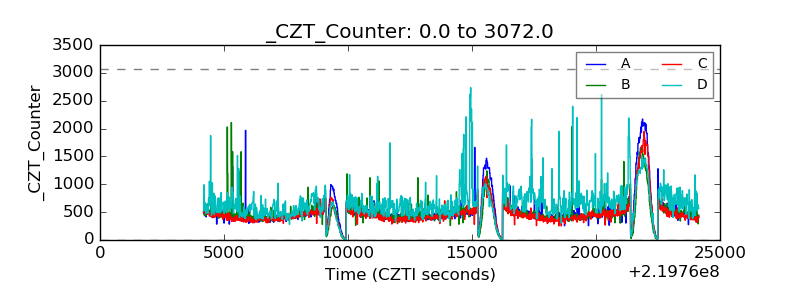 |
| +2.5 Volts monitor |  |
| +5 Volts monitor |  |
| _ROLL_ROT | 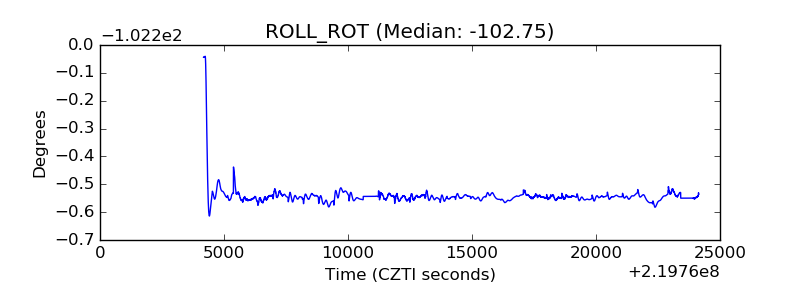 |
| _Roll_DEC | 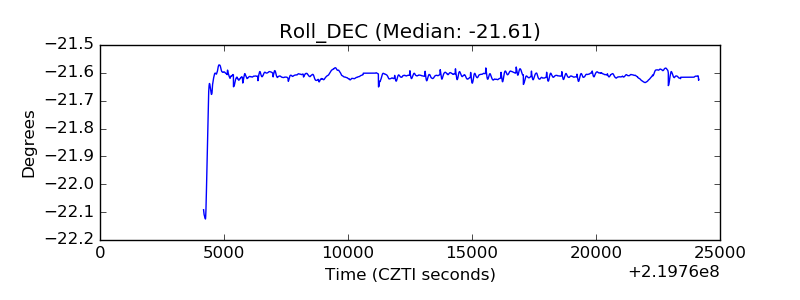 |
| _Roll_RA | 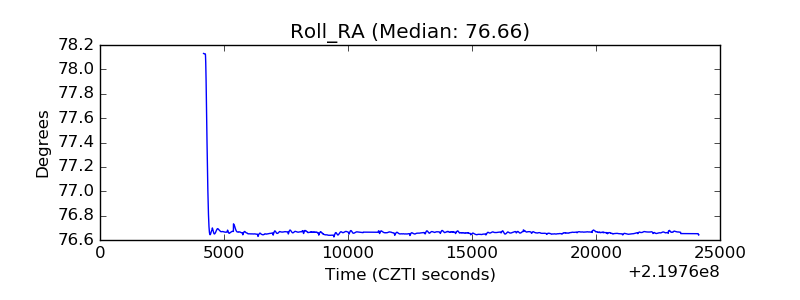 |
| Veto Counter | 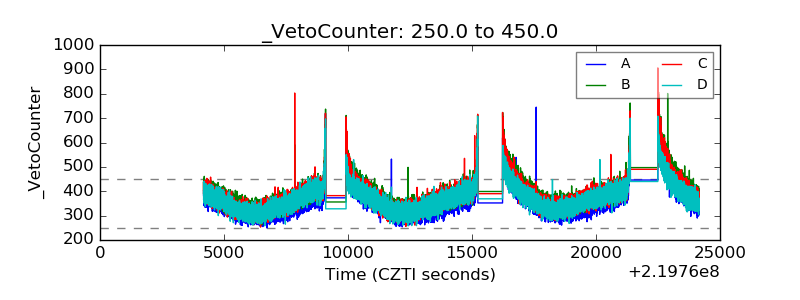 |