| Param | Original file | Final file |
|---|---|---|
| Filename | modeM0/AS1A02_082T01_9000000898_06628cztM0_level2.evt | modeM0/AS1A02_082T01_9000000898_06628cztM0_level2_quad_clean.evt |
| Size (bytes) | 464,178,240 | 87,451,200 |
| Size | 442.7 MB | 83.4 MB |
| Events in quadrant A | 3,082,242 | 562,764 |
| Events in quadrant B | 3,250,278 | 570,547 |
| Events in quadrant C | 2,947,992 | 550,628 |
| Events in quadrant D | 4,344,614 | 520,037 |
| Mode M9 | |||
|---|---|---|---|
| Quadrant | BADHDUFLAG | Total packets | Discarded packets |
| A | 0 | 14 | 0 |
| B | 0 | 14 | 0 |
| C | 0 | 14 | 0 |
| D | 0 | 15 | 0 |
| Mode M0 | |||
|---|---|---|---|
| Quadrant | BADHDUFLAG | Total packets | Discarded packets |
| A | 0 | 13354 | 3 |
| B | 0 | 13696 | 2 |
| C | 0 | 13035 | 2 |
| D | 0 | 17250 | 2 |
| Mode SS | |||
|---|---|---|---|
| Quadrant | BADHDUFLAG | Total packets | Discarded packets |
| A | 0 | 130 | 0 |
| B | 0 | 130 | 0 |
| C | 0 | 130 | 0 |
| D | 0 | 130 | 0 |
| Quadrant | Total seconds | Saturated seconds | Saturation percentage |
|---|---|---|---|
| A | 6365 | 39 | 0.612726% |
| B | 6365 | 43 | 0.675570% |
| C | 6365 | 20 | 0.314218% |
| D | 6365 | 136 | 2.136685% |
Noise dominated data is calculated using 1-second bins in cleaned event files. If a bin has >2000 counts, and if more than 50% of those come from <1% of pixels, then it is considered to be noise-dominated and hence unusable.
| Quadrant | # 1 sec bins | Bins with >0 counts | Bins with >2000 counts | High rate bins dominated by noise | Noise dominated (total time) | Noise dominated (detector-on time) | Marked lightcurve |
|---|---|---|---|---|---|---|---|
| A | 7655 | 6366 | 1 | 1 | 0.01% | 0.02% | 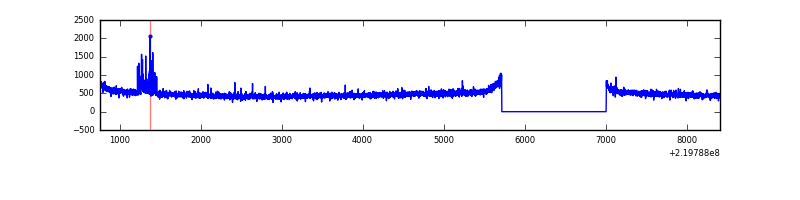 |
| B | 7655 | 6366 | 1 | 1 | 0.01% | 0.02% | 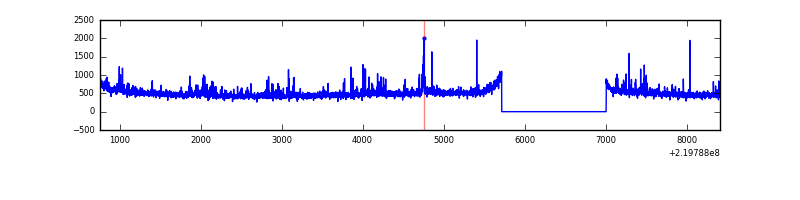 |
| C | 7655 | 6366 | 0 | 0 | 0.00% | 0.00% | 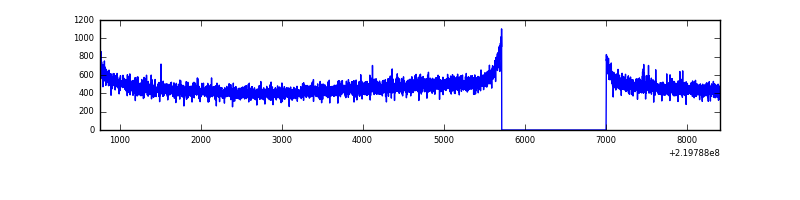 |
| D | 7655 | 6366 | 89 | 89 | 1.16% | 1.40% | 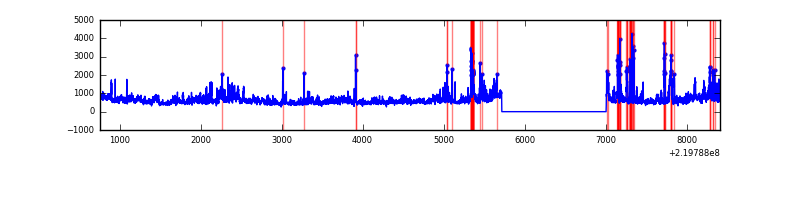 |
Top three noisy pixels from each quadrant. If the there are fewer than three noisy pixels in the level2.evt file, extra rows are filled as -1
| Pixel properties | Quadrant properties | ||||||
|---|---|---|---|---|---|---|---|
| Quadrant | DetID | PixID | Counts | Sigma | Mean | Median | Sigma |
| A | 8 | 15 | 97084 | 614.18 | 775 | 758 | 156.8 |
| A | 0 | 226 | 7262 | 41.47 | 775 | 758 | 156.8 |
| A | 12 | 194 | 7124 | 40.59 | 775 | 758 | 156.8 |
| B | 0 | 219 | 139350 | 927.61 | 785 | 768 | 149.4 |
| B | 4 | 81 | 55438 | 365.94 | 785 | 768 | 149.4 |
| B | 12 | 111 | 15877 | 101.13 | 785 | 768 | 149.4 |
| C | 13 | 61 | 5906 | 29.23 | 754 | 760 | 176.1 |
| C | 12 | 4 | 5730 | 28.23 | 754 | 760 | 176.1 |
| C | 3 | 202 | 1878 | 6.35 | 754 | 760 | 176.1 |
| D | 8 | 195 | 814187 | 4498.72 | 742 | 718 | 180.8 |
| D | 2 | 136 | 283648 | 1564.69 | 742 | 718 | 180.8 |
| D | 2 | 16 | 234598 | 1293.43 | 742 | 718 | 180.8 |
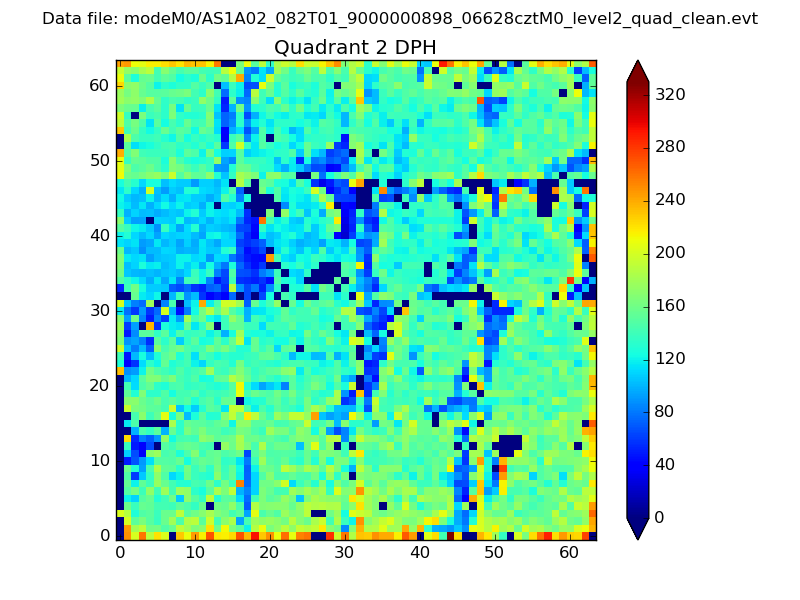
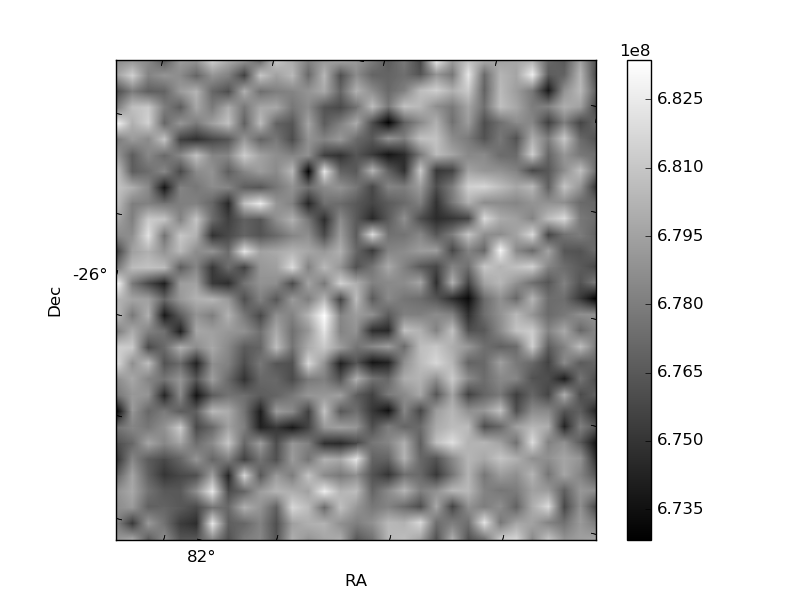
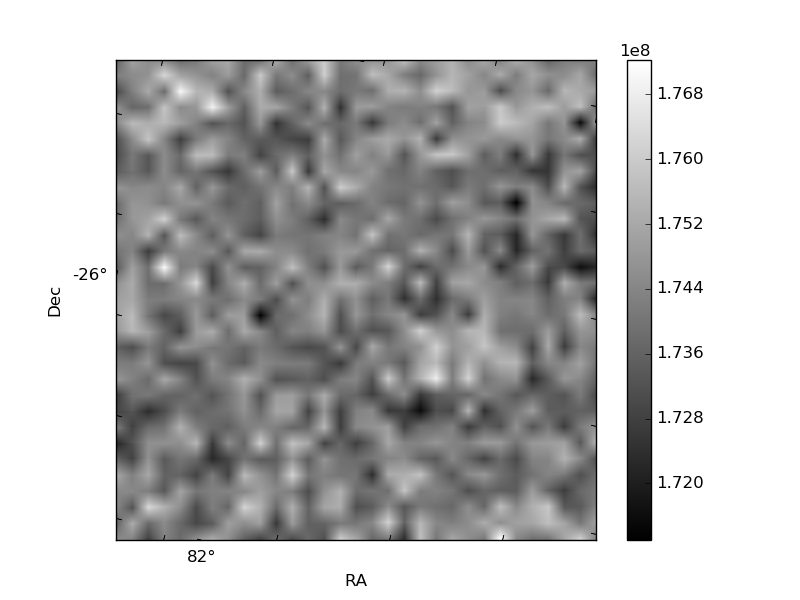
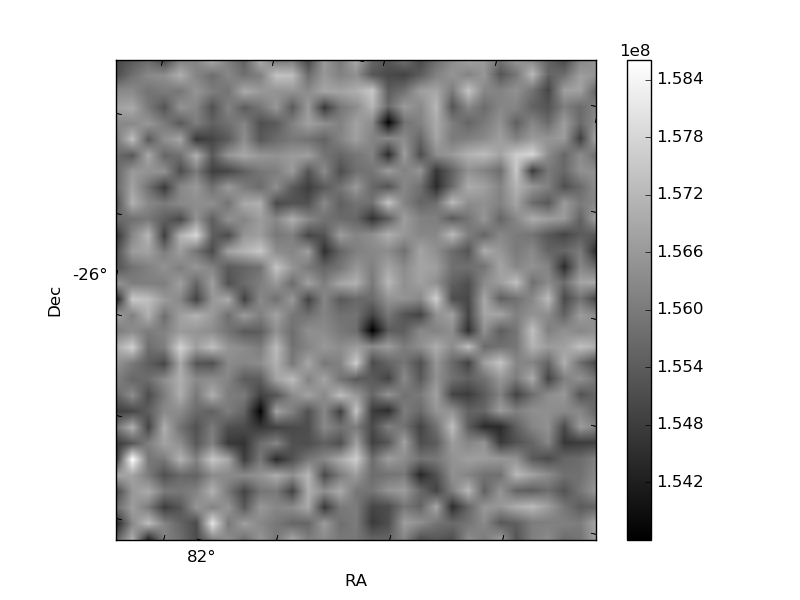
Histogram calculated using DETX and DETY for each event in the final _common_clean file
| Quadrant A | 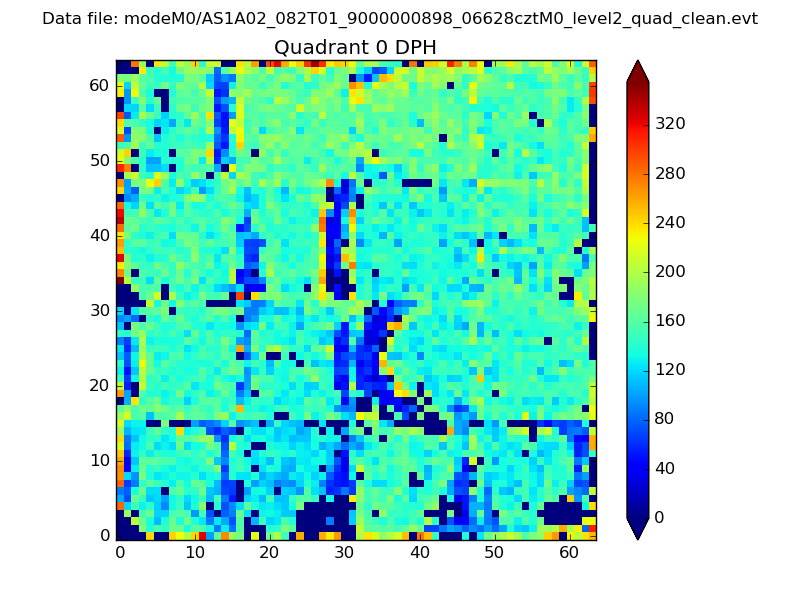 |
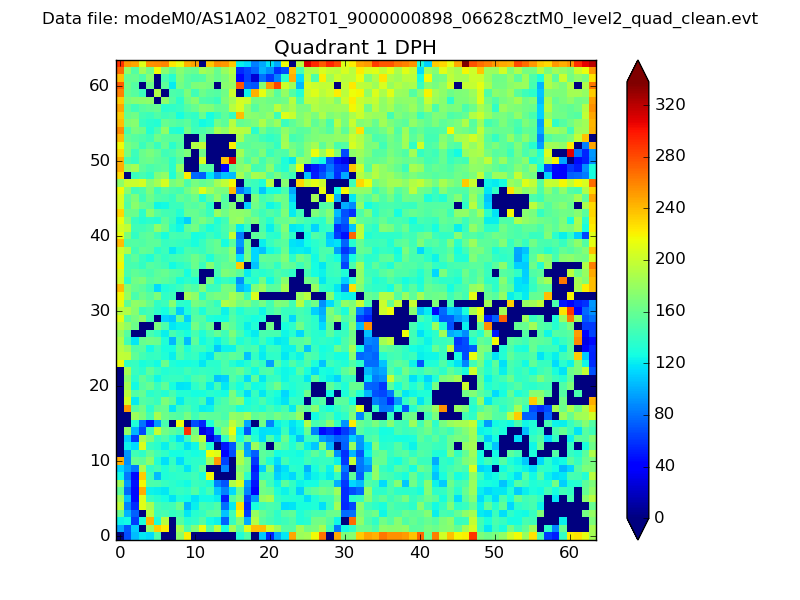 |
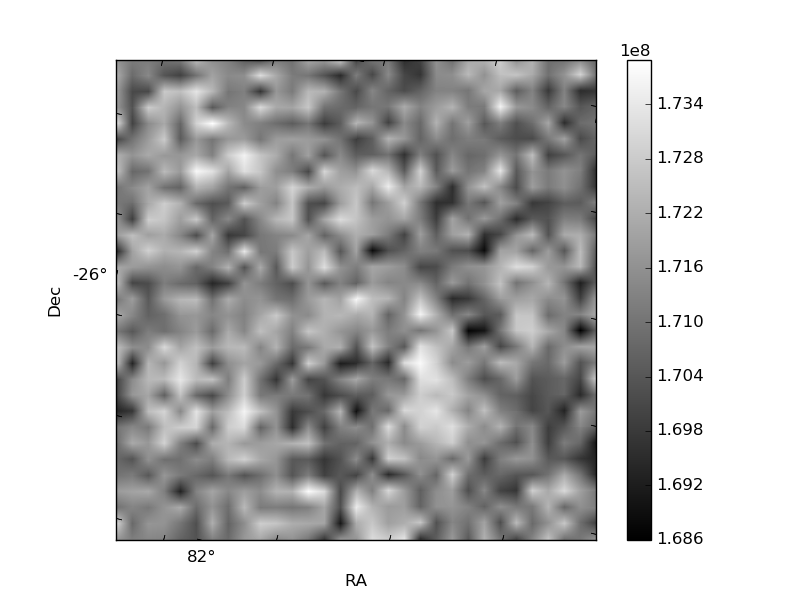
Quadrant B |
|---|---|---|---|
| Quadrant D | 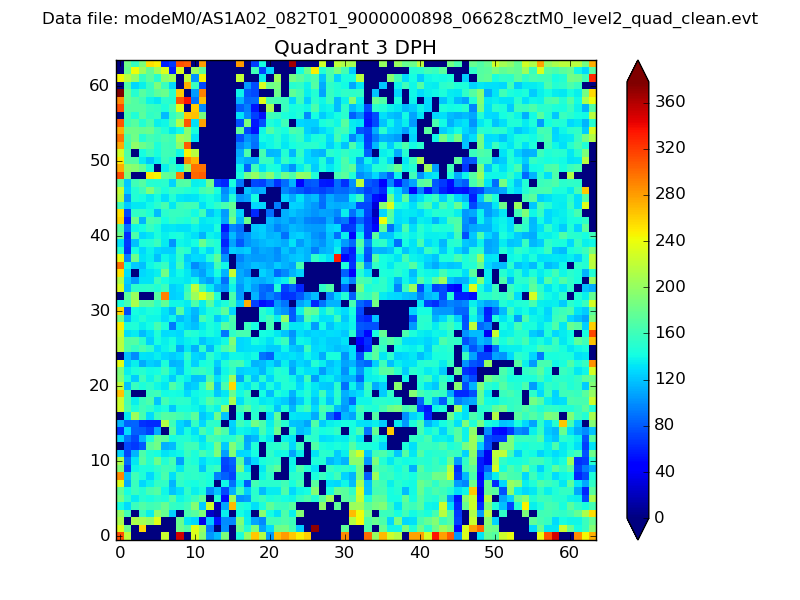 |
 |
Quadrant C |
| Plot type | Count rate plots | Images |
|---|---|---|
| Comparison with Poisson distribution Blue bars denote a histogram of data divided into 1 sec bins. Red curve is a Poisson curve with rate = median count rate of data. |
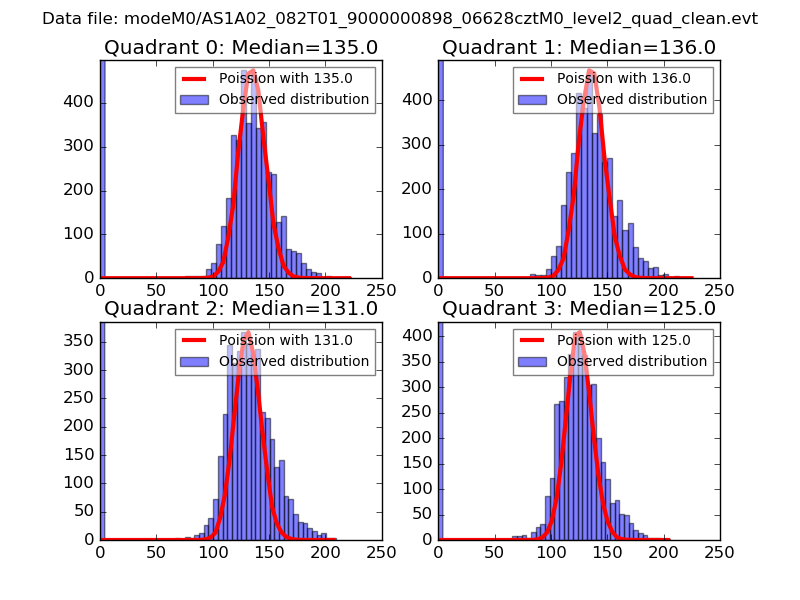 |
 |
| Quadrant-wise count rates Data is divided into 100 sec bins |
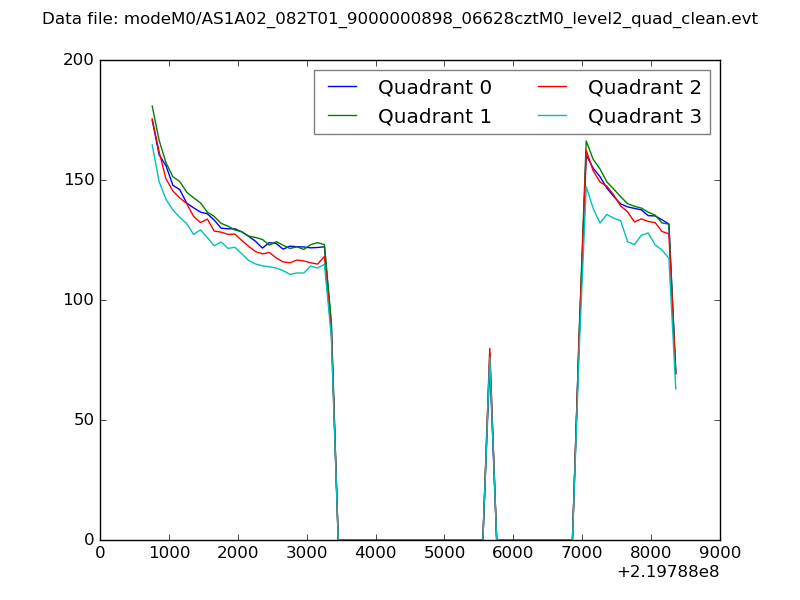 |
|
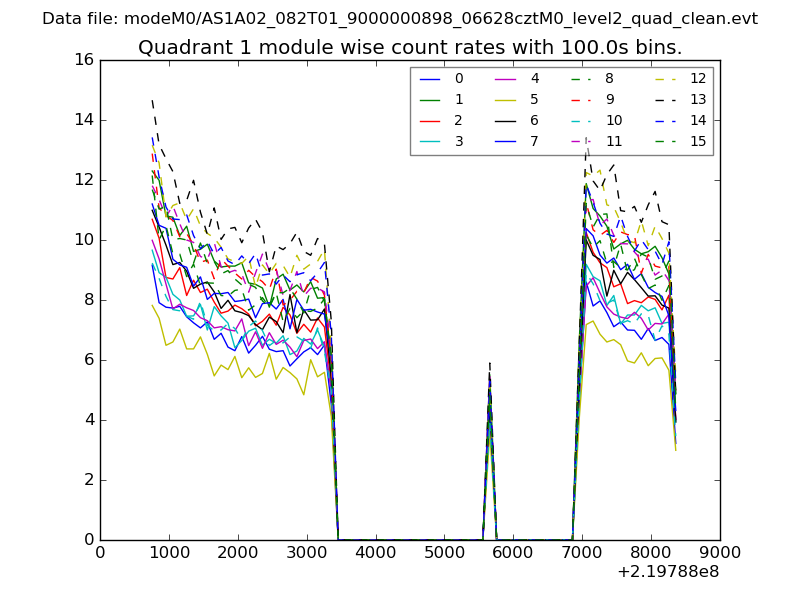
| Module-wise count rates for Quadrant A Data is divided into 100 sec bins |
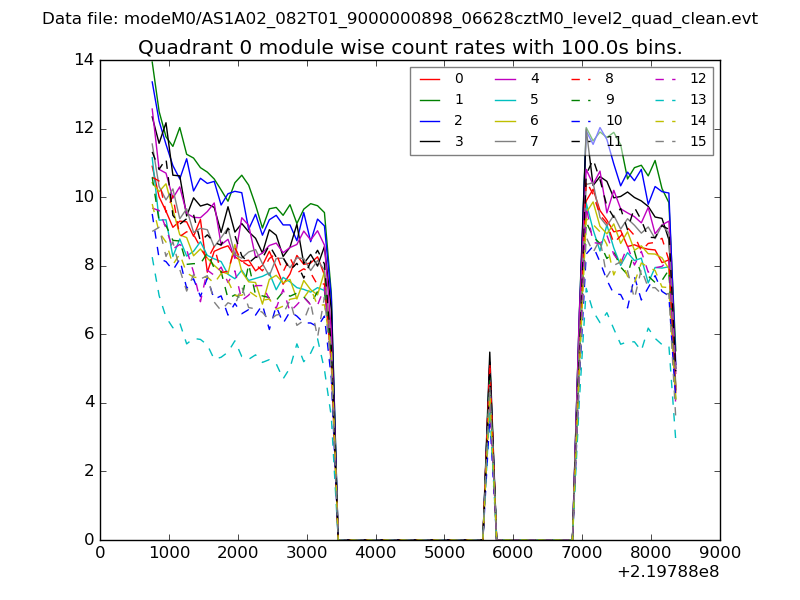 |
 |
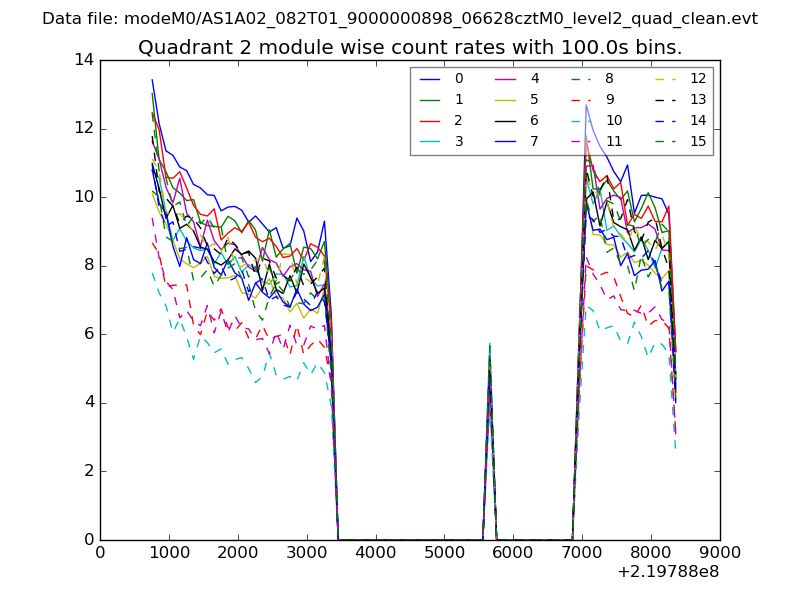
| Module-wise count rates for Quadrant B Data is divided into 100 sec bins |
 |
 |
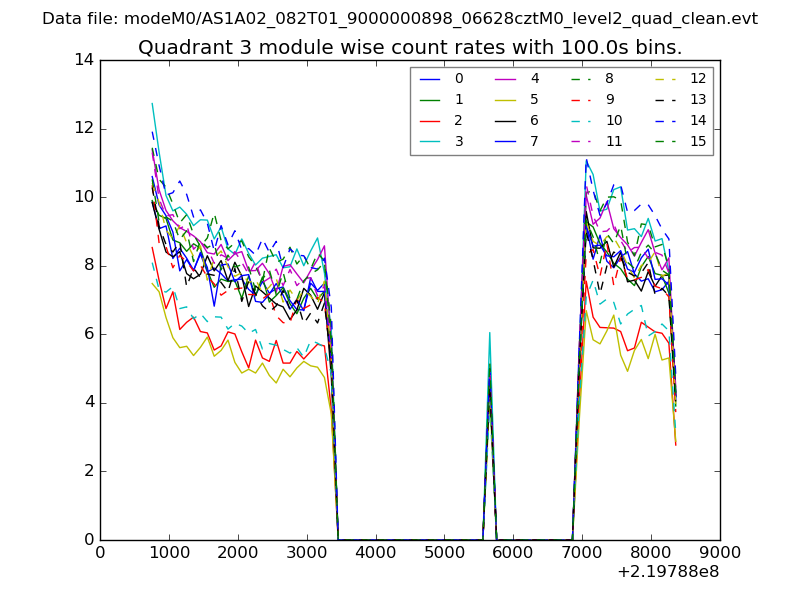
| Module-wise count rates for Quadrant C Data is divided into 100 sec bins |
 |
 |
| Module-wise count rates for Quadrant D Data is divided into 100 sec bins |
 |
 |
| Parameter | Plot |
|---|---|
| CZT HV Monitor | 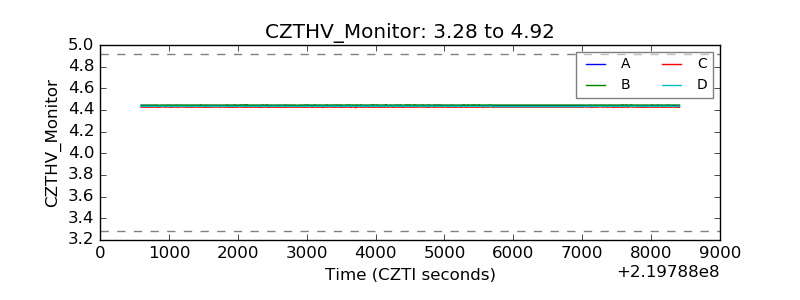 |
| D_VDD | 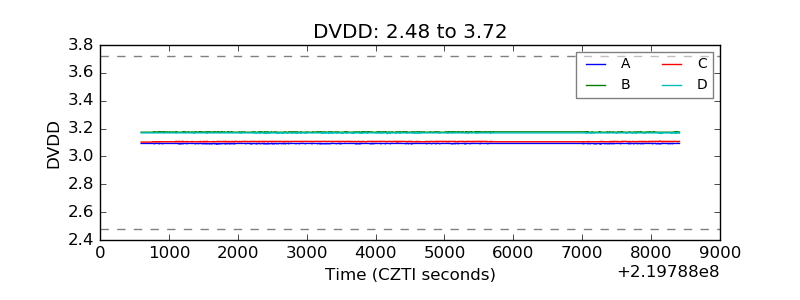 |
| Temperature 1 | 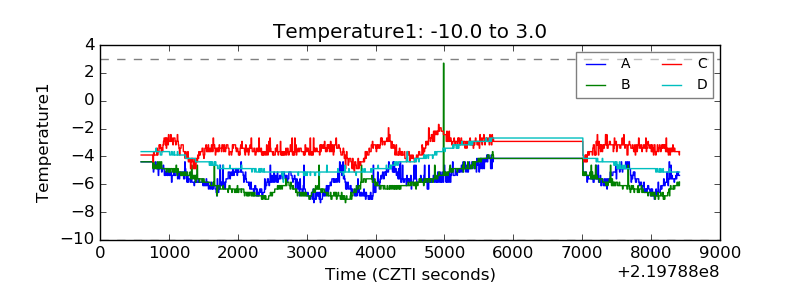 |
| Veto HV Monitor | 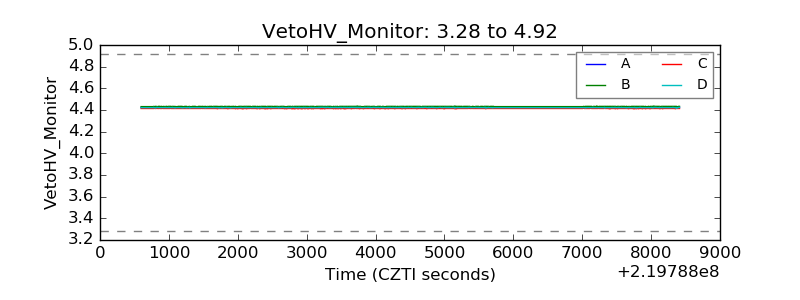 |
| Veto LLD | 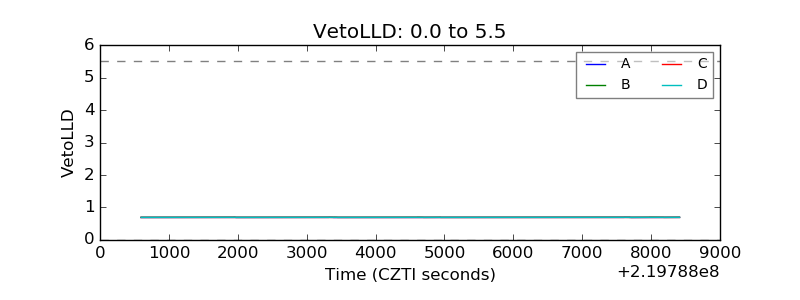 |
| Alpha Counter | 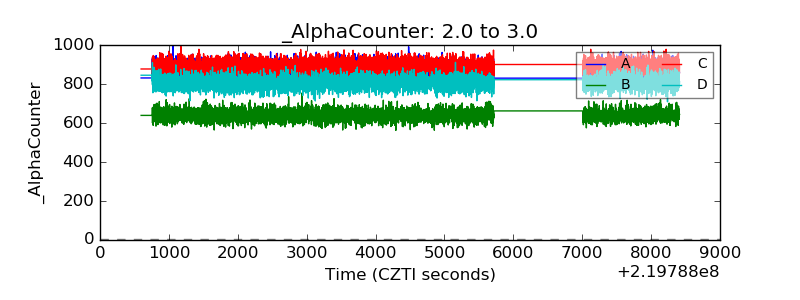 |
| _CPM_Rate | 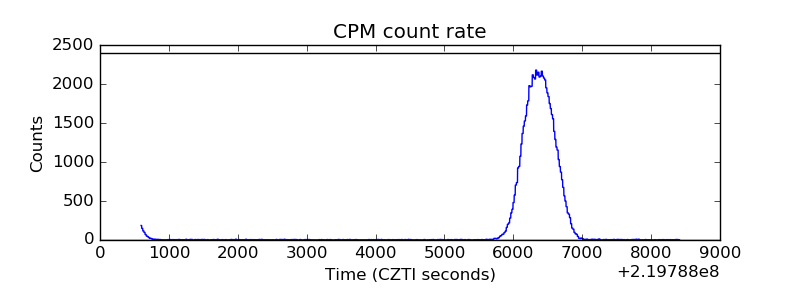 |
| CZT Counter | 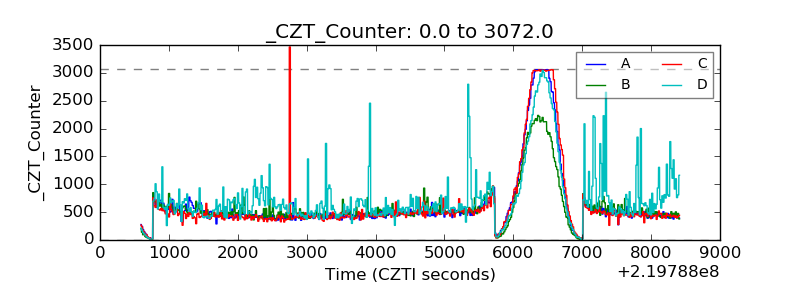 |
| +2.5 Volts monitor |  |
| +5 Volts monitor |  |
| _ROLL_ROT | 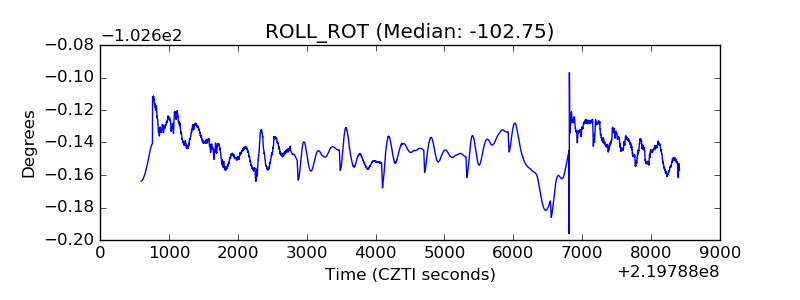 |
| _Roll_DEC | 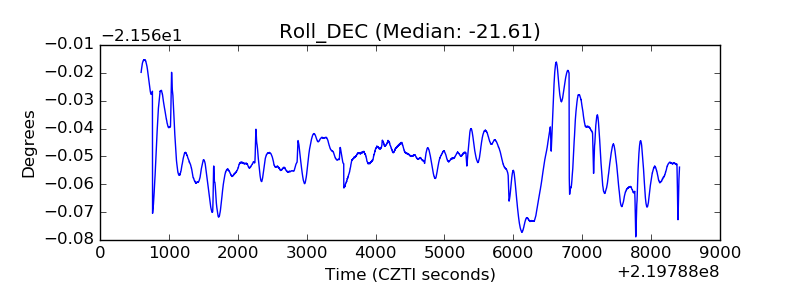 |
| _Roll_RA | 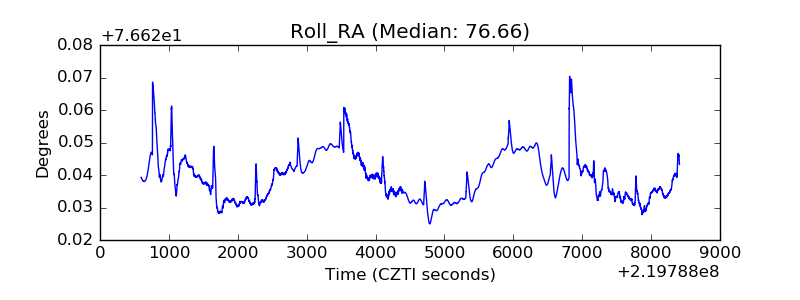 |
| Veto Counter | 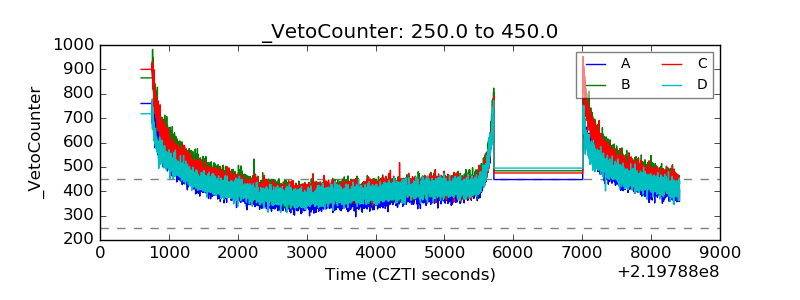 |