| Param | Original file | Final file |
|---|---|---|
| Filename | modeM0/AS1A02_082T01_9000000898_06629cztM0_level2.evt | modeM0/AS1A02_082T01_9000000898_06629cztM0_level2_quad_clean.evt |
| Size (bytes) | 509,777,280 | 87,027,840 |
| Size | 486.2 MB | 83.0 MB |
| Events in quadrant A | 3,011,421 | 561,809 |
| Events in quadrant B | 3,162,351 | 568,995 |
| Events in quadrant C | 2,956,015 | 553,306 |
| Events in quadrant D | 5,879,924 | 509,942 |
| Mode M9 | |||
|---|---|---|---|
| Quadrant | BADHDUFLAG | Total packets | Discarded packets |
| A | 0 | 17 | 0 |
| B | 0 | 17 | 0 |
| C | 0 | 17 | 0 |
| D | 0 | 18 | 0 |
| Mode M0 | |||
|---|---|---|---|
| Quadrant | BADHDUFLAG | Total packets | Discarded packets |
| A | 0 | 13070 | 3 |
| B | 0 | 13360 | 2 |
| C | 0 | 12983 | 2 |
| D | 0 | 21974 | 2 |
| Mode SS | |||
|---|---|---|---|
| Quadrant | BADHDUFLAG | Total packets | Discarded packets |
| A | 0 | 128 | 0 |
| B | 0 | 128 | 0 |
| C | 0 | 128 | 0 |
| D | 0 | 128 | 0 |
| Quadrant | Total seconds | Saturated seconds | Saturation percentage |
|---|---|---|---|
| A | 6325 | 23 | 0.363636% |
| B | 6325 | 26 | 0.411067% |
| C | 6325 | 8 | 0.126482% |
| D | 6325 | 323 | 5.106719% |
Noise dominated data is calculated using 1-second bins in cleaned event files. If a bin has >2000 counts, and if more than 50% of those come from <1% of pixels, then it is considered to be noise-dominated and hence unusable.
| Quadrant | # 1 sec bins | Bins with >0 counts | Bins with >2000 counts | High rate bins dominated by noise | Noise dominated (total time) | Noise dominated (detector-on time) | Marked lightcurve |
|---|---|---|---|---|---|---|---|
| A | 7650 | 6326 | 0 | 0 | 0.00% | 0.00% | 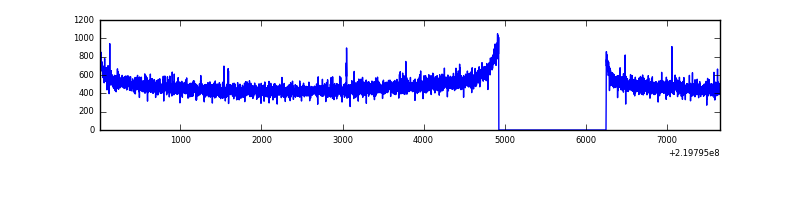 |
| B | 7650 | 6326 | 1 | 1 | 0.01% | 0.02% |  |
| C | 7650 | 6326 | 0 | 0 | 0.00% | 0.00% |  |
| D | 7650 | 6326 | 190 | 190 | 2.48% | 3.00% |  |
Top three noisy pixels from each quadrant. If the there are fewer than three noisy pixels in the level2.evt file, extra rows are filled as -1
| Pixel properties | Quadrant properties | ||||||
|---|---|---|---|---|---|---|---|
| Quadrant | DetID | PixID | Counts | Sigma | Mean | Median | Sigma |
| A | 8 | 15 | 43807 | 275.79 | 770 | 757 | 156.1 |
| A | 0 | 226 | 7258 | 41.65 | 770 | 757 | 156.1 |
| A | 12 | 194 | 7170 | 41.08 | 770 | 757 | 156.1 |
| B | 0 | 219 | 98662 | 660.57 | 781 | 763 | 148.2 |
| B | 4 | 81 | 18229 | 117.85 | 781 | 763 | 148.2 |
| B | 12 | 111 | 15614 | 100.21 | 781 | 763 | 148.2 |
| C | 12 | 4 | 10551 | 55.77 | 755 | 761 | 175.6 |
| C | 13 | 61 | 6004 | 29.86 | 755 | 761 | 175.6 |
| C | 3 | 202 | 1917 | 6.58 | 755 | 761 | 175.6 |
| D | 8 | 195 | 1588751 | 8919.27 | 732 | 711 | 178.0 |
| D | 2 | 16 | 1112773 | 6245.93 | 732 | 711 | 178.0 |
| D | 2 | 33 | 164683 | 920.95 | 732 | 711 | 178.0 |
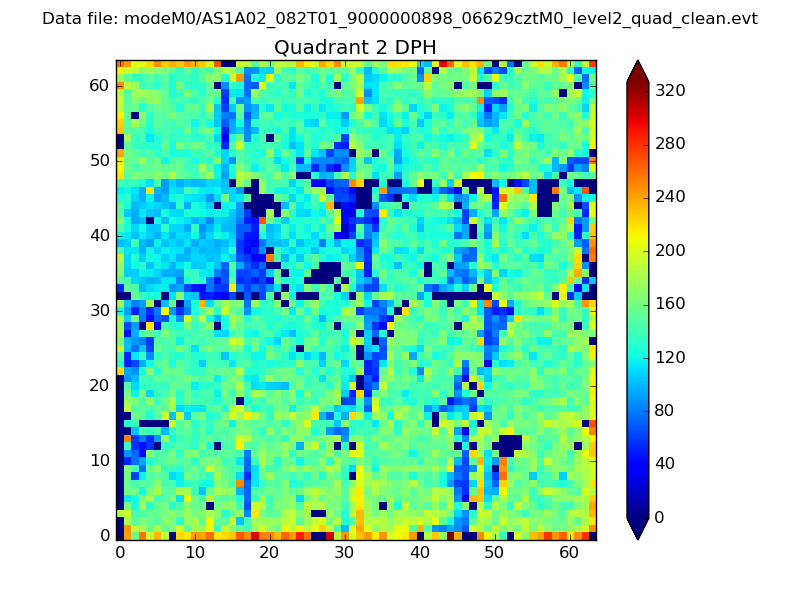
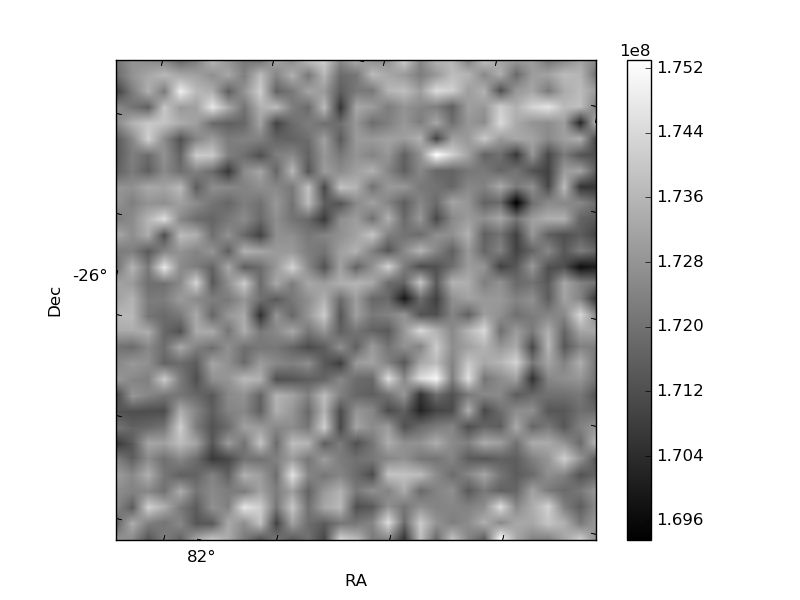
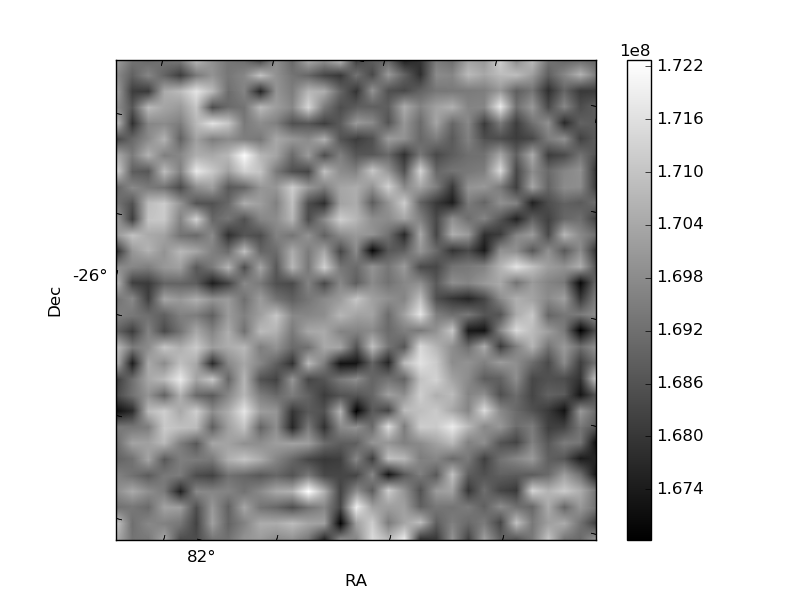
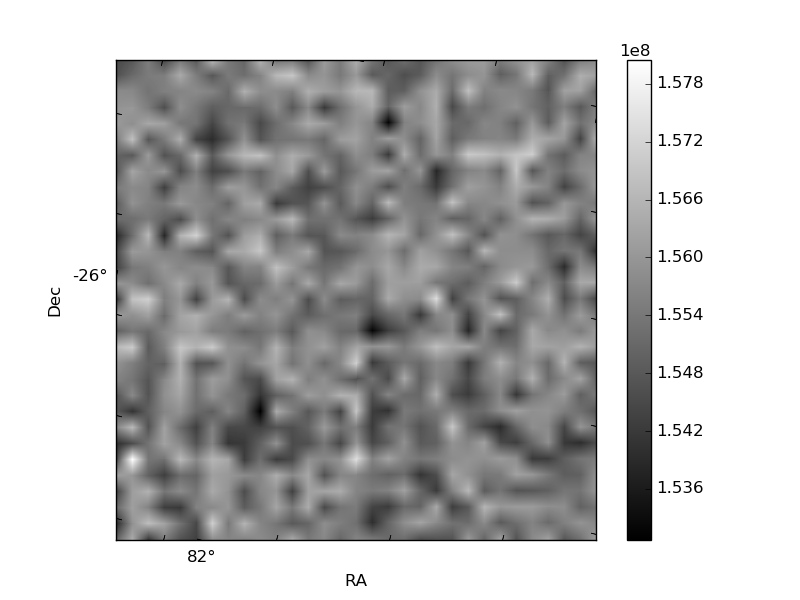
Histogram calculated using DETX and DETY for each event in the final _common_clean file
| Quadrant A | 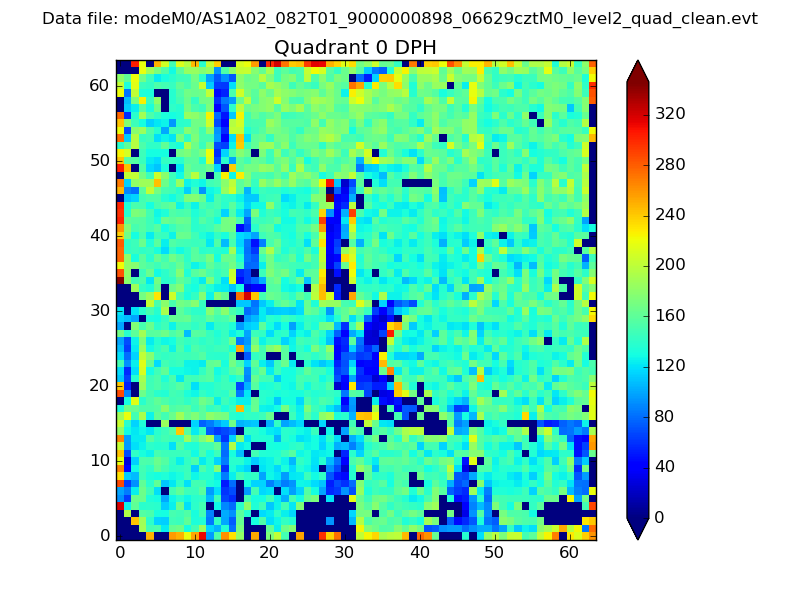 |
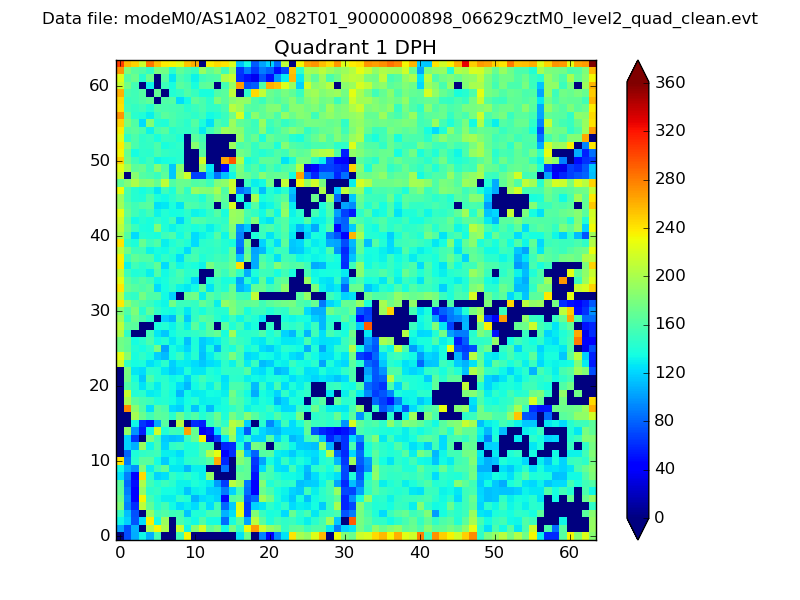 |
Quadrant B |
|---|---|---|---|
| Quadrant D | 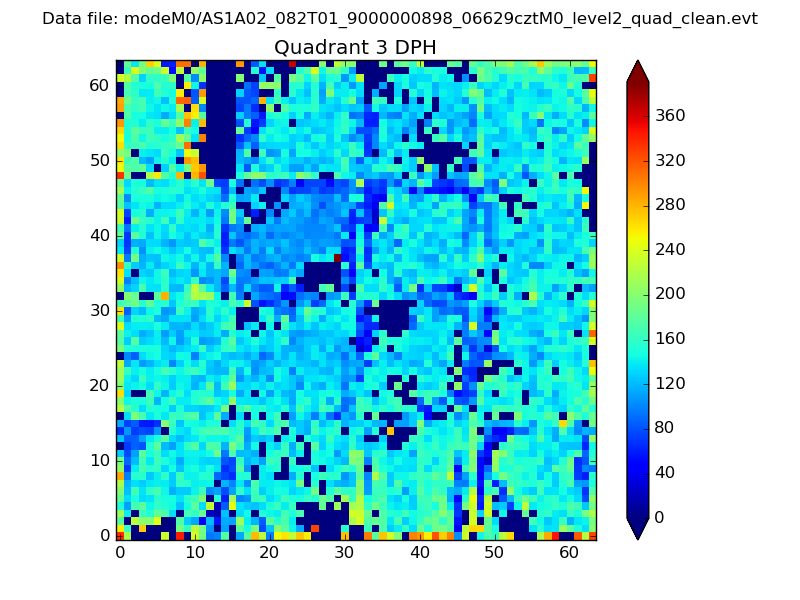 |
 |
Quadrant C |
| Plot type | Count rate plots | Images |
|---|---|---|
| Comparison with Poisson distribution Blue bars denote a histogram of data divided into 1 sec bins. Red curve is a Poisson curve with rate = median count rate of data. |
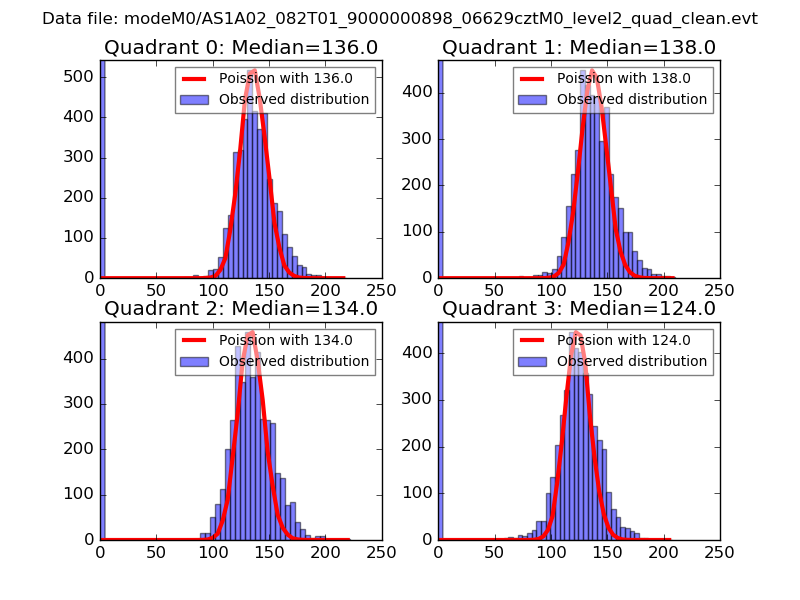 |
 |
| Quadrant-wise count rates Data is divided into 100 sec bins |
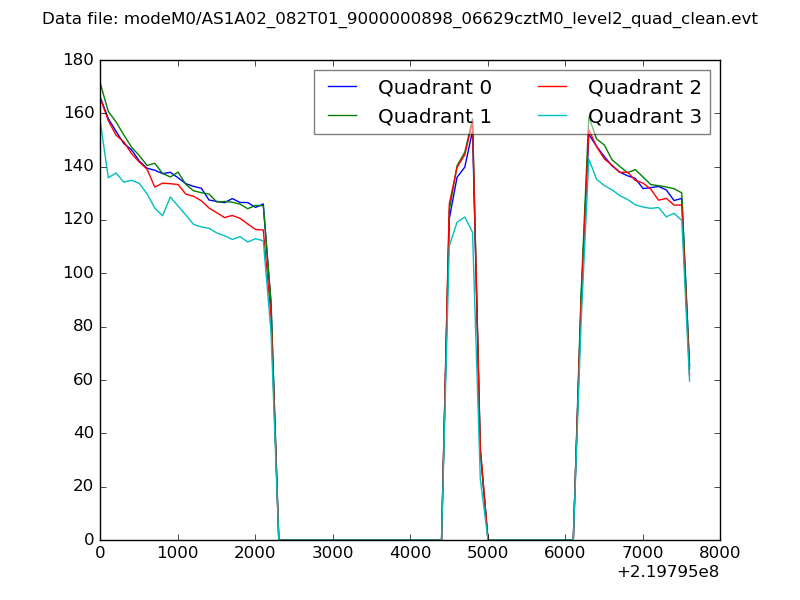 |
|
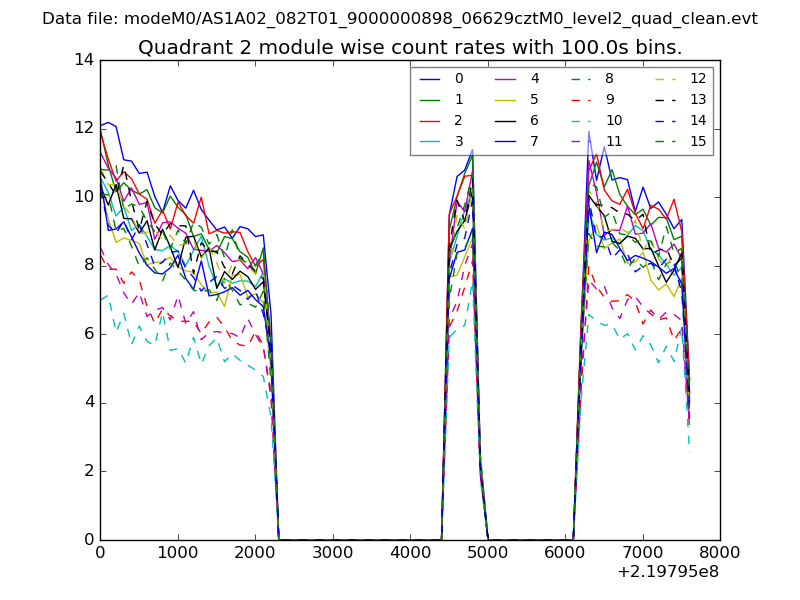
| Module-wise count rates for Quadrant A Data is divided into 100 sec bins |
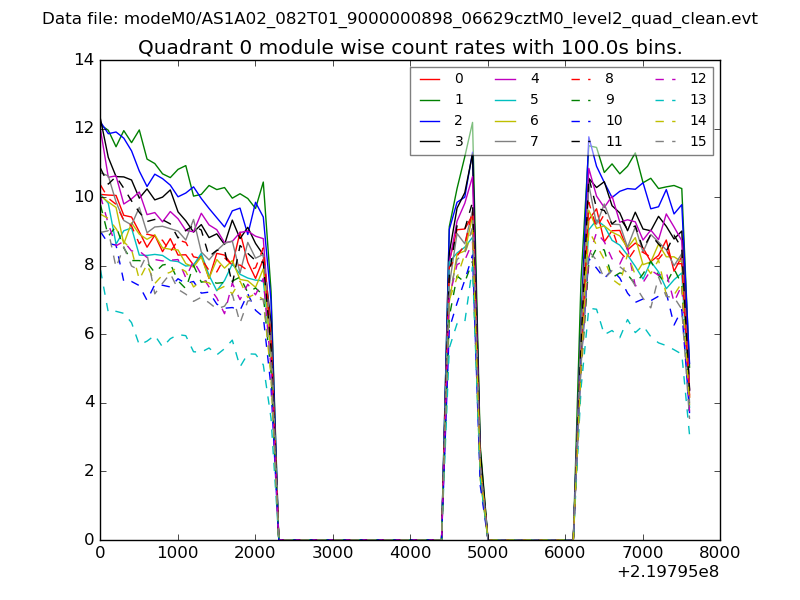 |
 |
| Module-wise count rates for Quadrant B Data is divided into 100 sec bins |
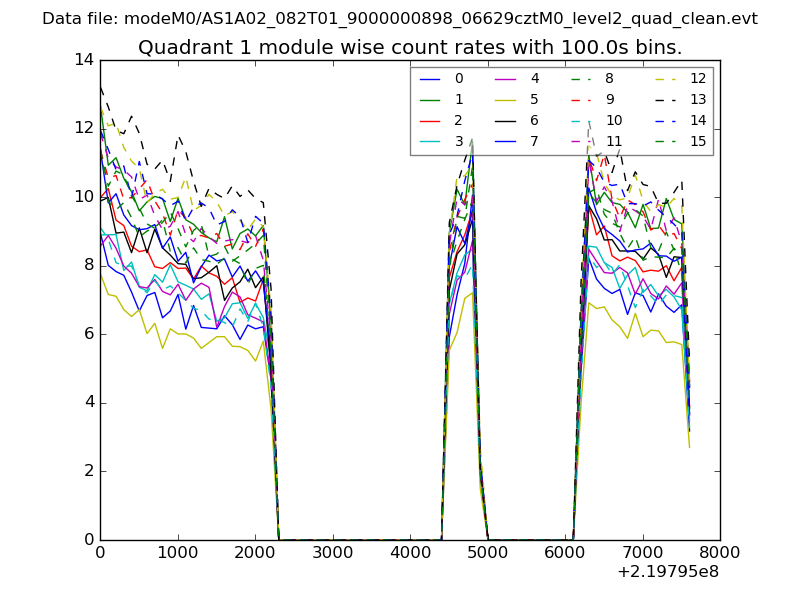 |
 |
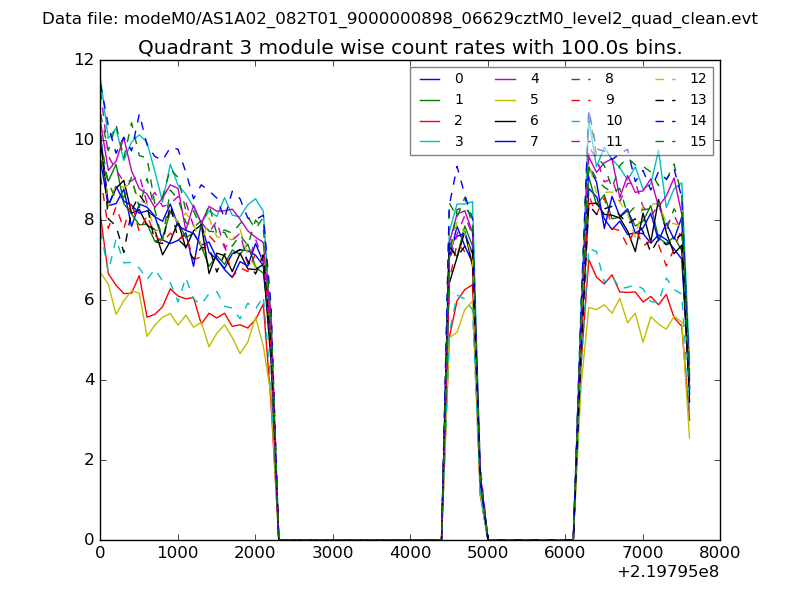
| Module-wise count rates for Quadrant C Data is divided into 100 sec bins |
 |
 |
| Module-wise count rates for Quadrant D Data is divided into 100 sec bins |
 |
 |
| Parameter | Plot |
|---|---|
| CZT HV Monitor | 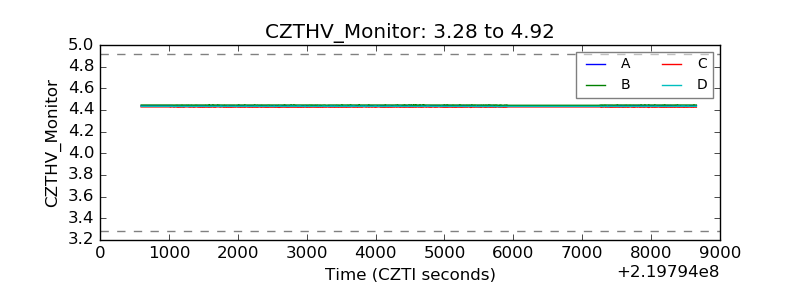 |
| D_VDD | 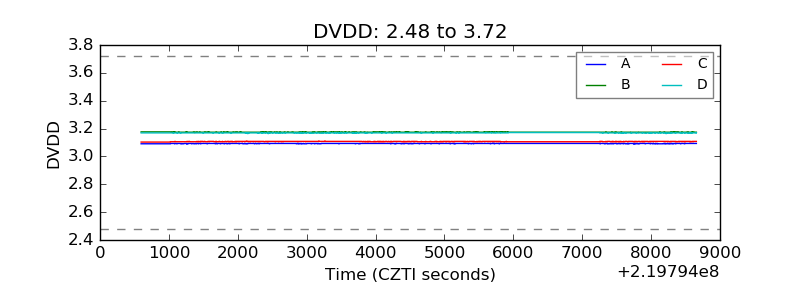 |
| Temperature 1 | 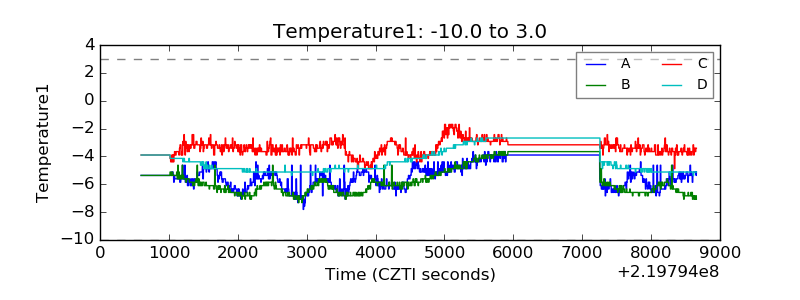 |
| Veto HV Monitor | 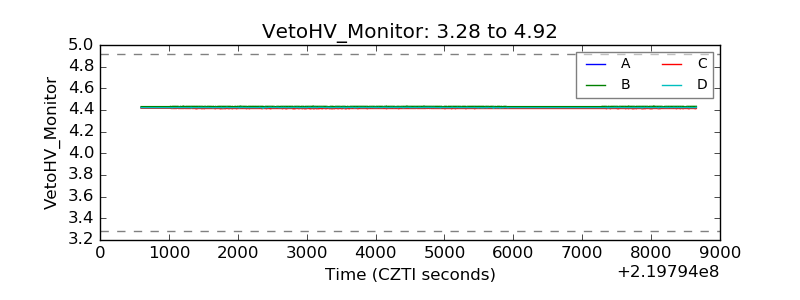 |
| Veto LLD | 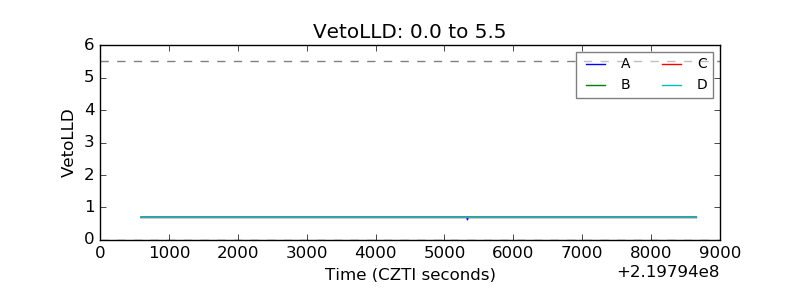 |
| Alpha Counter | 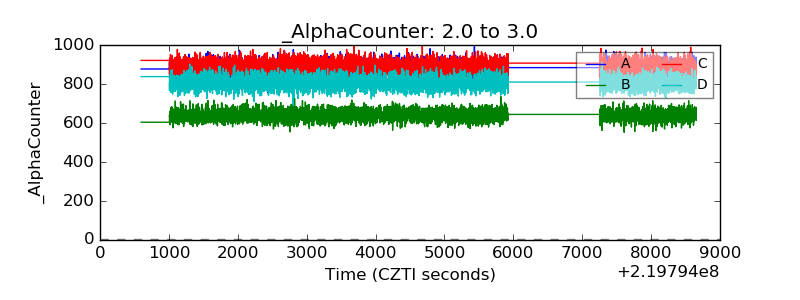 |
| _CPM_Rate | 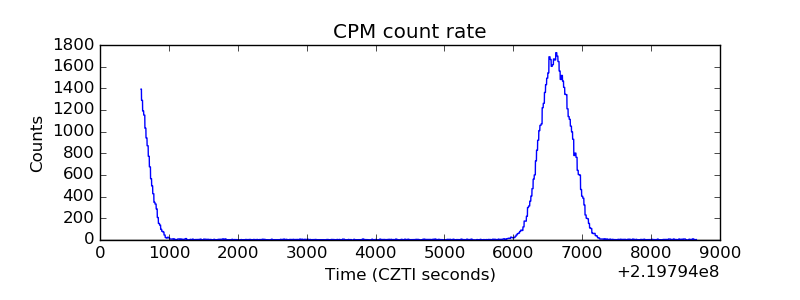 |
| CZT Counter | 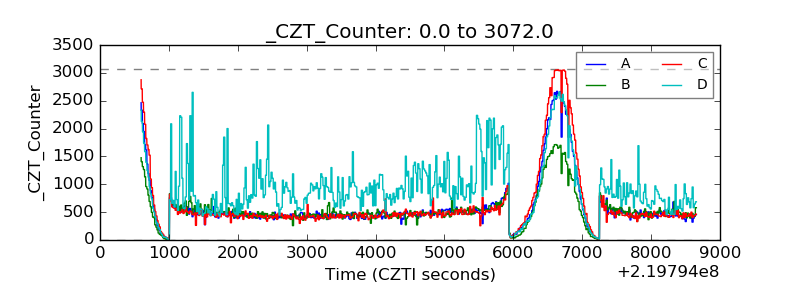 |
| +2.5 Volts monitor |  |
| +5 Volts monitor |  |
| _ROLL_ROT | 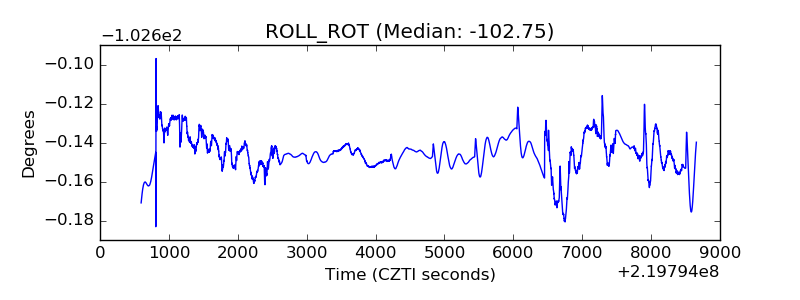 |
| _Roll_DEC | 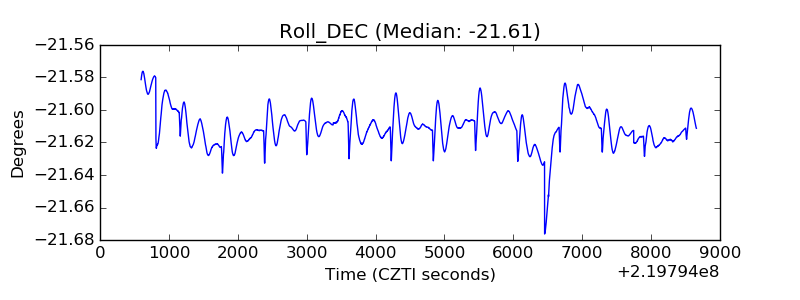 |
| _Roll_RA | 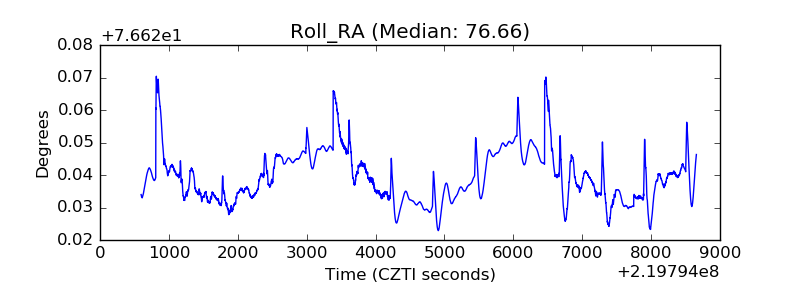 |
| Veto Counter | 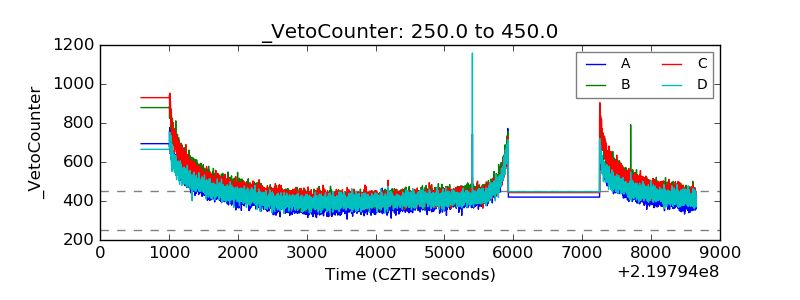 |