| Param | Original file | Final file |
|---|---|---|
| Filename | modeM0/AS1A02_082T01_9000000898_06633cztM0_level2.evt | modeM0/AS1A02_082T01_9000000898_06633cztM0_level2_quad_clean.evt |
| Size (bytes) | 589,512,960 | 87,073,920 |
| Size | 562.2 MB | 83.0 MB |
| Events in quadrant A | 3,627,685 | 533,776 |
| Events in quadrant B | 4,168,329 | 532,503 |
| Events in quadrant C | 3,652,861 | 526,235 |
| Events in quadrant D | 5,881,934 | 508,108 |
| Mode M9 | |||
|---|---|---|---|
| Quadrant | BADHDUFLAG | Total packets | Discarded packets |
| A | 0 | 7 | 0 |
| B | 0 | 7 | 0 |
| C | 0 | 7 | 0 |
| D | 0 | 7 | 0 |
| Mode M0 | |||
|---|---|---|---|
| Quadrant | BADHDUFLAG | Total packets | Discarded packets |
| A | 0 | 16220 | 4 |
| B | 0 | 17554 | 3 |
| C | 0 | 16283 | 3 |
| D | 0 | 22966 | 3 |
| Mode SS | |||
|---|---|---|---|
| Quadrant | BADHDUFLAG | Total packets | Discarded packets |
| A | 0 | 160 | 0 |
| B | 0 | 160 | 0 |
| C | 0 | 160 | 0 |
| D | 0 | 160 | 0 |
| Quadrant | Total seconds | Saturated seconds | Saturation percentage |
|---|---|---|---|
| A | 7696 | 230 | 2.988565% |
| B | 7696 | 404 | 5.249480% |
| C | 7696 | 241 | 3.131497% |
| D | 7696 | 535 | 6.951663% |
Noise dominated data is calculated using 1-second bins in cleaned event files. If a bin has >2000 counts, and if more than 50% of those come from <1% of pixels, then it is considered to be noise-dominated and hence unusable.
| Quadrant | # 1 sec bins | Bins with >0 counts | Bins with >2000 counts | High rate bins dominated by noise | Noise dominated (total time) | Noise dominated (detector-on time) | Marked lightcurve |
|---|---|---|---|---|---|---|---|
| A | 8501 | 7699 | 0 | 0 | 0.00% | 0.00% | 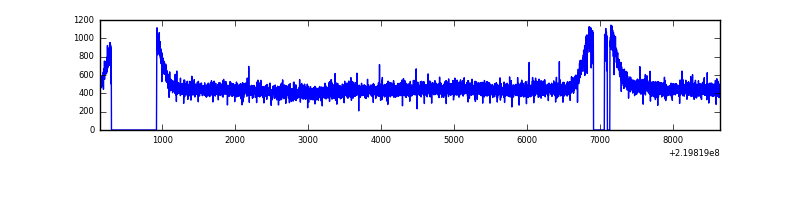 |
| B | 8501 | 7699 | 96 | 96 | 1.13% | 1.25% | 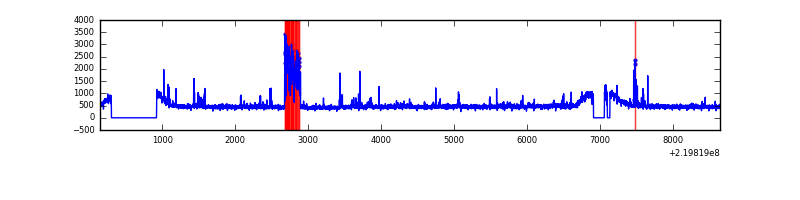 |
| C | 8501 | 7699 | 0 | 0 | 0.00% | 0.00% | 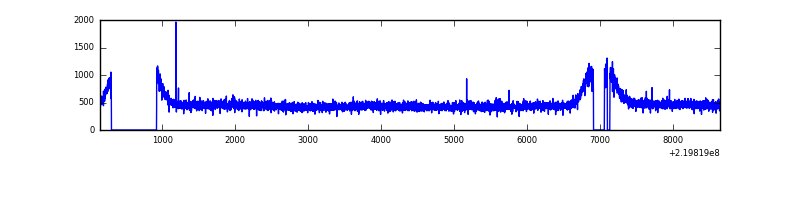 |
| D | 8501 | 7699 | 254 | 254 | 2.99% | 3.30% | 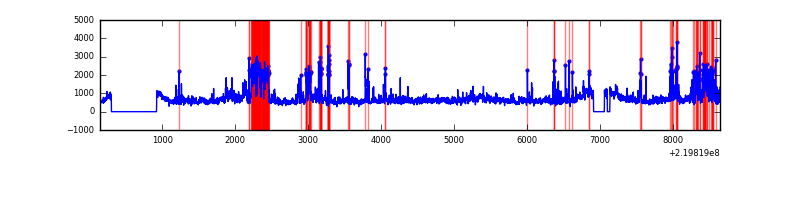 |
Top three noisy pixels from each quadrant. If the there are fewer than three noisy pixels in the level2.evt file, extra rows are filled as -1
| Pixel properties | Quadrant properties | ||||||
|---|---|---|---|---|---|---|---|
| Quadrant | DetID | PixID | Counts | Sigma | Mean | Median | Sigma |
| A | 8 | 15 | 13831 | 67.16 | 938 | 917 | 192.3 |
| A | 0 | 226 | 8856 | 41.29 | 938 | 917 | 192.3 |
| A | 12 | 194 | 8452 | 39.18 | 938 | 917 | 192.3 |
| B | 4 | 81 | 376816 | 2027.44 | 939 | 914 | 185.4 |
| B | 0 | 219 | 126325 | 676.41 | 939 | 914 | 185.4 |
| B | 12 | 111 | 20240 | 104.24 | 939 | 914 | 185.4 |
| C | 8 | 128 | 22022 | 97.02 | 921 | 923 | 217.5 |
| C | 9 | 247 | 15176 | 65.54 | 921 | 923 | 217.5 |
| C | 8 | 112 | 8661 | 35.58 | 921 | 923 | 217.5 |
| D | 2 | 33 | 1222900 | 5440.54 | 911 | 881 | 224.6 |
| D | 8 | 195 | 1141803 | 5079.48 | 911 | 881 | 224.6 |
| D | 2 | 14 | 28786 | 124.24 | 911 | 881 | 224.6 |
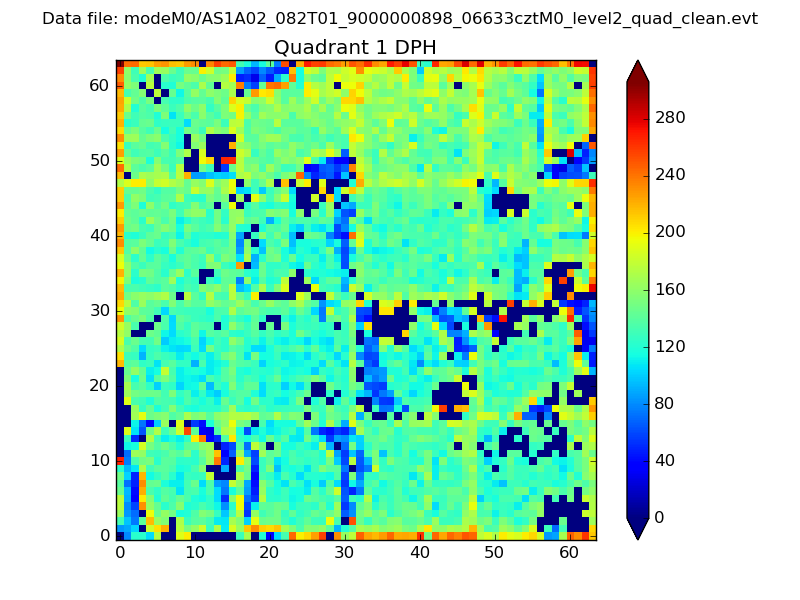
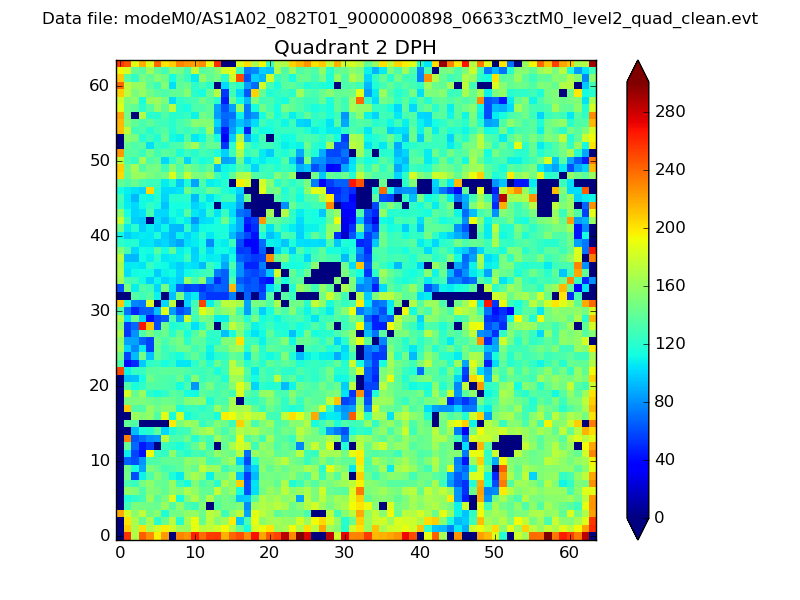
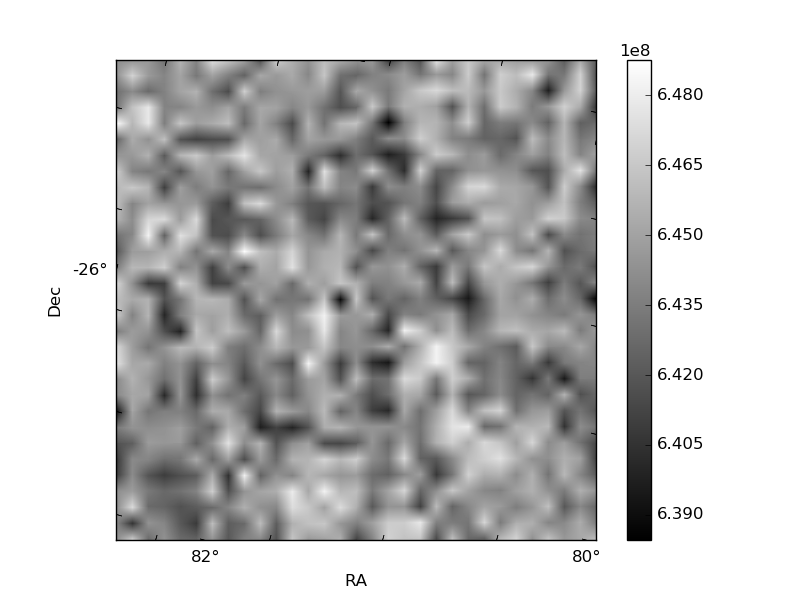
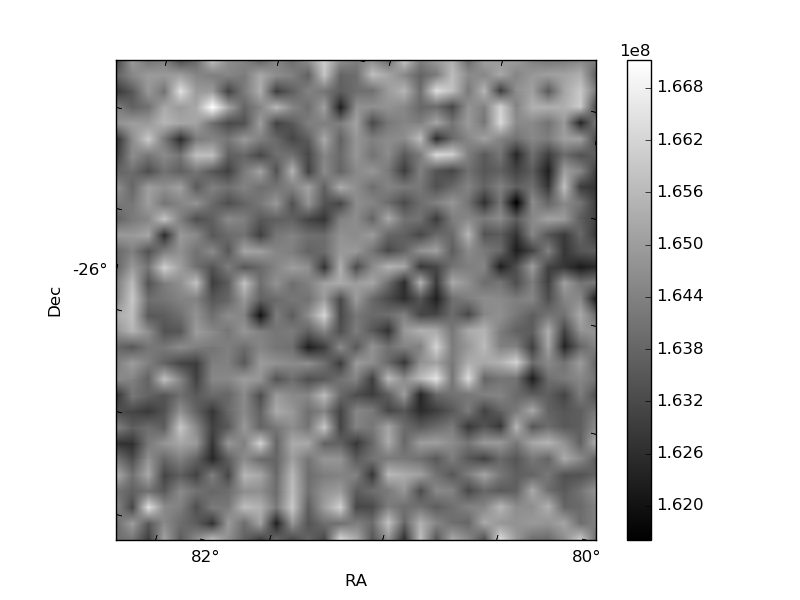
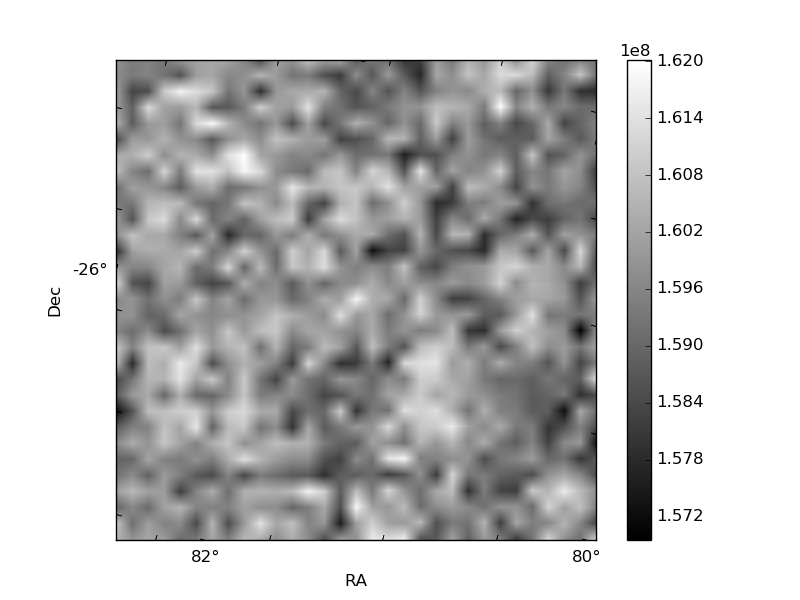
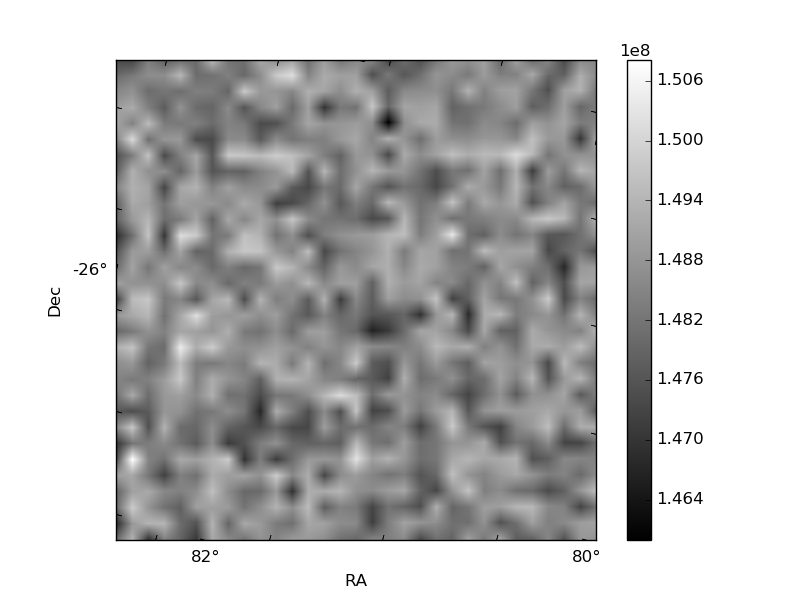
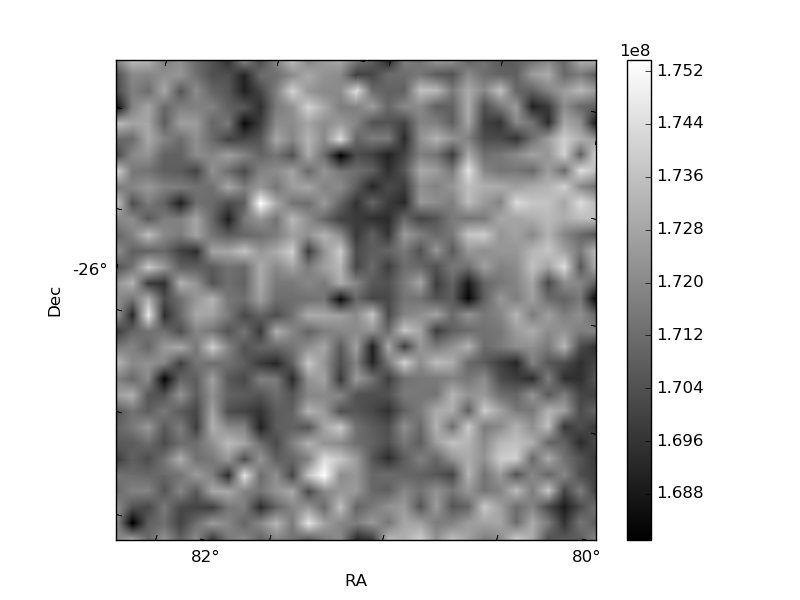
Histogram calculated using DETX and DETY for each event in the final _common_clean file
| Quadrant A |  |
 |
Quadrant B |
|---|---|---|---|
| Quadrant D | 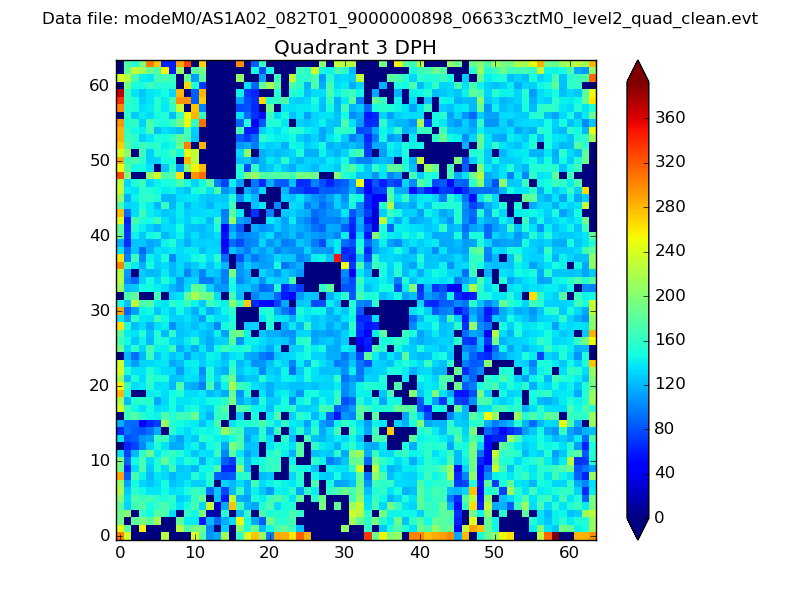 |
 |
Quadrant C |
| Plot type | Count rate plots | Images |
|---|---|---|
| Comparison with Poisson distribution Blue bars denote a histogram of data divided into 1 sec bins. Red curve is a Poisson curve with rate = median count rate of data. |
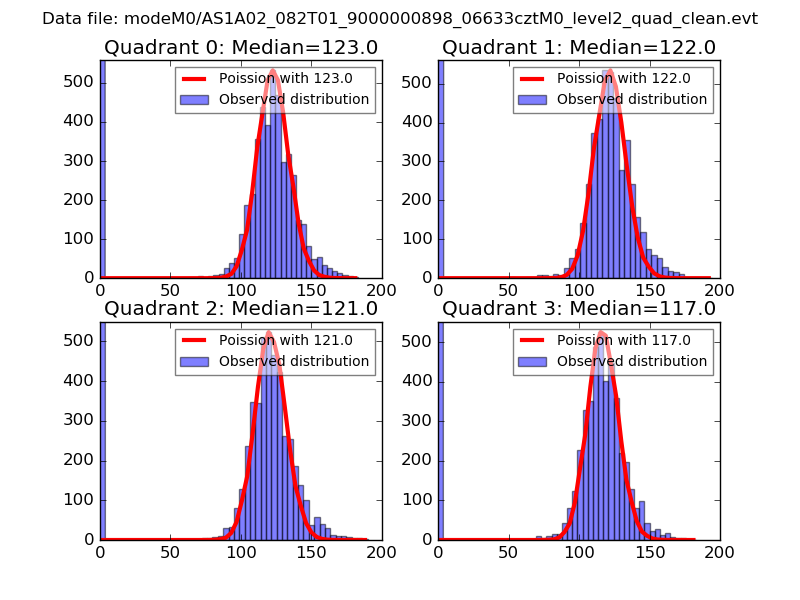 |
 |
| Quadrant-wise count rates Data is divided into 100 sec bins |
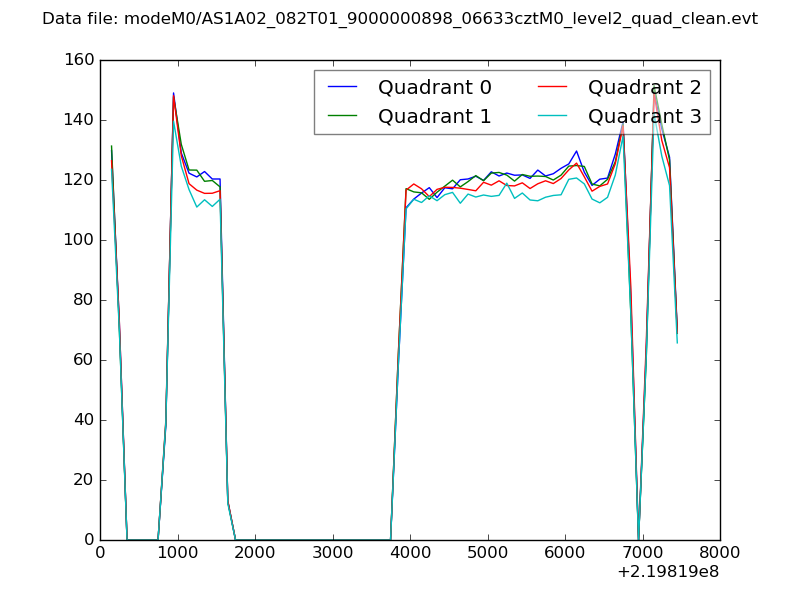 |
|
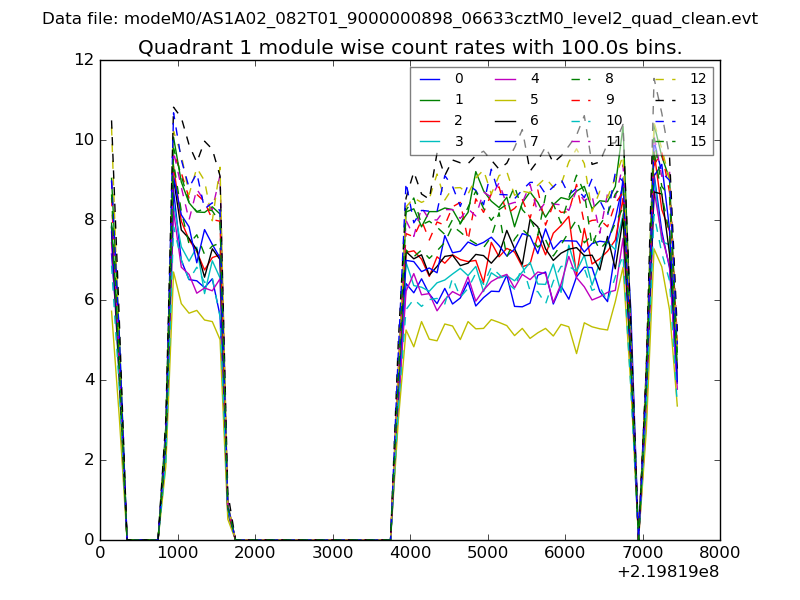
| Module-wise count rates for Quadrant A Data is divided into 100 sec bins |
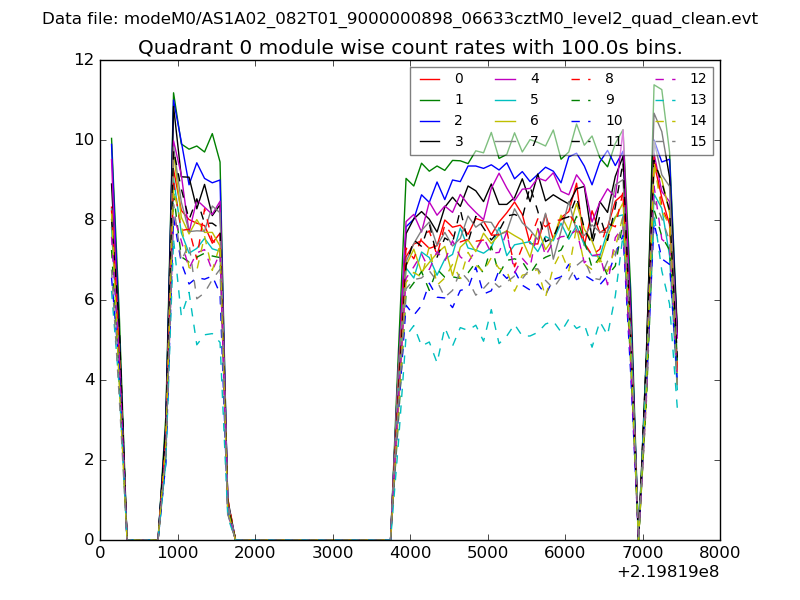 |
 |
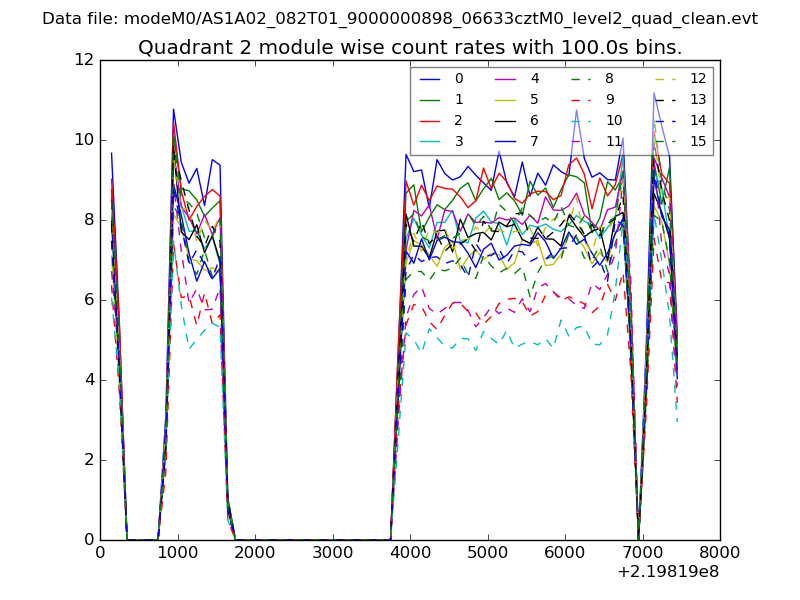
| Module-wise count rates for Quadrant B Data is divided into 100 sec bins |
 |
 |
| Module-wise count rates for Quadrant C Data is divided into 100 sec bins |
 |
 |
| Module-wise count rates for Quadrant D Data is divided into 100 sec bins |
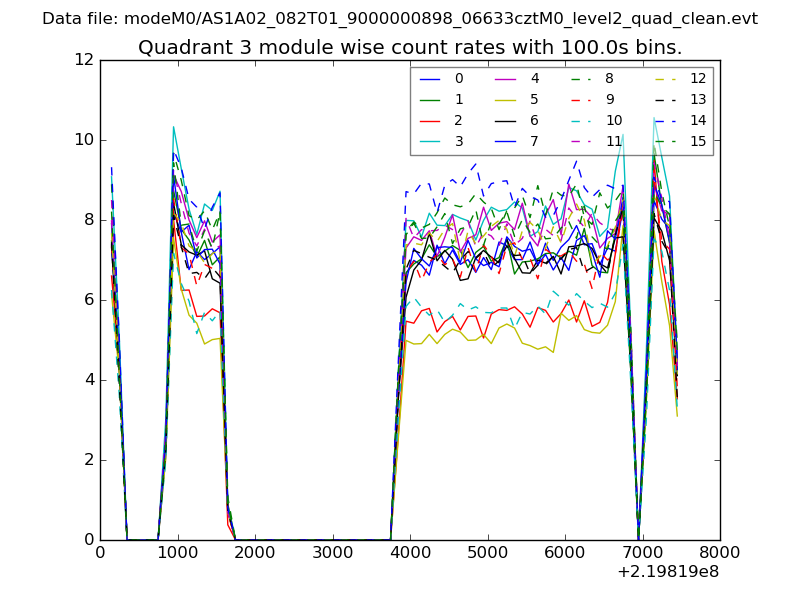 |
 |
| Parameter | Plot |
|---|---|
| CZT HV Monitor | 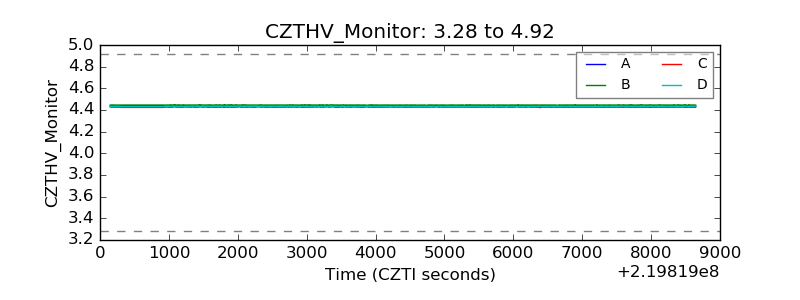 |
| D_VDD | 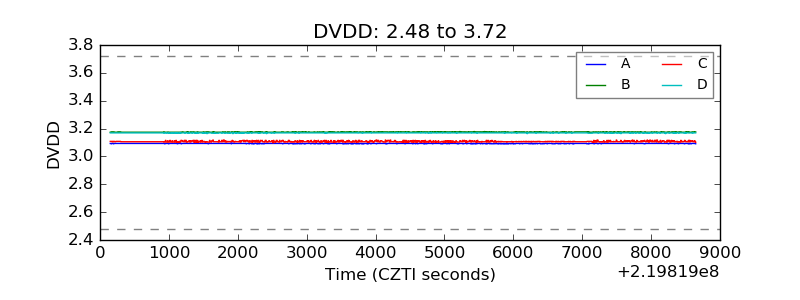 |
| Temperature 1 | 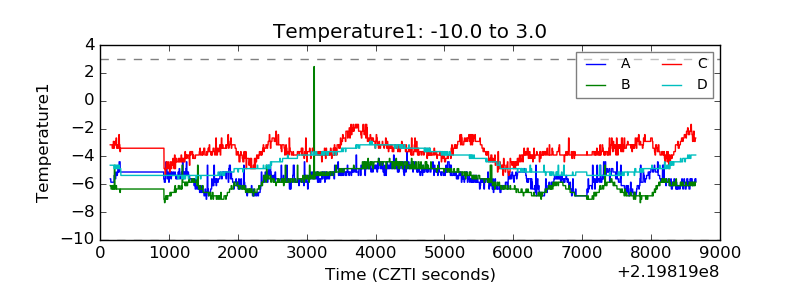 |
| Veto HV Monitor | 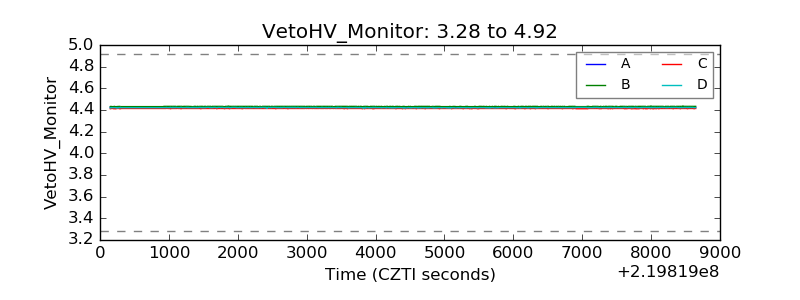 |
| Veto LLD | 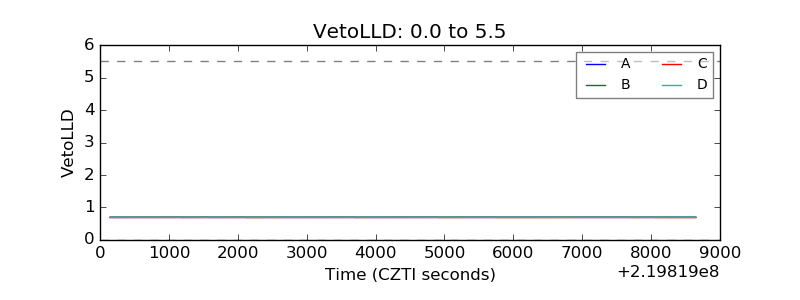 |
| Alpha Counter | 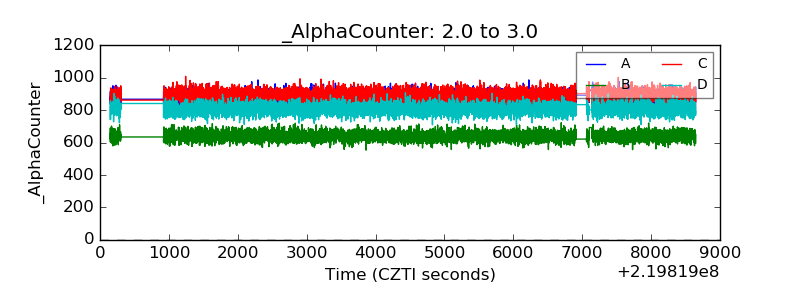 |
| _CPM_Rate | 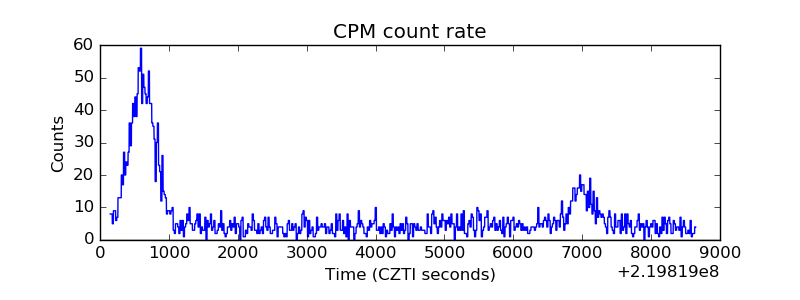 |
| CZT Counter | 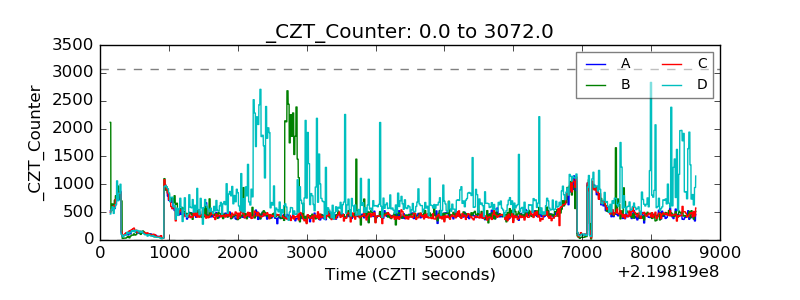 |
| +2.5 Volts monitor |  |
| +5 Volts monitor |  |
| _ROLL_ROT | 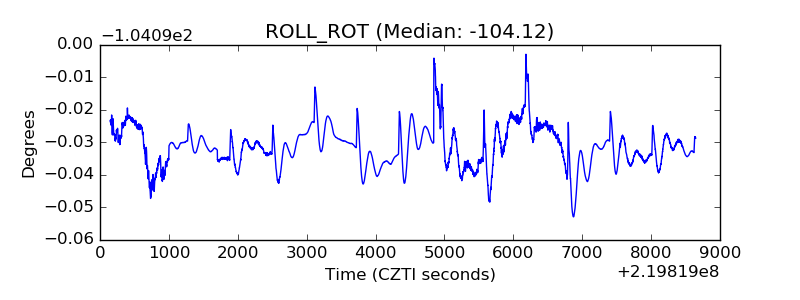 |
| _Roll_DEC | 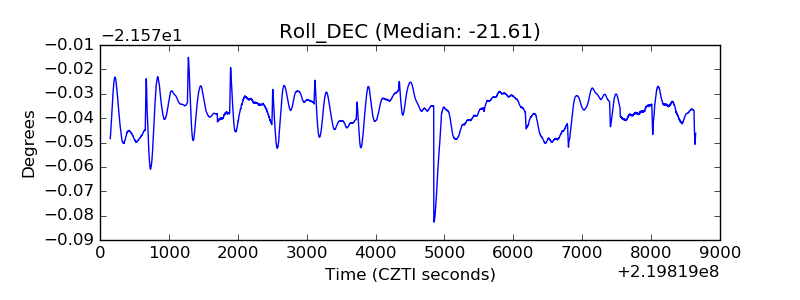 |
| _Roll_RA | 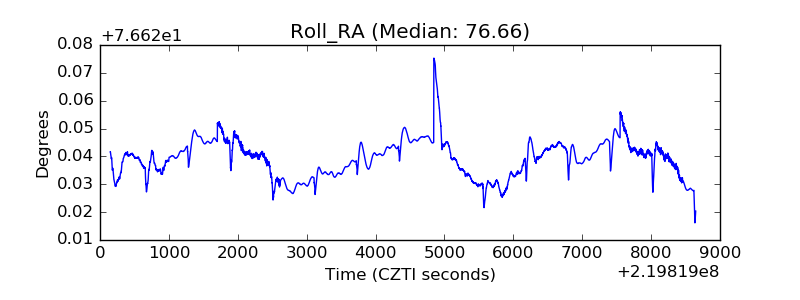 |
| Veto Counter | 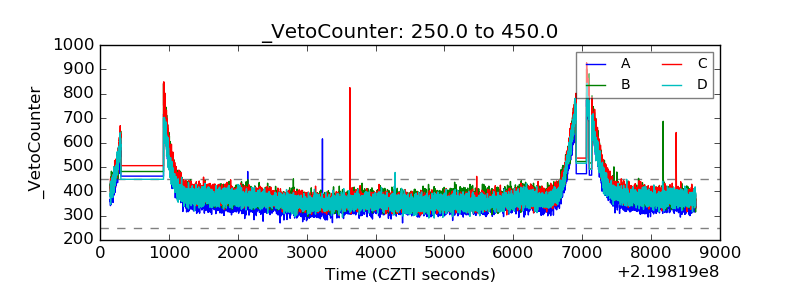 |