| Param | Original file | Final file |
|---|---|---|
| Filename | modeM0/AS1A02_082T01_9000000898_06637cztM0_level2.evt | modeM0/AS1A02_082T01_9000000898_06637cztM0_level2_quad_clean.evt |
| Size (bytes) | 195,557,760 | 11,750,400 |
| Size | 186.5 MB | 11.2 MB |
| Events in quadrant A | 1,340,910 | 40,376 |
| Events in quadrant B | 1,353,214 | 42,355 |
| Events in quadrant C | 1,347,030 | 43,685 |
| Events in quadrant D | 1,701,680 | 41,488 |
| Mode M0 | |||
|---|---|---|---|
| Quadrant | BADHDUFLAG | Total packets | Discarded packets |
| A | 0 | 5768 | 1 |
| B | 0 | 5805 | 0 |
| C | 0 | 5799 | 0 |
| D | 0 | 6826 | 0 |
| Mode SS | |||
|---|---|---|---|
| Quadrant | BADHDUFLAG | Total packets | Discarded packets |
| A | 0 | 52 | 0 |
| B | 0 | 52 | 0 |
| C | 0 | 52 | 0 |
| D | 0 | 52 | 0 |
| Quadrant | Total seconds | Saturated seconds | Saturation percentage |
|---|---|---|---|
| A | 2608 | 268 | 10.276074% |
| B | 2608 | 270 | 10.352761% |
| C | 2608 | 248 | 9.509202% |
| D | 2608 | 245 | 9.394172% |
Noise dominated data is calculated using 1-second bins in cleaned event files. If a bin has >2000 counts, and if more than 50% of those come from <1% of pixels, then it is considered to be noise-dominated and hence unusable.
| Quadrant | # 1 sec bins | Bins with >0 counts | Bins with >2000 counts | High rate bins dominated by noise | Noise dominated (total time) | Noise dominated (detector-on time) | Marked lightcurve |
|---|---|---|---|---|---|---|---|
| A | 2608 | 2608 | 0 | 0 | 0.00% | 0.00% |  |
| B | 2608 | 2608 | 2 | 2 | 0.08% | 0.08% | 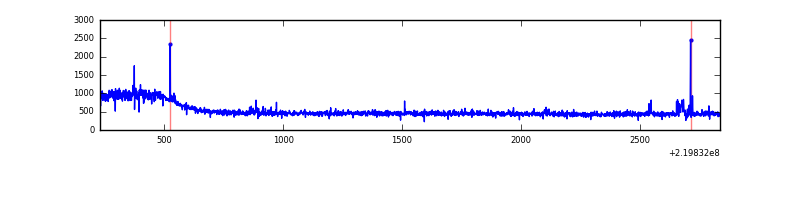 |
| C | 2608 | 2608 | 0 | 0 | 0.00% | 0.00% | 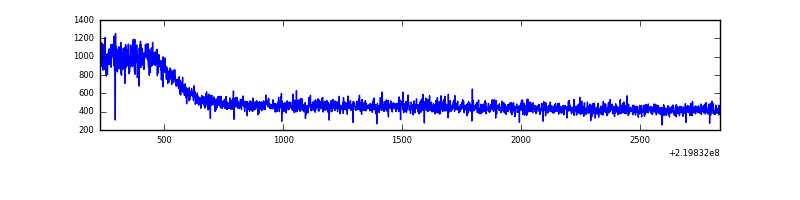 |
| D | 2608 | 2608 | 1 | 1 | 0.04% | 0.04% | 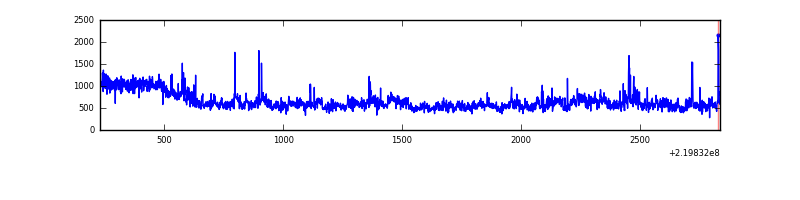 |
Top three noisy pixels from each quadrant. If the there are fewer than three noisy pixels in the level2.evt file, extra rows are filled as -1
| Pixel properties | Quadrant properties | ||||||
|---|---|---|---|---|---|---|---|
| Quadrant | DetID | PixID | Counts | Sigma | Mean | Median | Sigma |
| A | 14 | 111 | 26927 | 360.47 | 340 | 331 | 73.8 |
| A | 0 | 226 | 3191 | 38.76 | 340 | 331 | 73.8 |
| A | 12 | 194 | 3118 | 37.77 | 340 | 331 | 73.8 |
| B | 0 | 219 | 21616 | 301.64 | 340 | 330 | 70.6 |
| B | 12 | 111 | 7570 | 102.6 | 340 | 330 | 70.6 |
| B | 11 | 111 | 6187 | 83.0 | 340 | 330 | 70.6 |
| C | 8 | 128 | 7602 | 86.8 | 341 | 341 | 83.7 |
| C | 8 | 144 | 3092 | 32.89 | 341 | 341 | 83.7 |
| C | 8 | 112 | 3045 | 32.32 | 341 | 341 | 83.7 |
| D | 8 | 195 | 392904 | 4574.76 | 339 | 328 | 85.8 |
| D | 2 | 33 | 21858 | 250.89 | 339 | 328 | 85.8 |
| D | 2 | 14 | 8196 | 91.69 | 339 | 328 | 85.8 |
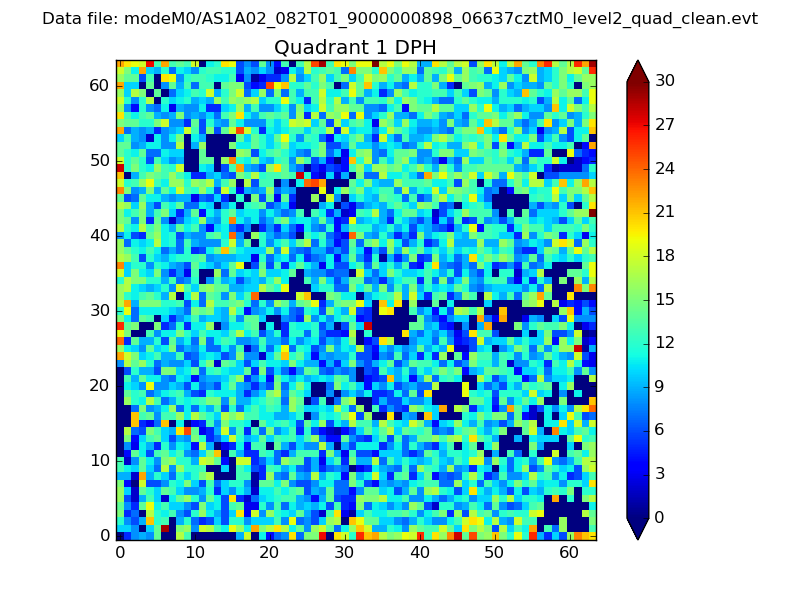
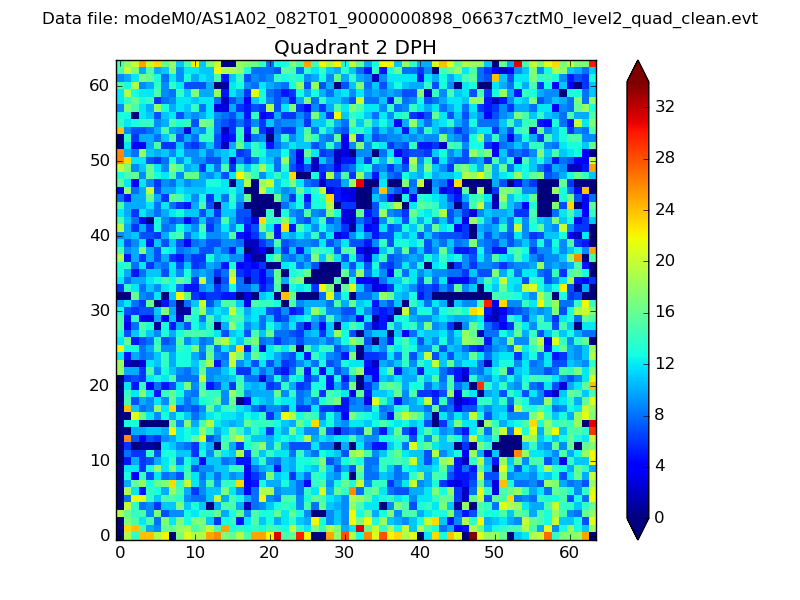
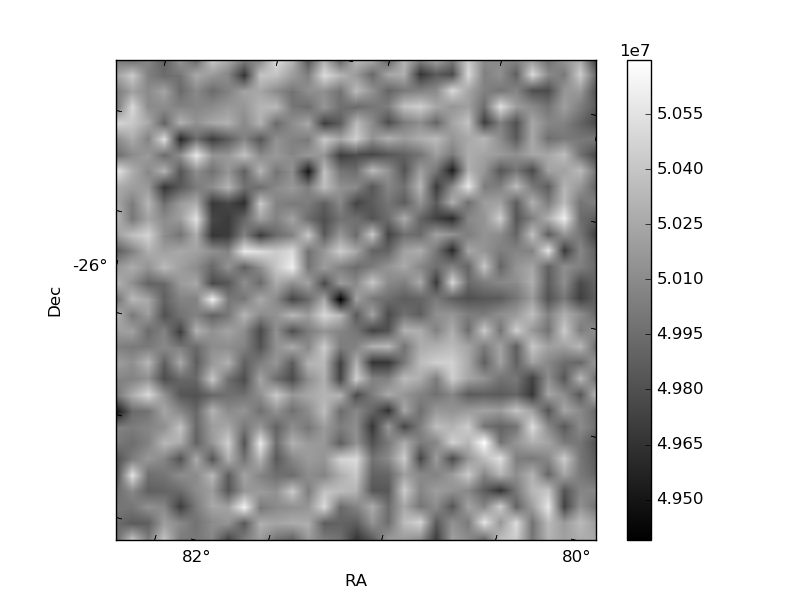
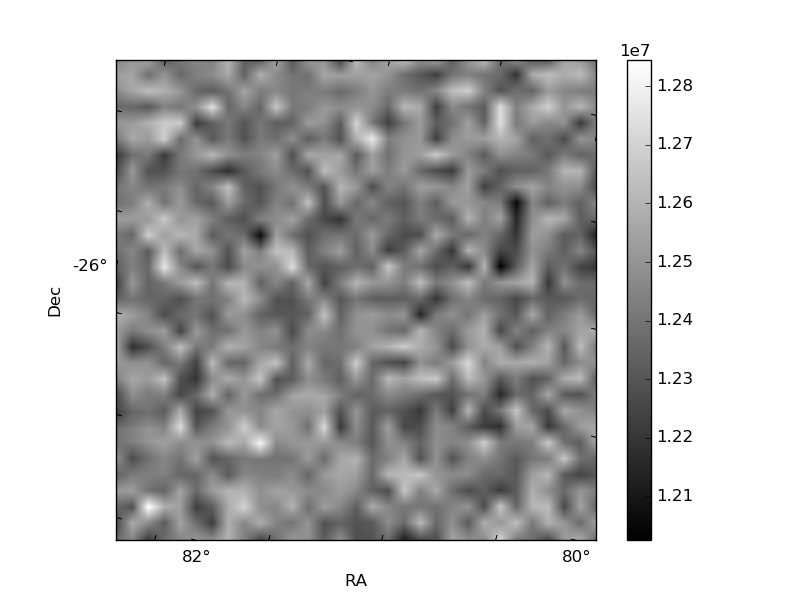
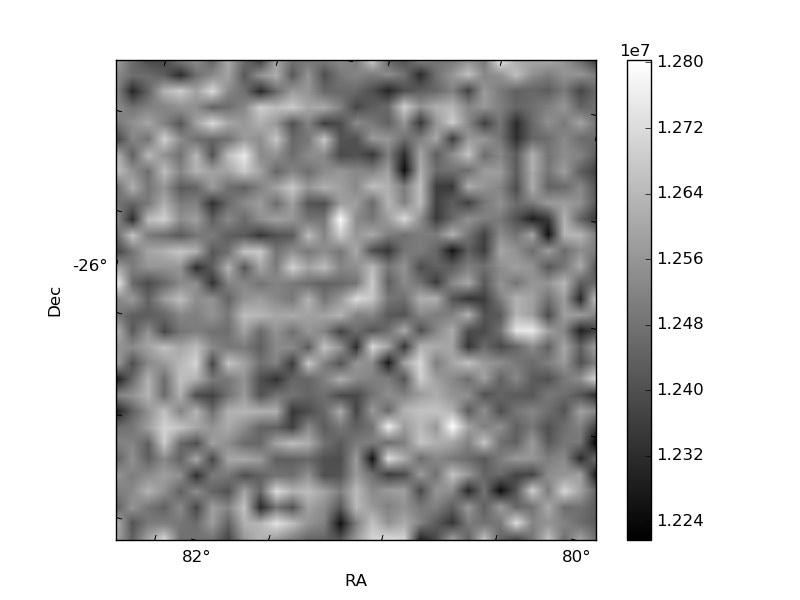
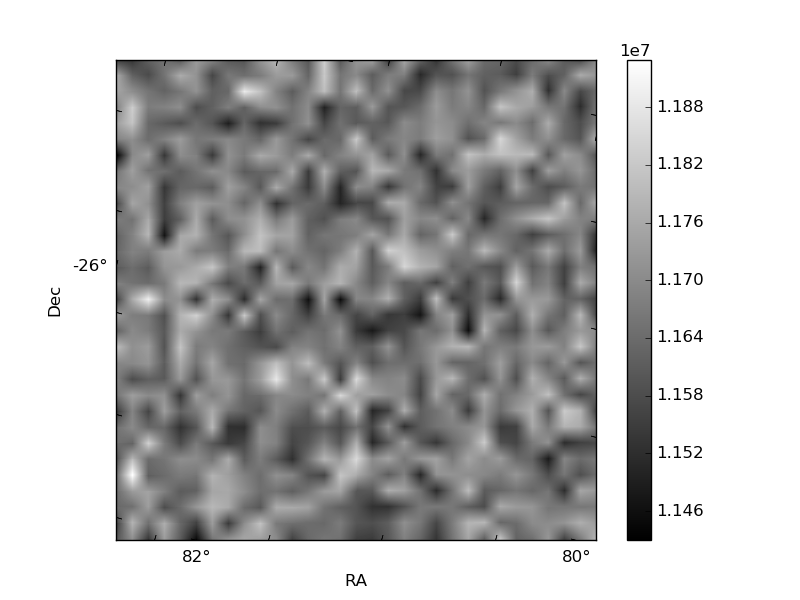
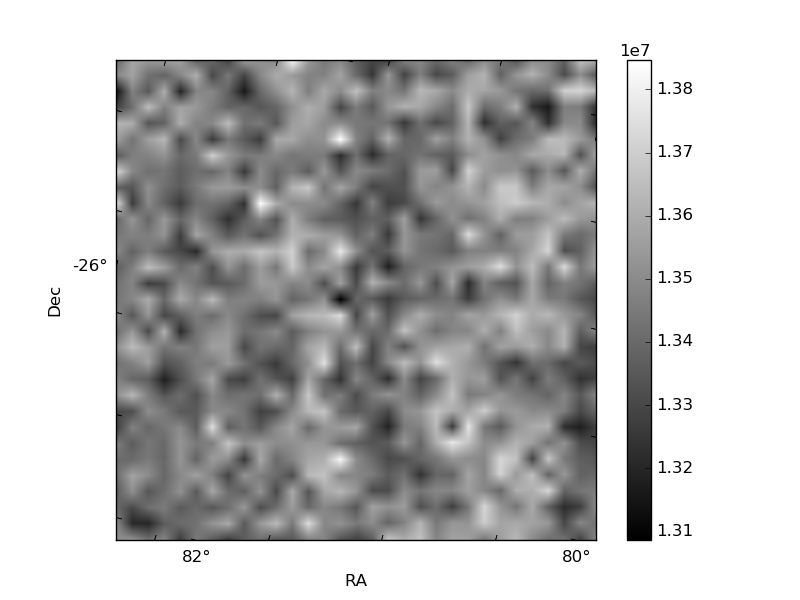
Histogram calculated using DETX and DETY for each event in the final _common_clean file
| Quadrant A | 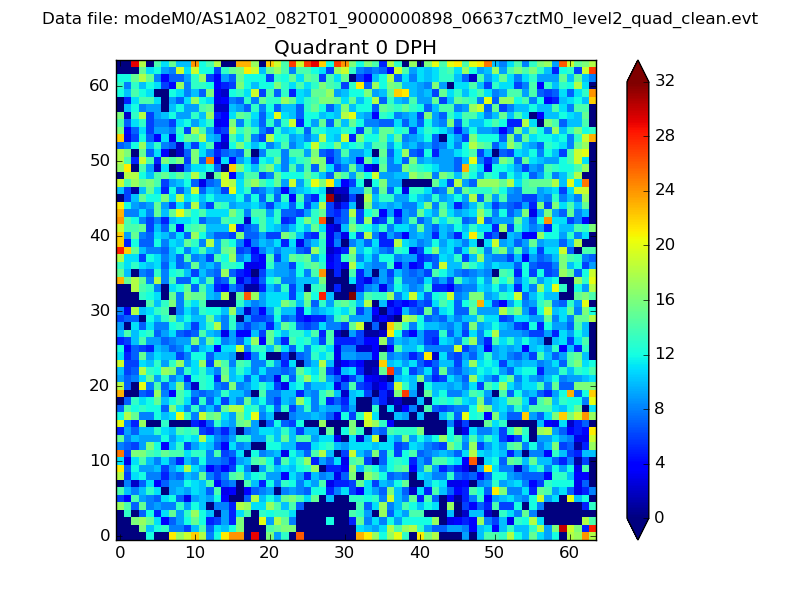 |
 |
Quadrant B |
|---|---|---|---|
| Quadrant D | 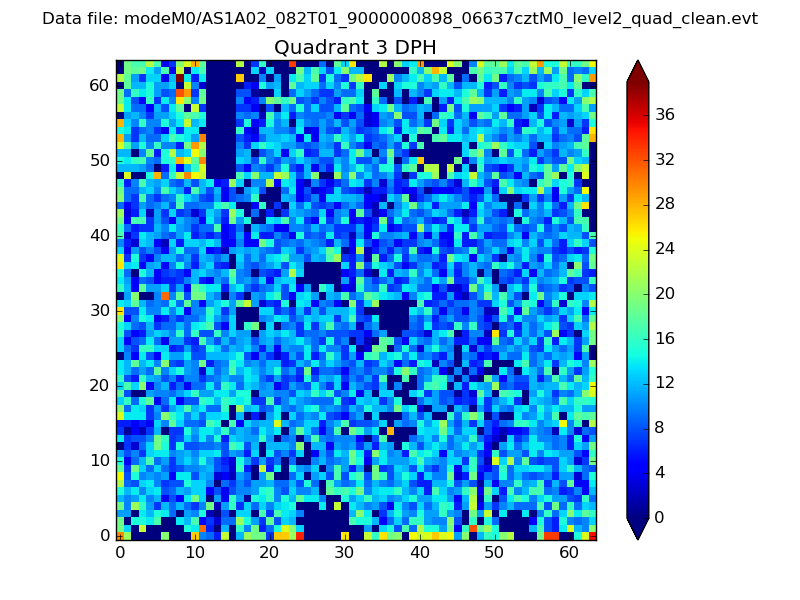 |
 |
Quadrant C |
| Plot type | Count rate plots | Images |
|---|---|---|
| Comparison with Poisson distribution Blue bars denote a histogram of data divided into 1 sec bins. Red curve is a Poisson curve with rate = median count rate of data. |
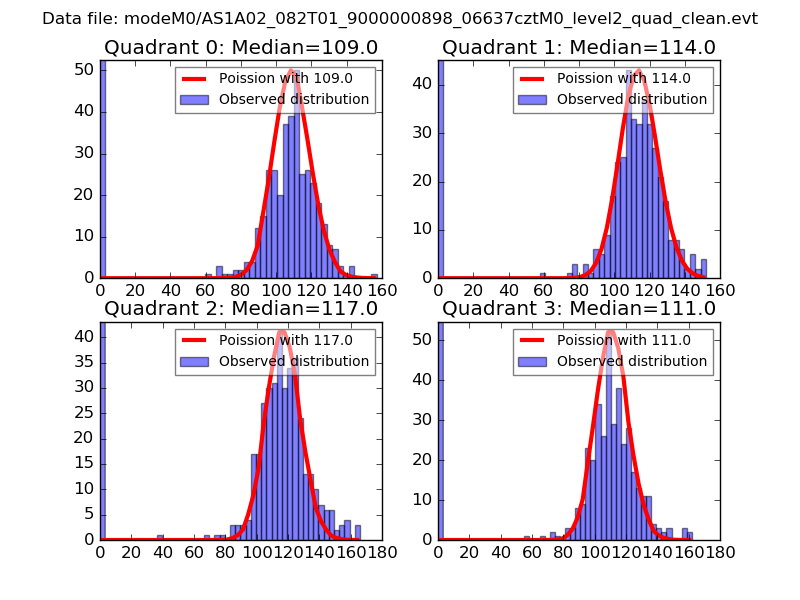 |
 |
| Quadrant-wise count rates Data is divided into 100 sec bins |
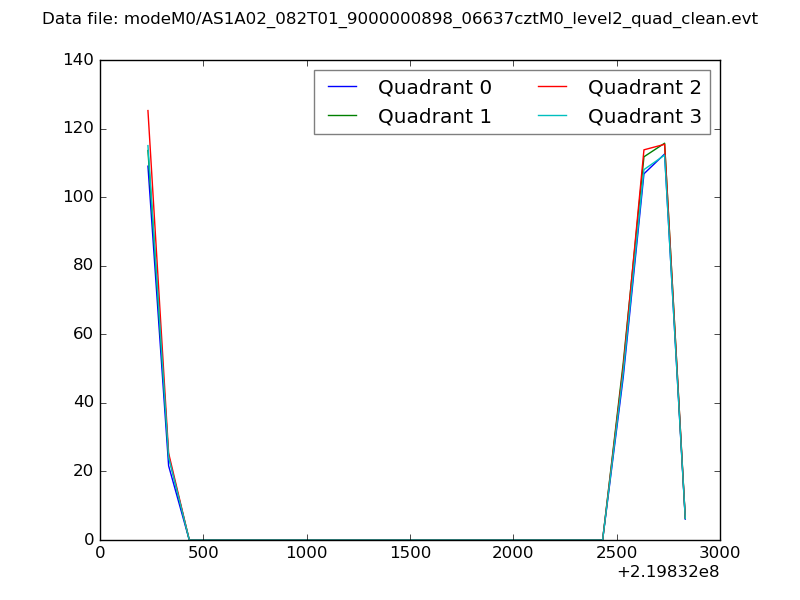 |
|
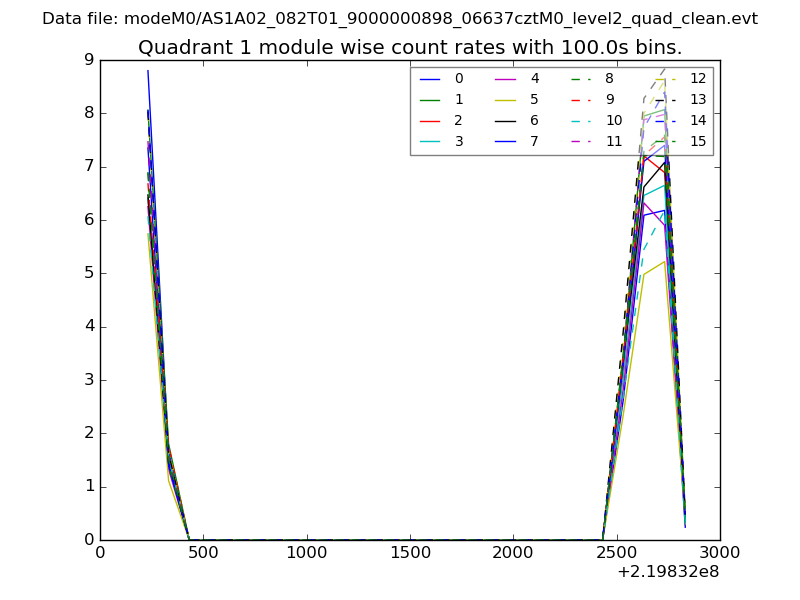
| Module-wise count rates for Quadrant A Data is divided into 100 sec bins |
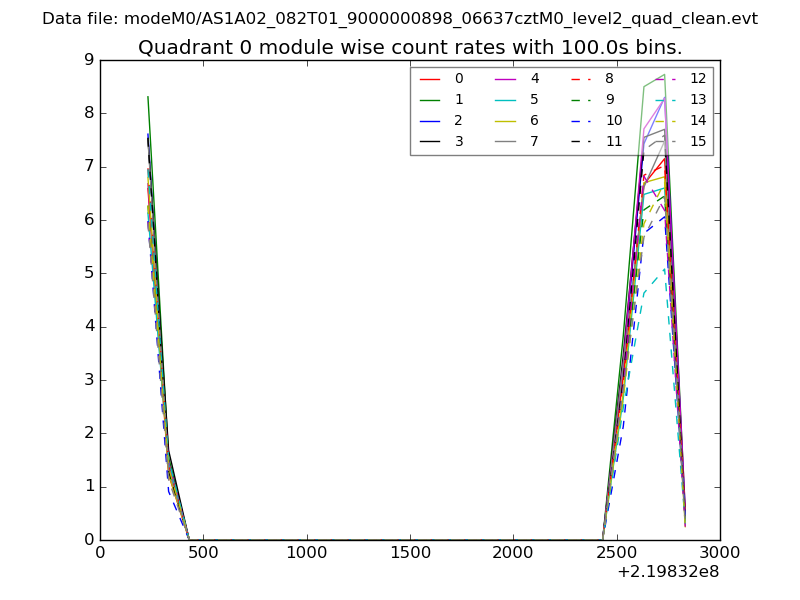 |
 |
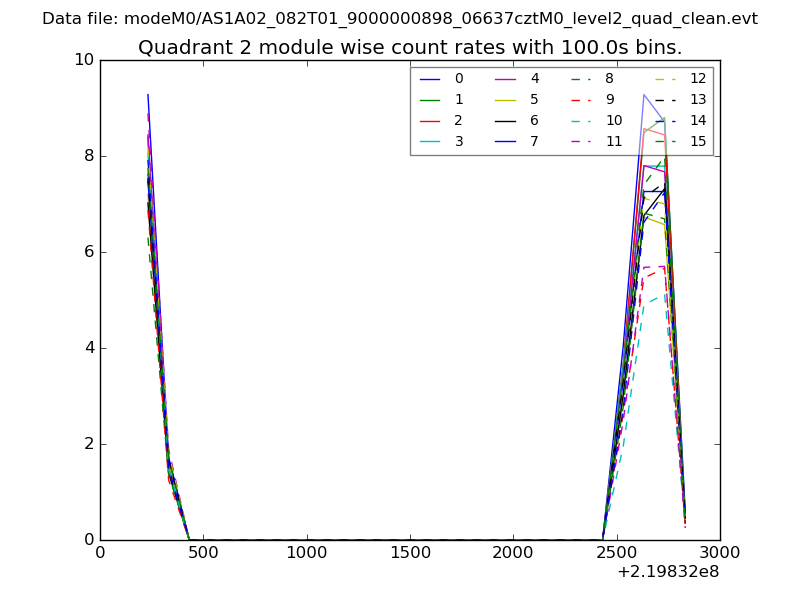
| Module-wise count rates for Quadrant B Data is divided into 100 sec bins |
 |
 |
| Module-wise count rates for Quadrant C Data is divided into 100 sec bins |
 |
 |
| Module-wise count rates for Quadrant D Data is divided into 100 sec bins |
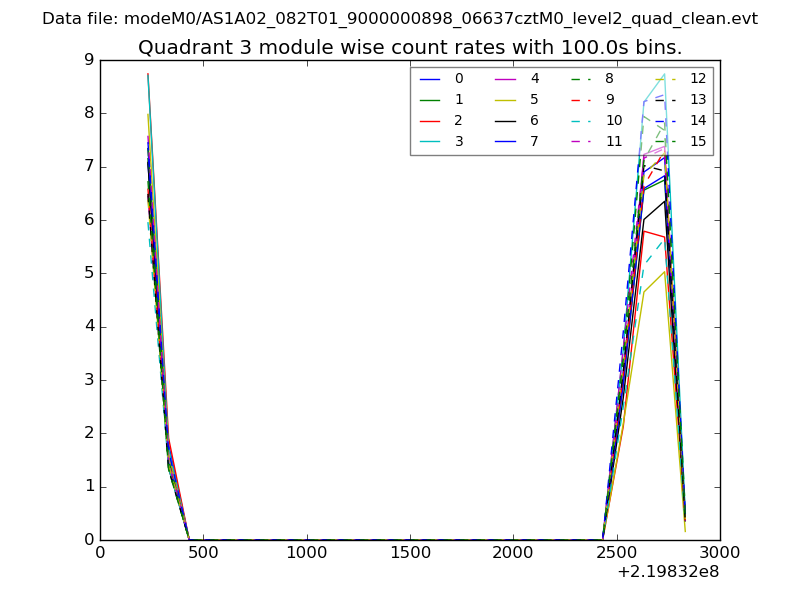 |
 |
| Parameter | Plot |
|---|---|
| CZT HV Monitor | 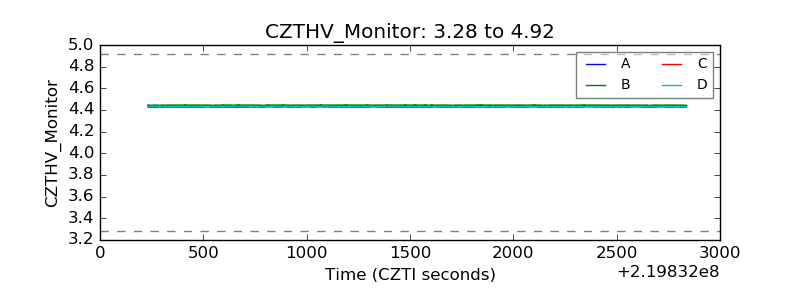 |
| D_VDD | 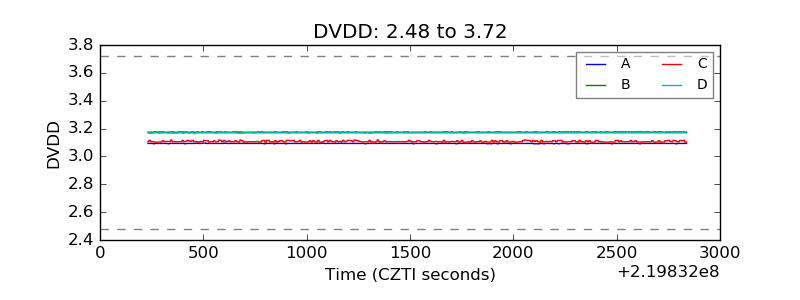 |
| Temperature 1 | 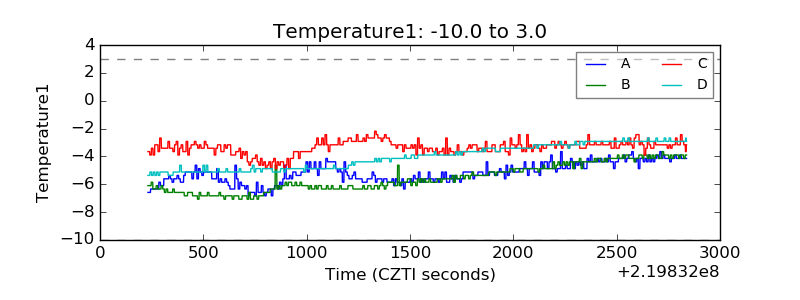 |
| Veto HV Monitor | 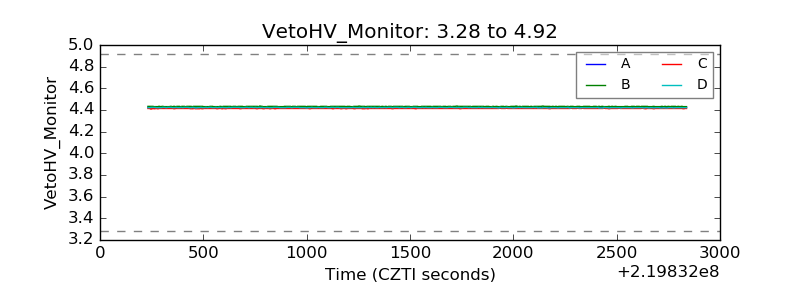 |
| Veto LLD | 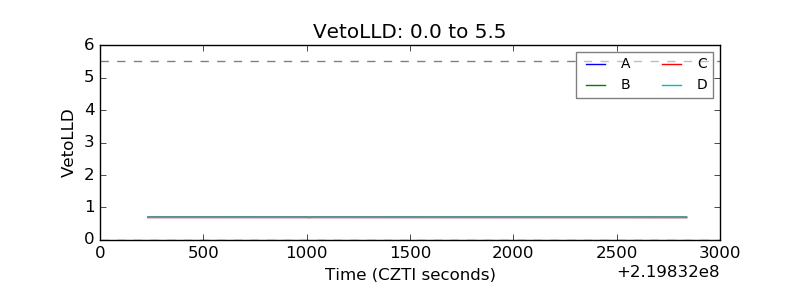 |
| Alpha Counter | 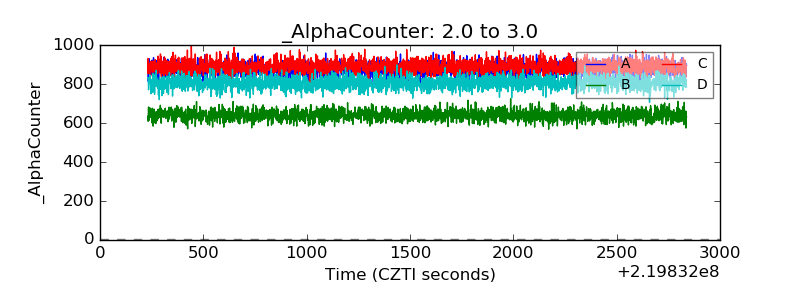 |
| _CPM_Rate | 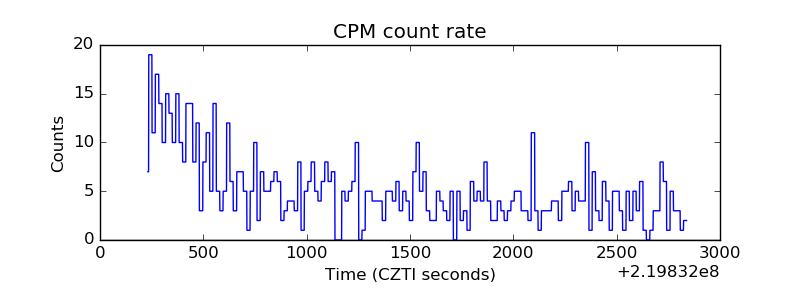 |
| CZT Counter | 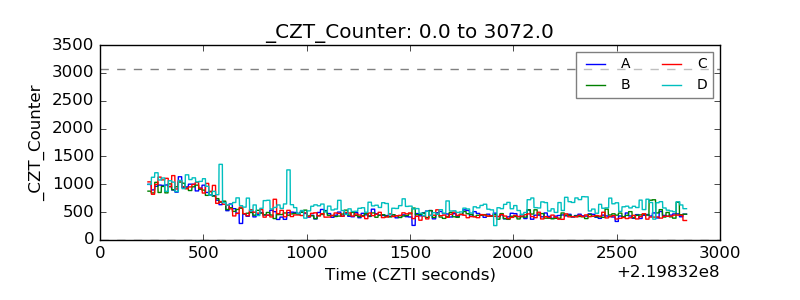 |
| +2.5 Volts monitor |  |
| +5 Volts monitor |  |
| _ROLL_ROT | 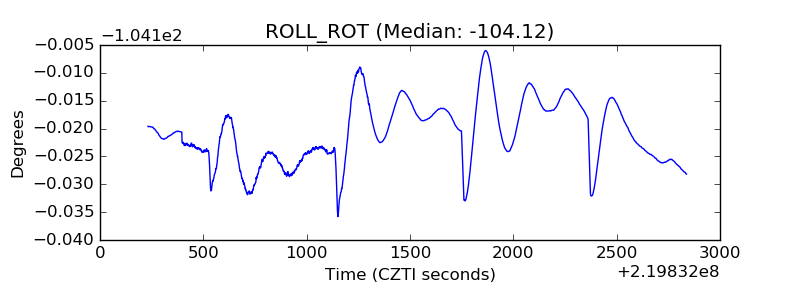 |
| _Roll_DEC | 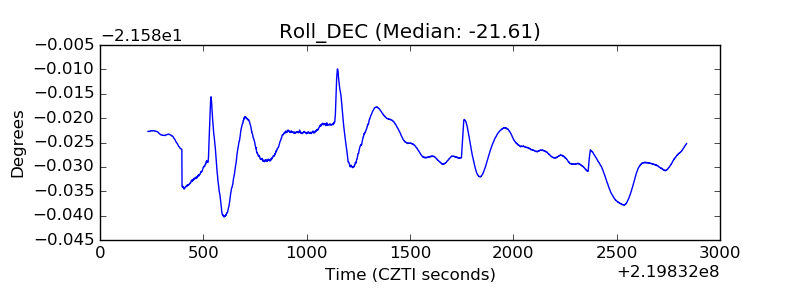 |
| _Roll_RA | 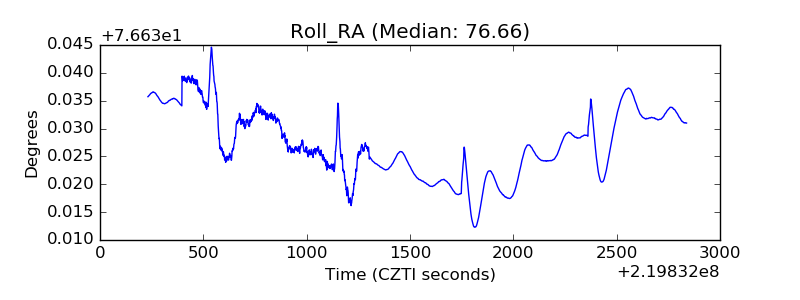 |
| Veto Counter | 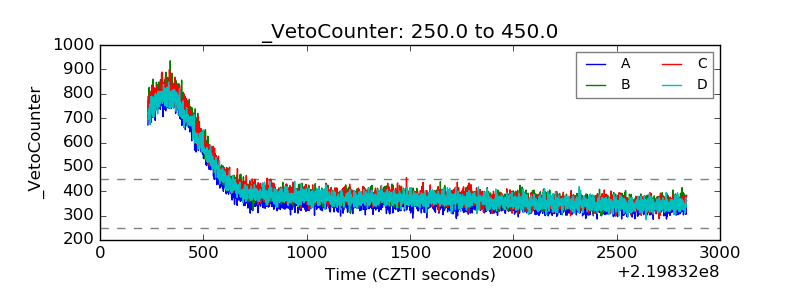 |