| Param | Original file | Final file |
|---|---|---|
| Filename | modeM0/AS1A02_082T01_9000000898_06638cztM0_level2.evt | modeM0/AS1A02_082T01_9000000898_06638cztM0_level2_quad_clean.evt |
| Size (bytes) | 536,472,000 | 91,111,680 |
| Size | 511.6 MB | 86.9 MB |
| Events in quadrant A | 3,541,340 | 564,536 |
| Events in quadrant B | 3,770,333 | 559,166 |
| Events in quadrant C | 3,463,801 | 556,763 |
| Events in quadrant D | 4,946,010 | 540,325 |
| Mode M9 | |||
|---|---|---|---|
| Quadrant | BADHDUFLAG | Total packets | Discarded packets |
| A | 0 | 3 | 0 |
| B | 0 | 3 | 0 |
| C | 0 | 3 | 0 |
| D | 0 | 3 | 0 |
| Mode M0 | |||
|---|---|---|---|
| Quadrant | BADHDUFLAG | Total packets | Discarded packets |
| A | 0 | 15940 | 1 |
| B | 0 | 16517 | 1 |
| C | 0 | 15899 | 1 |
| D | 0 | 20190 | 1 |
| Mode SS | |||
|---|---|---|---|
| Quadrant | BADHDUFLAG | Total packets | Discarded packets |
| A | 0 | 156 | 0 |
| B | 0 | 156 | 0 |
| C | 0 | 156 | 0 |
| D | 0 | 156 | 0 |
| Quadrant | Total seconds | Saturated seconds | Saturation percentage |
|---|---|---|---|
| A | 7742 | 193 | 2.492896% |
| B | 7742 | 228 | 2.944975% |
| C | 7742 | 153 | 1.976234% |
| D | 7742 | 192 | 2.479979% |
Noise dominated data is calculated using 1-second bins in cleaned event files. If a bin has >2000 counts, and if more than 50% of those come from <1% of pixels, then it is considered to be noise-dominated and hence unusable.
| Quadrant | # 1 sec bins | Bins with >0 counts | Bins with >2000 counts | High rate bins dominated by noise | Noise dominated (total time) | Noise dominated (detector-on time) | Marked lightcurve |
|---|---|---|---|---|---|---|---|
| A | 8032 | 7744 | 0 | 0 | 0.00% | 0.00% | 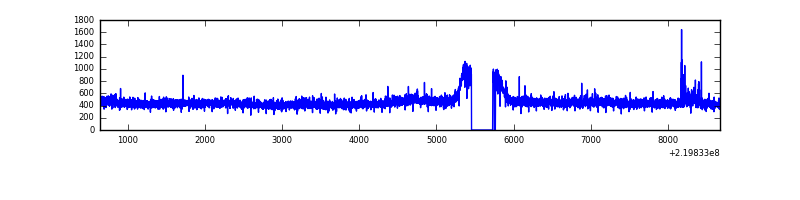 |
| B | 8032 | 7744 | 28 | 28 | 0.35% | 0.36% | 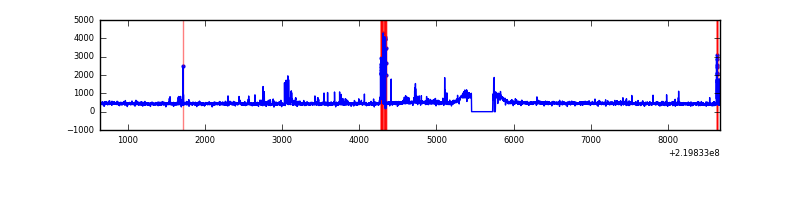 |
| C | 8032 | 7744 | 0 | 0 | 0.00% | 0.00% | 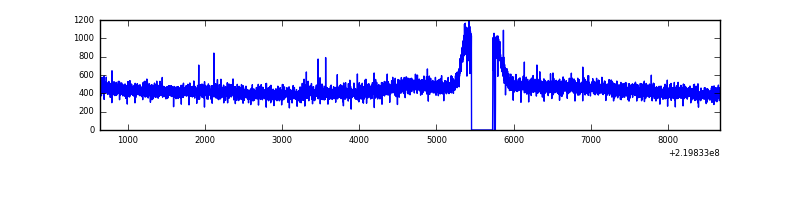 |
| D | 8032 | 7744 | 29 | 29 | 0.36% | 0.37% | 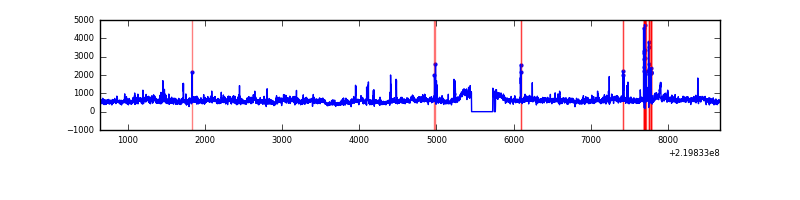 |
Top three noisy pixels from each quadrant. If the there are fewer than three noisy pixels in the level2.evt file, extra rows are filled as -1
| Pixel properties | Quadrant properties | ||||||
|---|---|---|---|---|---|---|---|
| Quadrant | DetID | PixID | Counts | Sigma | Mean | Median | Sigma |
| A | 15 | 239 | 29164 | 151.9 | 903 | 881 | 186.2 |
| A | 14 | 111 | 20682 | 106.35 | 903 | 881 | 186.2 |
| A | 0 | 226 | 8450 | 40.65 | 903 | 881 | 186.2 |
| B | 4 | 48 | 111821 | 621.28 | 902 | 879 | 178.6 |
| B | 0 | 219 | 76235 | 421.99 | 902 | 879 | 178.6 |
| B | 4 | 81 | 67016 | 370.37 | 902 | 879 | 178.6 |
| C | 8 | 128 | 22486 | 104.35 | 877 | 882 | 207.0 |
| C | 8 | 112 | 8866 | 38.56 | 877 | 882 | 207.0 |
| C | 8 | 144 | 8510 | 36.84 | 877 | 882 | 207.0 |
| D | 8 | 195 | 1433151 | 6682.8 | 878 | 851 | 214.3 |
| D | 2 | 16 | 75689 | 349.18 | 878 | 851 | 214.3 |
| D | 1 | 18 | 56497 | 259.63 | 878 | 851 | 214.3 |
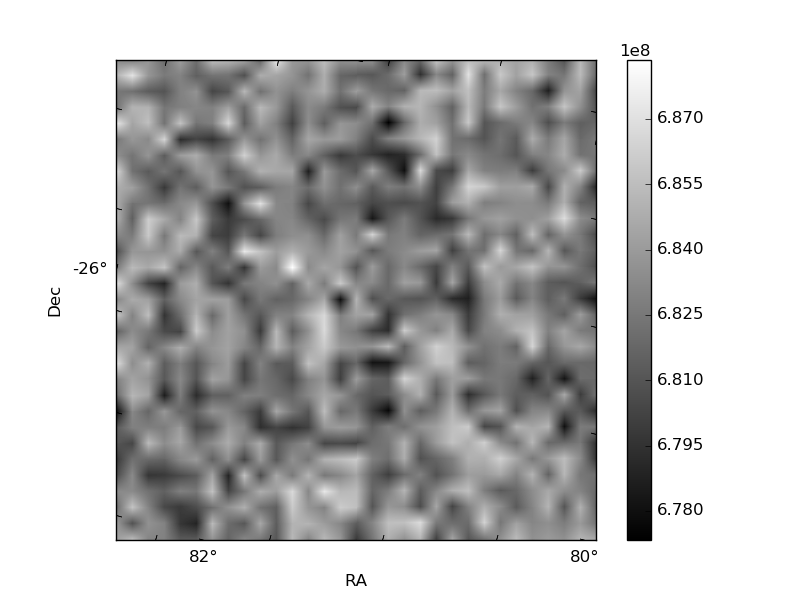
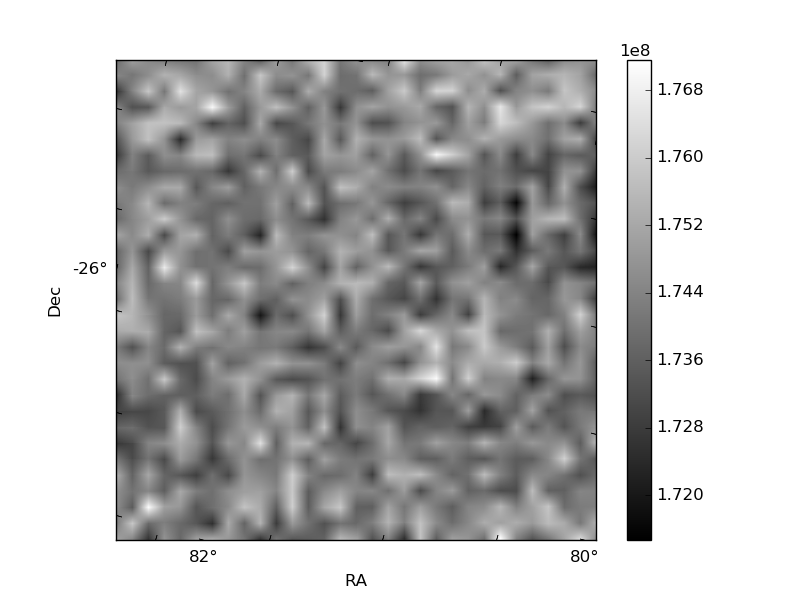
Histogram calculated using DETX and DETY for each event in the final _common_clean file
| Quadrant A | 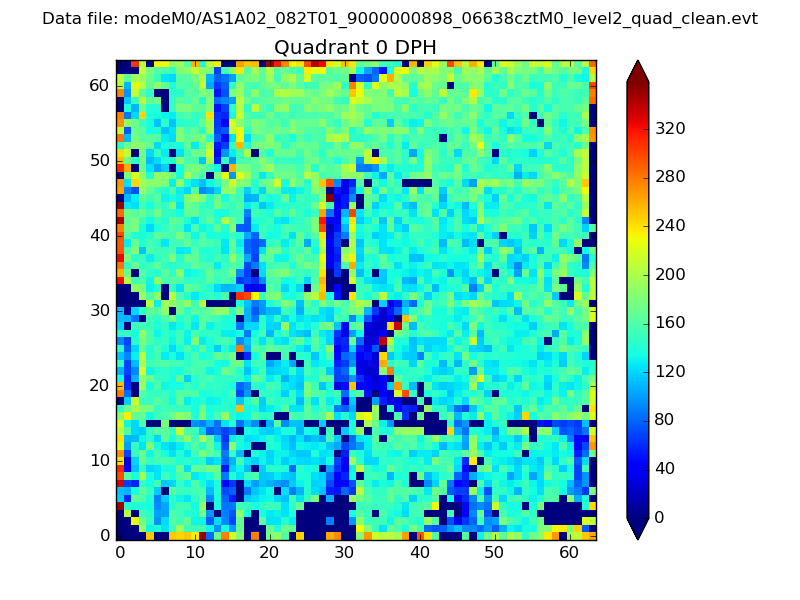 |
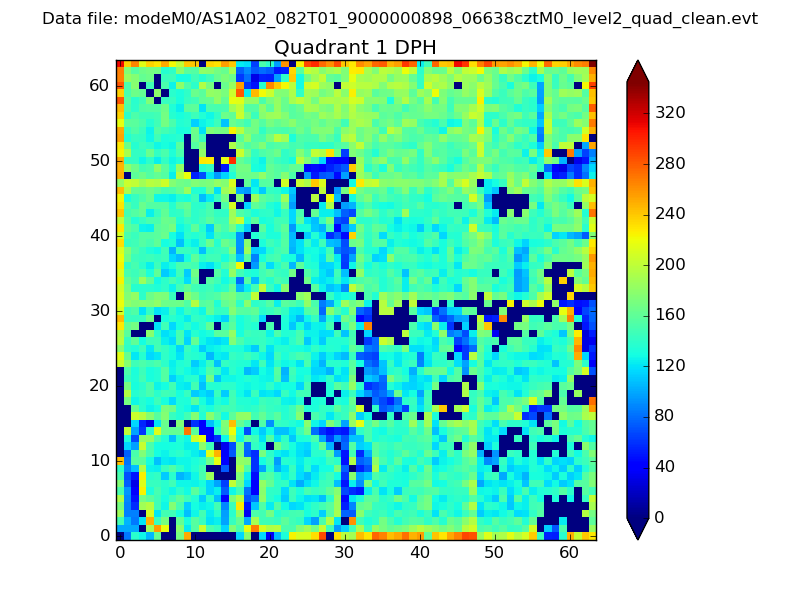 |
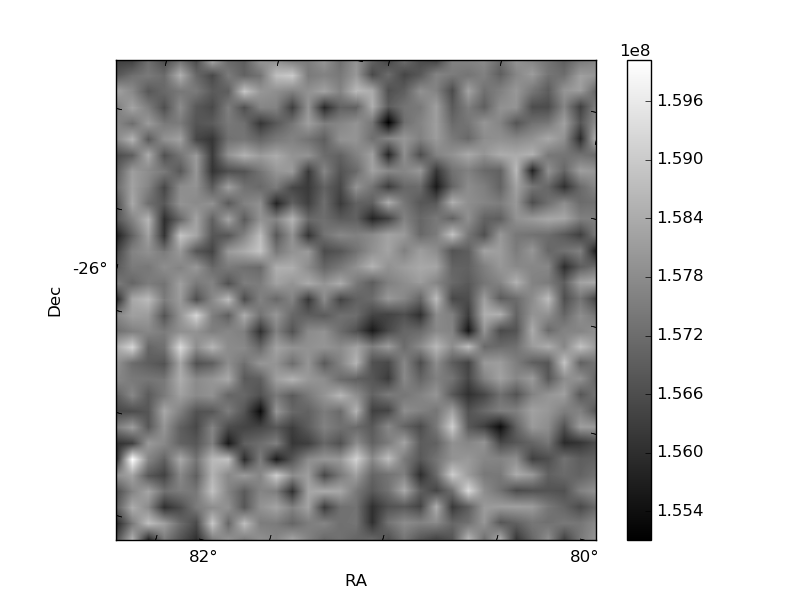
Quadrant B |
|---|---|---|---|
| Quadrant D | 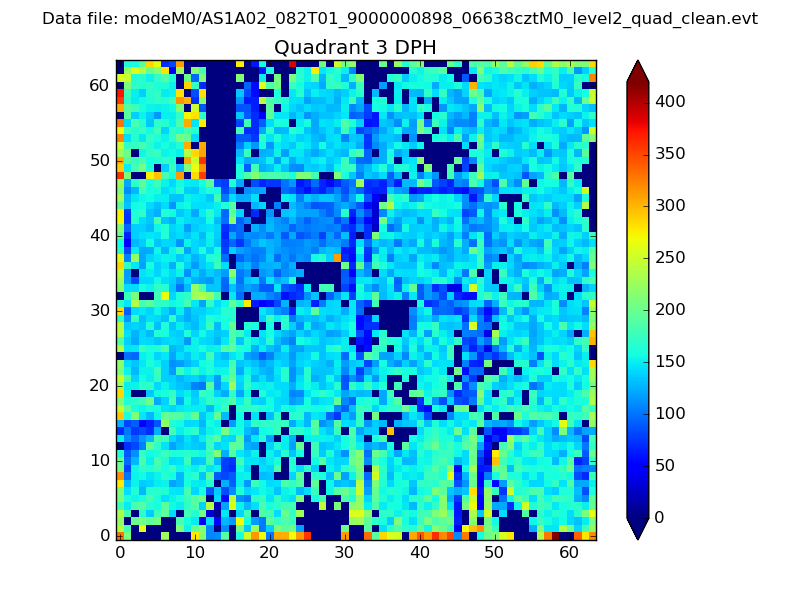 |
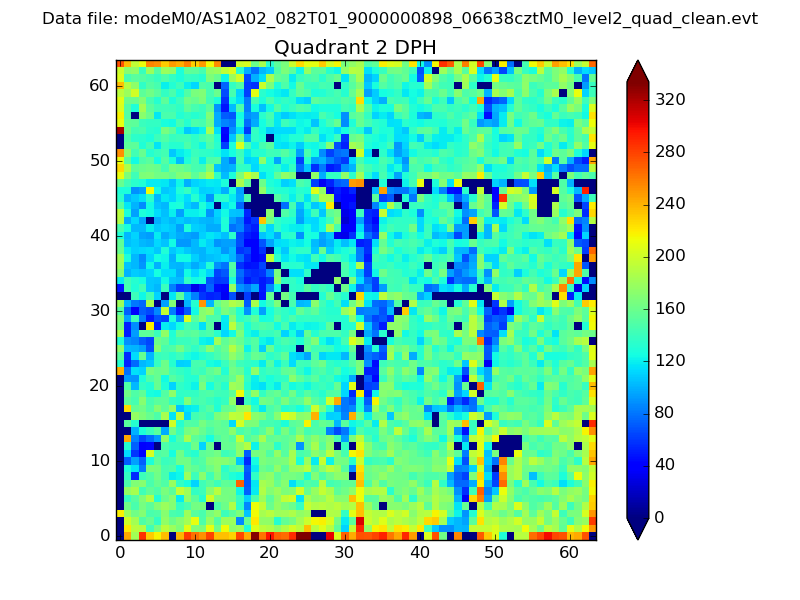 |
Quadrant C |
| Plot type | Count rate plots | Images |
|---|---|---|
| Comparison with Poisson distribution Blue bars denote a histogram of data divided into 1 sec bins. Red curve is a Poisson curve with rate = median count rate of data. |
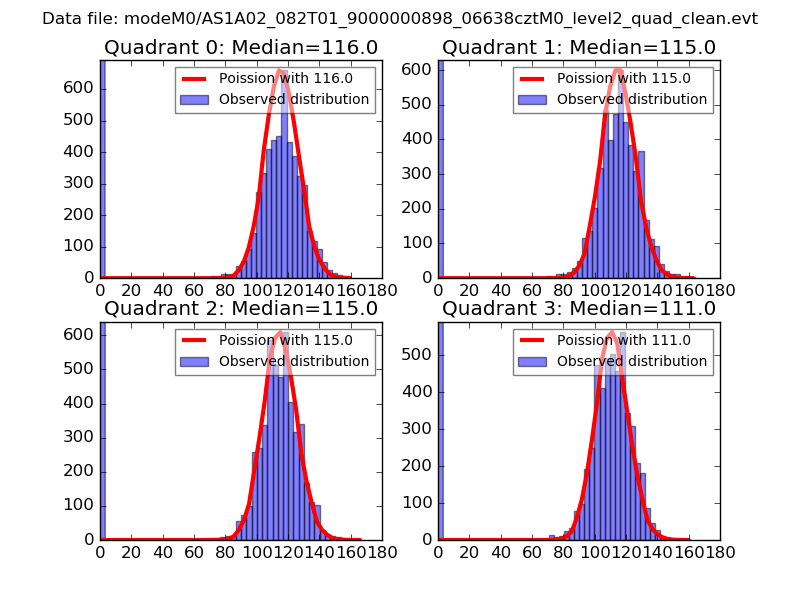 |
 |
| Quadrant-wise count rates Data is divided into 100 sec bins |
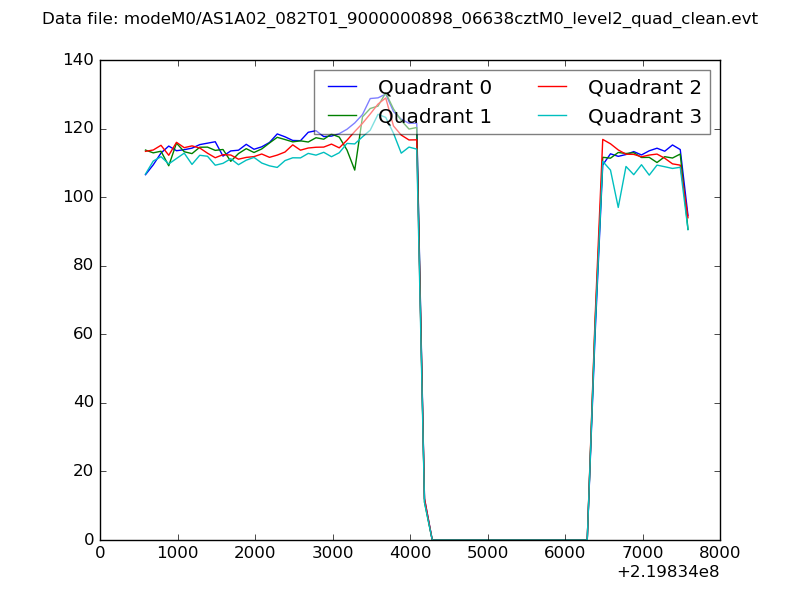 |
|
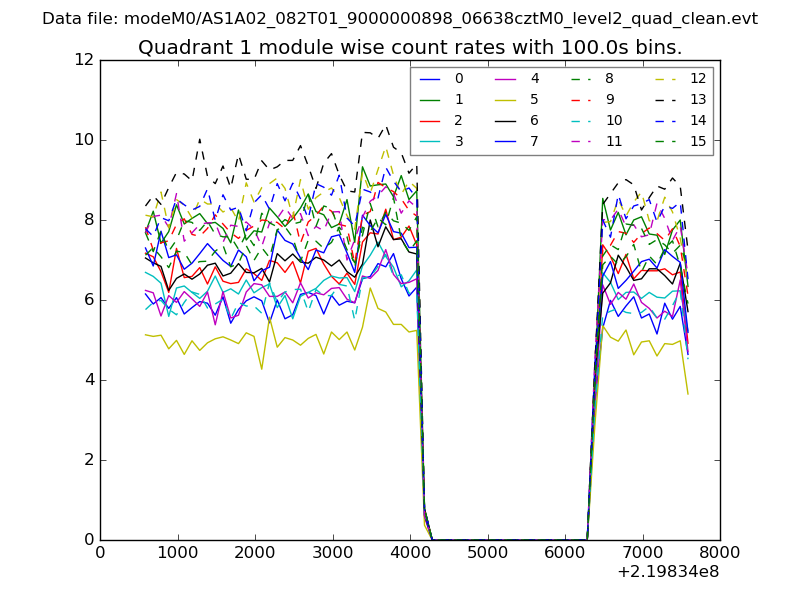
| Module-wise count rates for Quadrant A Data is divided into 100 sec bins |
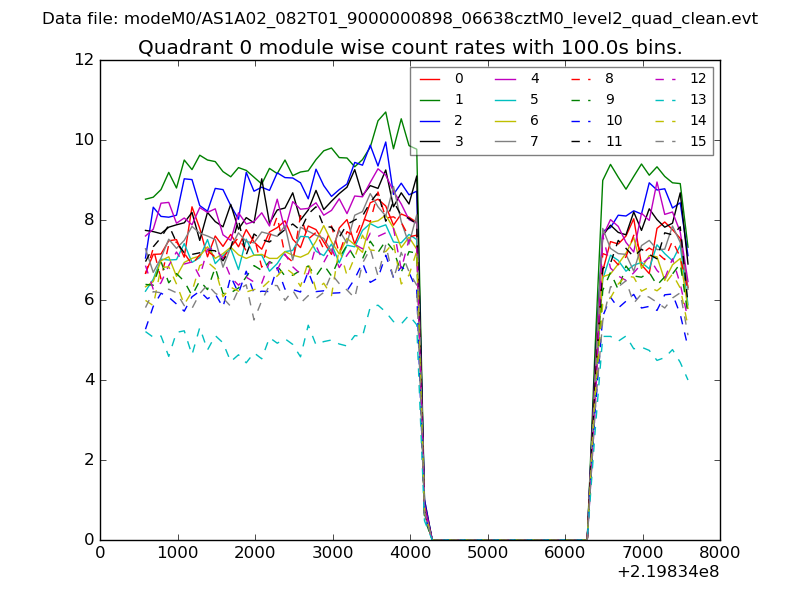 |
 |
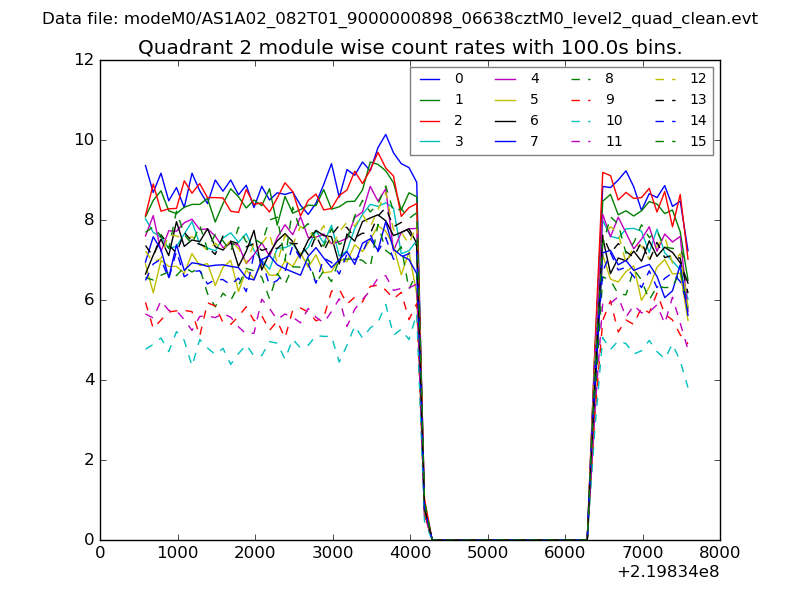
| Module-wise count rates for Quadrant B Data is divided into 100 sec bins |
 |
 |
| Module-wise count rates for Quadrant C Data is divided into 100 sec bins |
 |
 |
| Module-wise count rates for Quadrant D Data is divided into 100 sec bins |
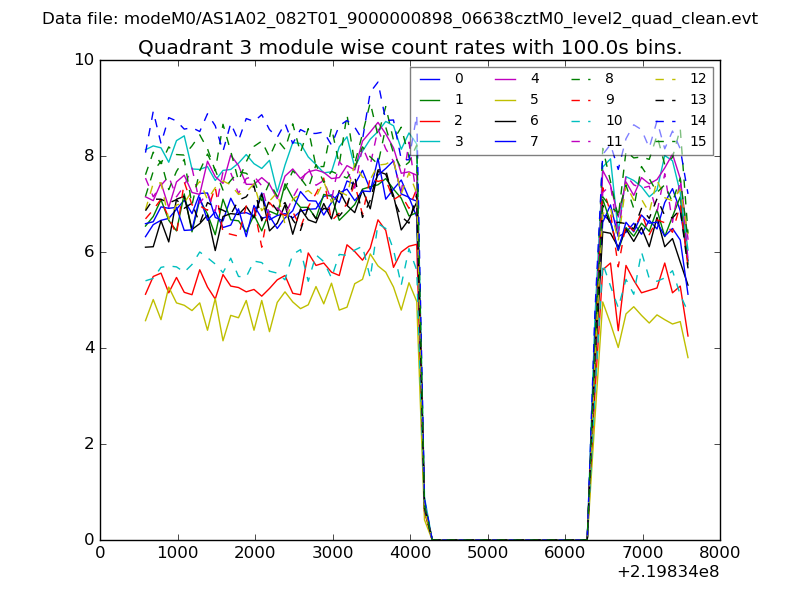 |
 |
| Parameter | Plot |
|---|---|
| CZT HV Monitor | 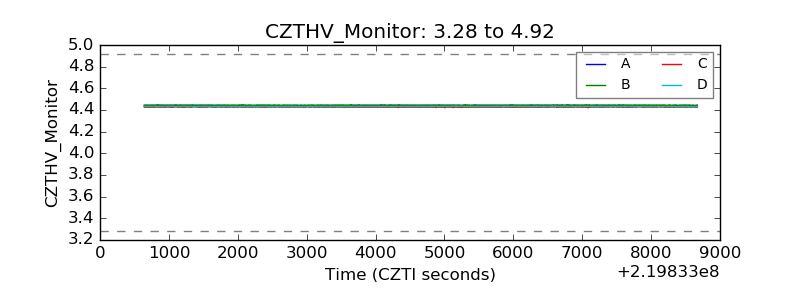 |
| D_VDD | 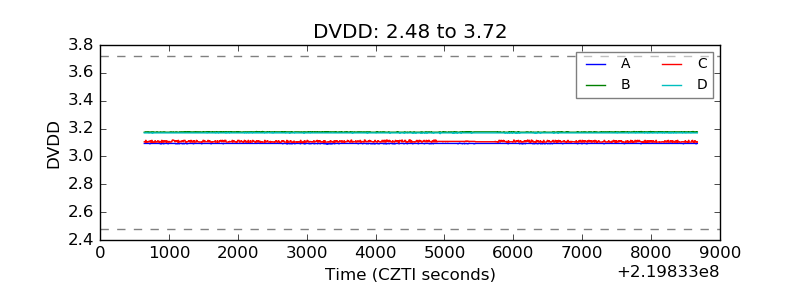 |
| Temperature 1 | 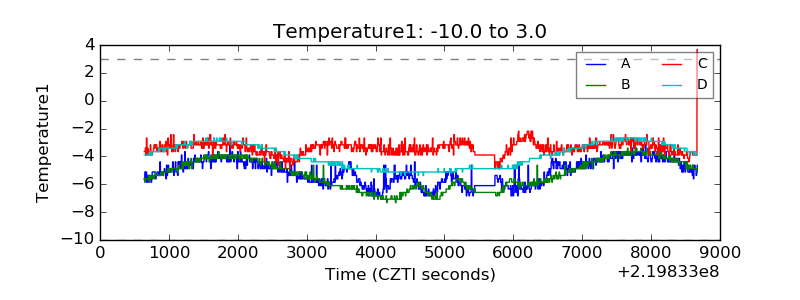 |
| Veto HV Monitor | 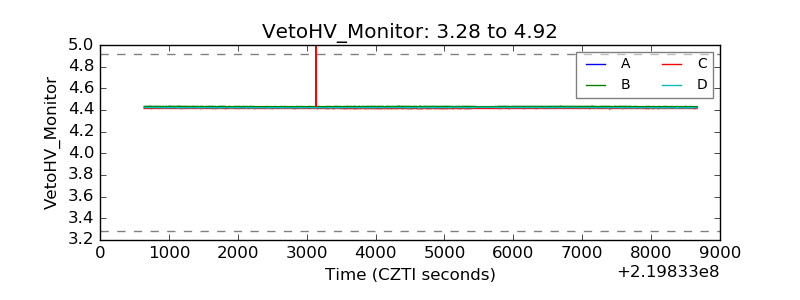 |
| Veto LLD | 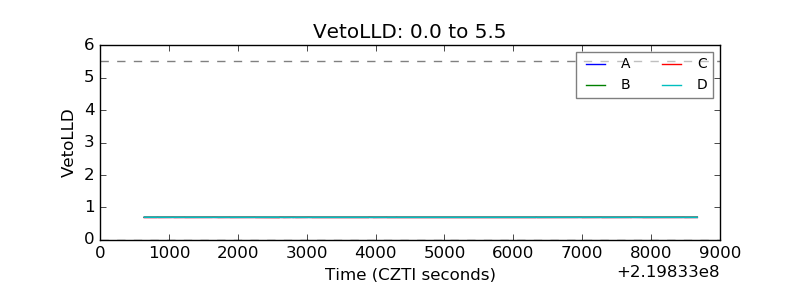 |
| Alpha Counter | 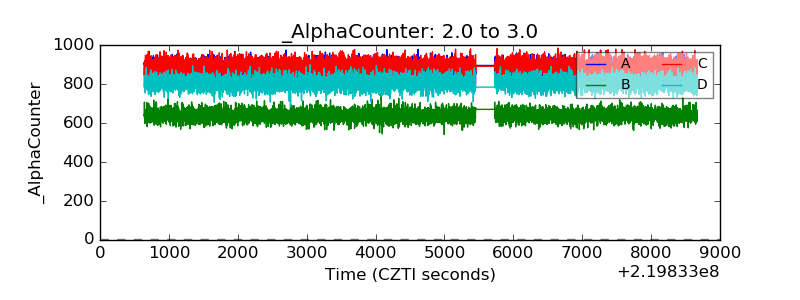 |
| _CPM_Rate | 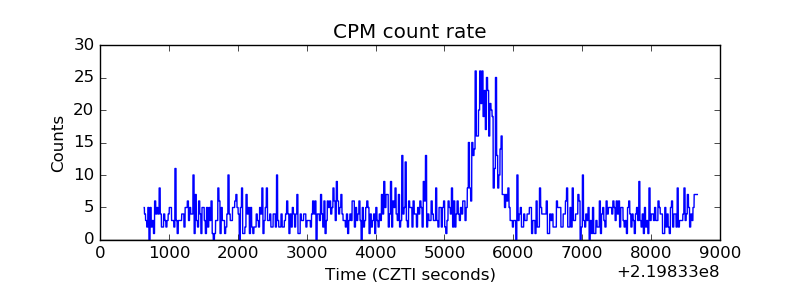 |
| CZT Counter | 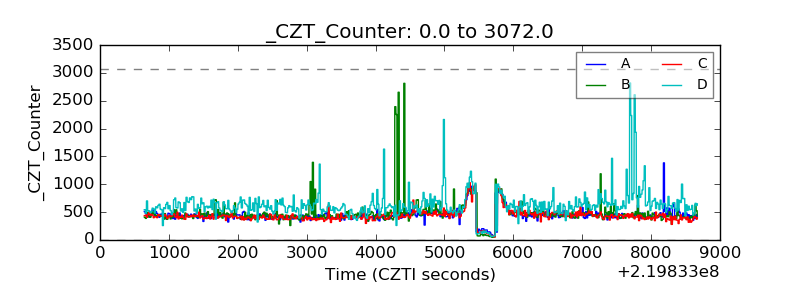 |
| +2.5 Volts monitor |  |
| +5 Volts monitor |  |
| _ROLL_ROT | 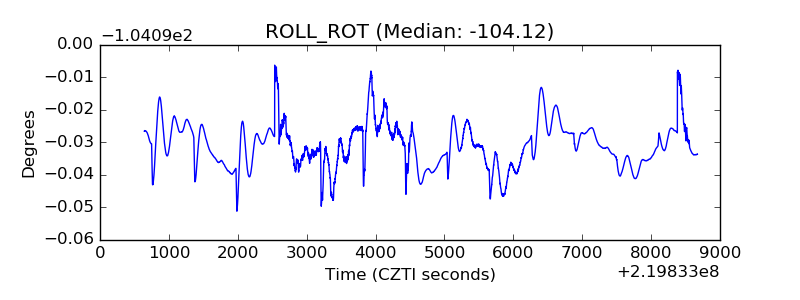 |
| _Roll_DEC | 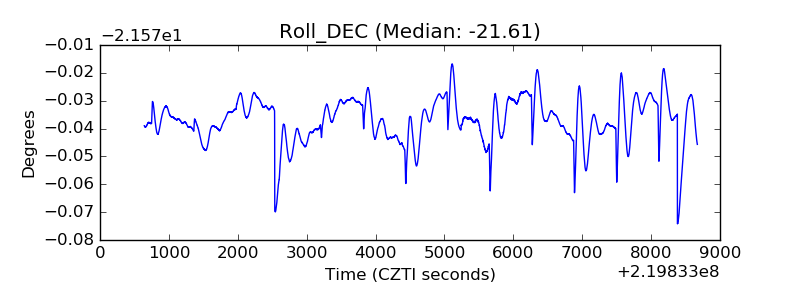 |
| _Roll_RA | 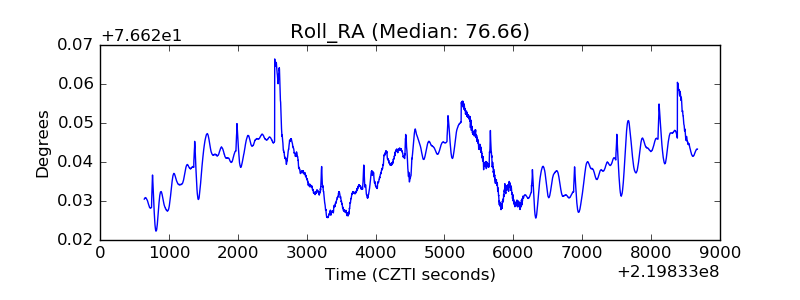 |
| Veto Counter | 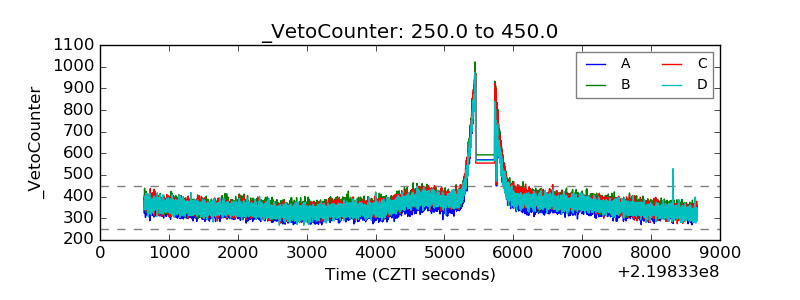 |