| Param | Original file | Final file |
|---|---|---|
| Filename | modeM0/AS1G06_164T01_9000000896cztM0_level2.fits | modeM0/AS1G06_164T01_9000000896cztM0_level2_quad_clean.evt |
| Size (bytes) | 377,311,680 | 404,326,080 |
| Size | 359.8 MB | 385.6 MB |
| Events in quadrant A | 2,248,614 | 2,492,220 |
| Events in quadrant B | 2,177,724 | 2,447,292 |
| Events in quadrant C | 2,234,670 | 2,351,914 |
| Events in quadrant D | 1,857,646 | 2,047,198 |
| Mode M0 | |||
|---|---|---|---|
| Quadrant | BADHDUFLAG | Total packets | Discarded packets |
| A | 0 | 86783 | 0 |
| B | 0 | 93393 | 0 |
| C | 0 | 87023 | 0 |
| D | 0 | 131119 | 0 |
| Mode M9 | |||
|---|---|---|---|
| Quadrant | BADHDUFLAG | Total packets | Discarded packets |
| A | 0 | 42 | 0 |
| B | 0 | 42 | 0 |
| C | 0 | 42 | 0 |
| D | 0 | 42 | 0 |
| Mode SS | |||
|---|---|---|---|
| Quadrant | BADHDUFLAG | Total packets | Discarded packets |
| A | 0 | 860 | 0 |
| B | 0 | 858 | 0 |
| C | 0 | 858 | 0 |
| D | 0 | 860 | 0 |
| Quadrant | Total seconds | Saturated seconds | Saturation percentage |
|---|---|---|---|
| A | 42369 | 608 | 1.435011% |
| B | 42343 | 1030 | 2.432515% |
| C | 42372 | 412 | 0.972340% |
| D | 42208 | 2788 | 6.605383% |
Noise dominated data is calculated using 1-second bins in cleaned event files. If a bin has >2000 counts, and if more than 50% of those come from <1% of pixels, then it is considered to be noise-dominated and hence unusable.
| Quadrant | # 1 sec bins | Bins with >0 counts | Bins with >2000 counts | High rate bins dominated by noise | Noise dominated (total time) | Noise dominated (detector-on time) | Marked lightcurve |
|---|---|---|---|---|---|---|---|
| A | 47442 | 42558 | 0 | 0 | 0.00% | 0.00% |  |
| B | 47442 | 42546 | 0 | 0 | 0.00% | 0.00% |  |
| C | 47442 | 42573 | 0 | 0 | 0.00% | 0.00% |  |
| D | 47442 | 42404 | 0 | 0 | 0.00% | 0.00% |  |
Top three noisy pixels from each quadrant. If the there are fewer than three noisy pixels in the level2.evt file, extra rows are filled as -1
| Pixel properties | Quadrant properties | ||||||
|---|---|---|---|---|---|---|---|
| Quadrant | DetID | PixID | Counts | Sigma | Mean | Median | Sigma |
| A | 0 | 29 | 2308 | 11.74 | 585 | 548 | 149.9 |
| A | 7 | 110 | 1957 | 9.4 | 585 | 548 | 149.9 |
| A | 0 | 30 | 1756 | 8.06 | 585 | 548 | 149.9 |
| B | 2 | 9 | 1863 | 11.29 | 575 | 547 | 116.6 |
| B | 12 | 226 | 1546 | 8.57 | 575 | 547 | 116.6 |
| B | 14 | 254 | 1482 | 8.02 | 575 | 547 | 116.6 |
| C | 1 | 80 | 1673 | 7.26 | 589 | 546 | 155.2 |
| C | 1 | 81 | 1625 | 6.95 | 589 | 546 | 155.2 |
| C | 12 | 241 | 1560 | 6.54 | 589 | 546 | 155.2 |
| D | 6 | 231 | 1475 | 6.9 | 528 | 479 | 144.3 |
| D | 11 | 82 | 1468 | 6.85 | 528 | 479 | 144.3 |
| D | 4 | 246 | 1422 | 6.53 | 528 | 479 | 144.3 |
Histogram calculated using DETX and DETY for each event in the final _common_clean file
| Quadrant A | 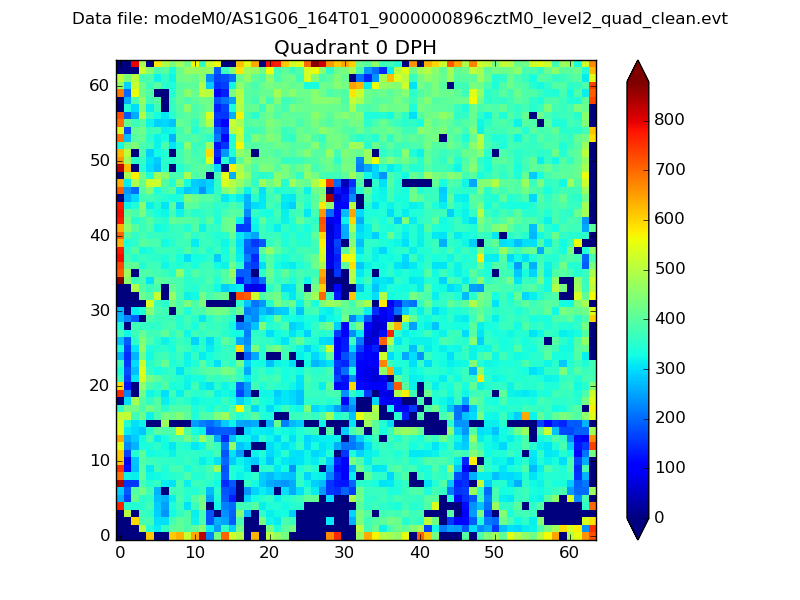 |
 |
Quadrant B |
|---|---|---|---|
| Quadrant D | 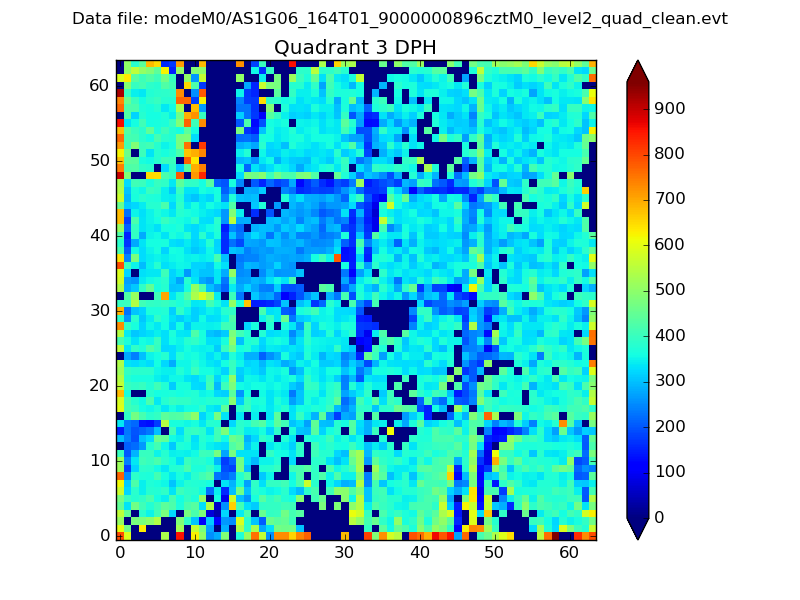 |
 |
Quadrant C |
| Plot type | Count rate plots | Images |
|---|---|---|
| Comparison with Poisson distribution Blue bars denote a histogram of data divided into 1 sec bins. Red curve is a Poisson curve with rate = median count rate of data. |
 |
 |
| Quadrant-wise count rates Data is divided into 100 sec bins |
 |
|
| Module-wise count rates for Quadrant A Data is divided into 100 sec bins |
 |
 |
| Module-wise count rates for Quadrant B Data is divided into 100 sec bins |
 |
 |
| Module-wise count rates for Quadrant C Data is divided into 100 sec bins |
 |
 |
| Module-wise count rates for Quadrant D Data is divided into 100 sec bins |
 |
 |
| Parameter | Plot |
|---|---|
| CZT HV Monitor |  |
| D_VDD |  |
| Temperature 1 |  |
| Veto HV Monitor |  |
| Veto LLD |  |
| Alpha Counter |  |
| _CPM_Rate |  |
| CZT Counter |  |
| +2.5 Volts monitor |  |
| +5 Volts monitor |  |
| _ROLL_ROT |  |
| _Roll_DEC |  |
| _Roll_RA |  |
| Veto Counter |  |