| Param | Original file | Final file |
|---|---|---|
| Filename | modeM0/AS1G06_164T01_9000000896_06617cztM0_level2.evt | modeM0/AS1G06_164T01_9000000896_06617cztM0_level2_quad_clean.evt |
| Size (bytes) | 439,295,040 | 64,019,520 |
| Size | 418.9 MB | 61.1 MB |
| Events in quadrant A | 2,299,492 | 418,188 |
| Events in quadrant B | 2,571,467 | 417,970 |
| Events in quadrant C | 2,214,285 | 419,912 |
| Events in quadrant D | 5,875,768 | 328,246 |
| Mode M0 | |||
|---|---|---|---|
| Quadrant | BADHDUFLAG | Total packets | Discarded packets |
| A | 0 | 12442 | 2072 |
| B | 0 | 13220 | 2134 |
| C | 0 | 12434 | 2071 |
| D | 0 | 25929 | 4994 |
| Mode M9 | |||
|---|---|---|---|
| Quadrant | BADHDUFLAG | Total packets | Discarded packets |
| A | 0 | 8 | 0 |
| B | 0 | 8 | 0 |
| C | 0 | 8 | 0 |
| D | 0 | 9 | 1 |
| Mode SS | |||
|---|---|---|---|
| Quadrant | BADHDUFLAG | Total packets | Discarded packets |
| A | 0 | 124 | 22 |
| B | 0 | 126 | 22 |
| C | 0 | 122 | 22 |
| D | 0 | 122 | 18 |
| Quadrant | Total seconds | Saturated seconds | Saturation percentage |
|---|---|---|---|
| A | 5082 | 44 | 0.865801% |
| B | 5059 | 88 | 1.739474% |
| C | 5096 | 13 | 0.255102% |
| D | 4915 | 1083 | 22.034588% |
Noise dominated data is calculated using 1-second bins in cleaned event files. If a bin has >2000 counts, and if more than 50% of those come from <1% of pixels, then it is considered to be noise-dominated and hence unusable.
| Quadrant | # 1 sec bins | Bins with >0 counts | Bins with >2000 counts | High rate bins dominated by noise | Noise dominated (total time) | Noise dominated (detector-on time) | Marked lightcurve |
|---|---|---|---|---|---|---|---|
| A | 6319 | 5271 | 0 | 0 | 0.00% | 0.00% | 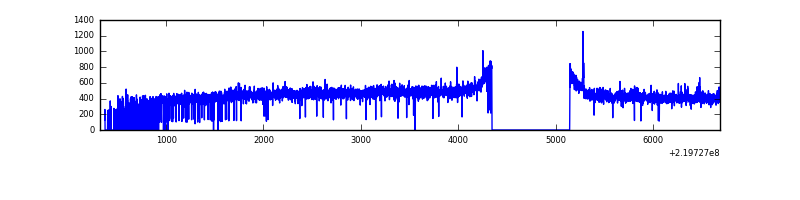 |
| B | 6316 | 5267 | 12 | 12 | 0.19% | 0.23% | 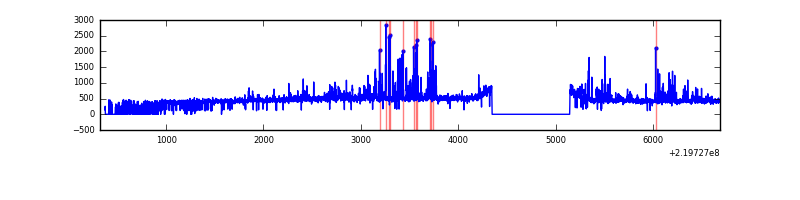 |
| C | 6369 | 5310 | 0 | 0 | 0.00% | 0.00% | 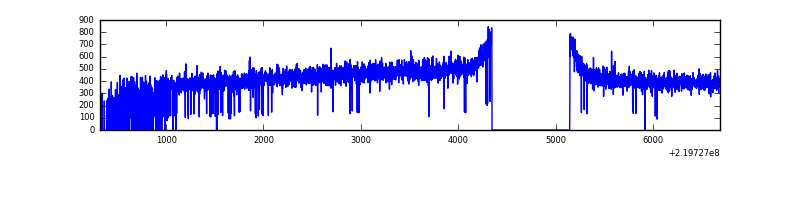 |
| D | 6295 | 5131 | 819 | 819 | 13.01% | 15.96% | 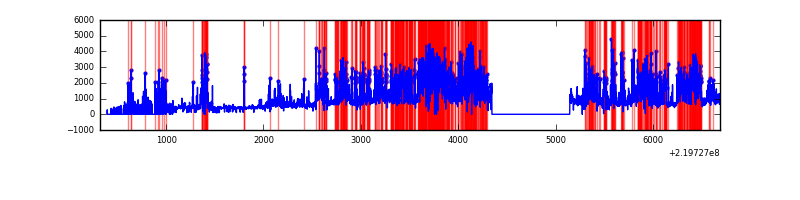 |
Top three noisy pixels from each quadrant. If the there are fewer than three noisy pixels in the level2.evt file, extra rows are filled as -1
| Pixel properties | Quadrant properties | ||||||
|---|---|---|---|---|---|---|---|
| Quadrant | DetID | PixID | Counts | Sigma | Mean | Median | Sigma |
| A | 8 | 15 | 40825 | 332.82 | 586 | 572 | 120.9 |
| A | 15 | 234 | 5872 | 43.82 | 586 | 572 | 120.9 |
| A | 0 | 226 | 5531 | 41.0 | 586 | 572 | 120.9 |
| B | 4 | 80 | 144730 | 1281.03 | 584 | 571 | 112.5 |
| B | 0 | 219 | 85282 | 752.76 | 584 | 571 | 112.5 |
| B | 0 | 214 | 24481 | 212.47 | 584 | 571 | 112.5 |
| C | 1 | 16 | 5335 | 36.09 | 566 | 565 | 132.2 |
| C | 13 | 61 | 4429 | 29.24 | 566 | 565 | 132.2 |
| C | 3 | 202 | 1448 | 6.68 | 566 | 565 | 132.2 |
| D | 8 | 195 | 1623099 | 13130.83 | 501 | 485 | 123.6 |
| D | 14 | 34 | 1083719 | 8765.95 | 501 | 485 | 123.6 |
| D | 2 | 33 | 912969 | 7384.18 | 501 | 485 | 123.6 |
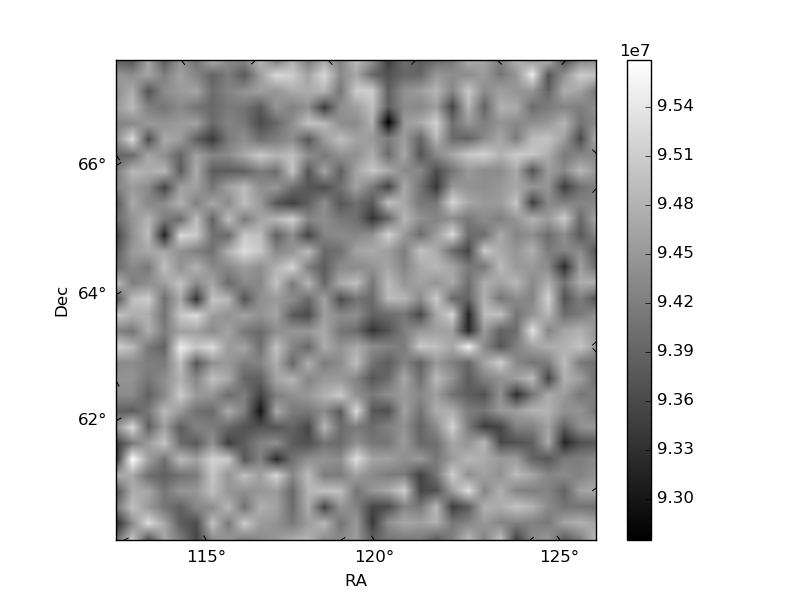
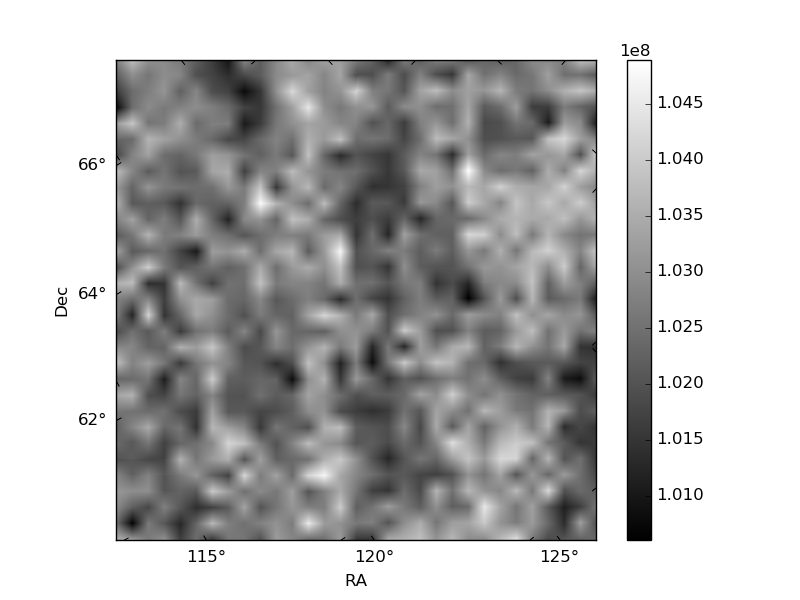
Histogram calculated using DETX and DETY for each event in the final _common_clean file
| Quadrant A | 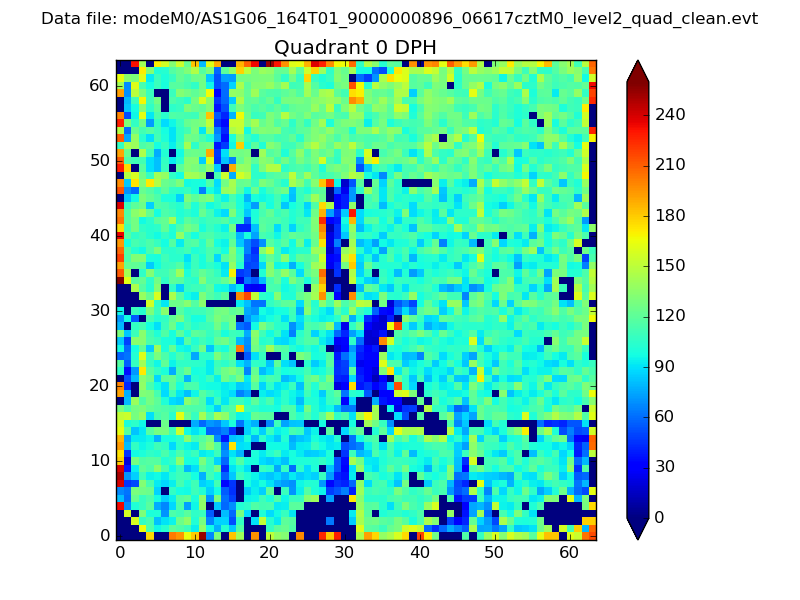 |
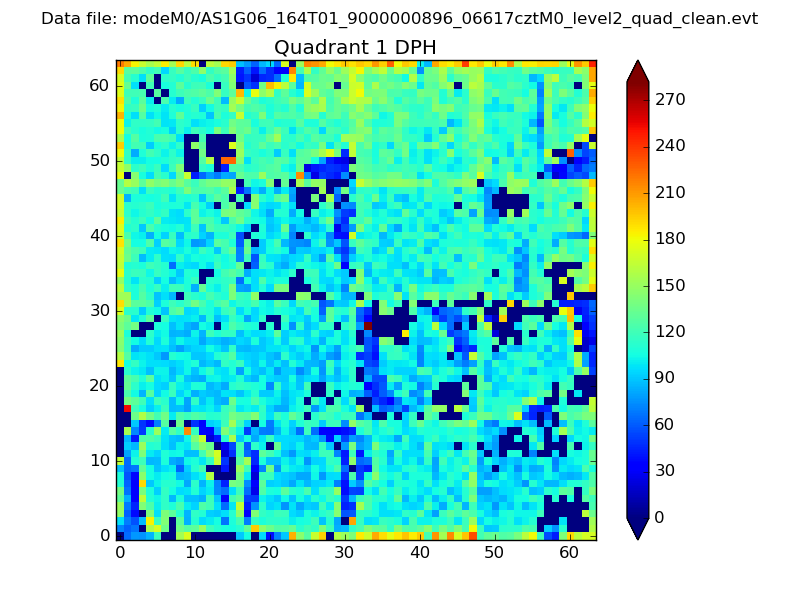 |
Quadrant B |
|---|---|---|---|
| Quadrant D | 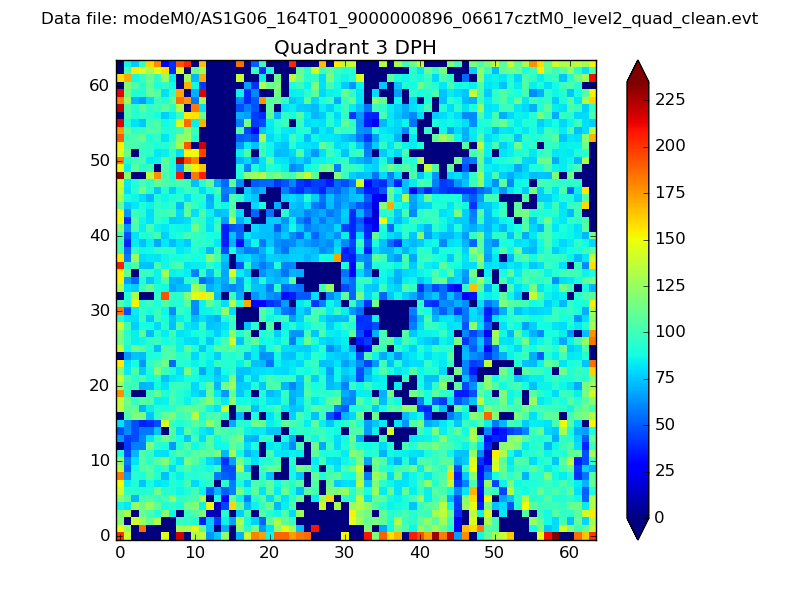 |
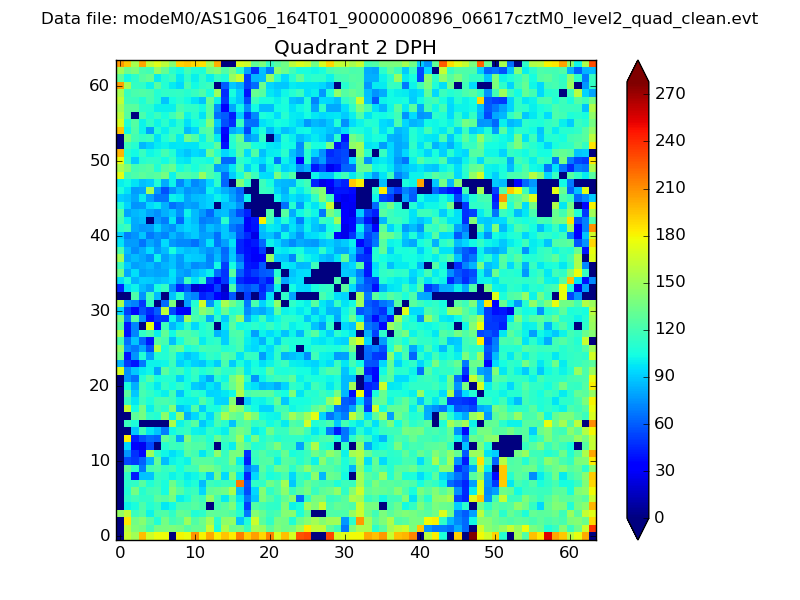 |
Quadrant C |
| Plot type | Count rate plots | Images |
|---|---|---|
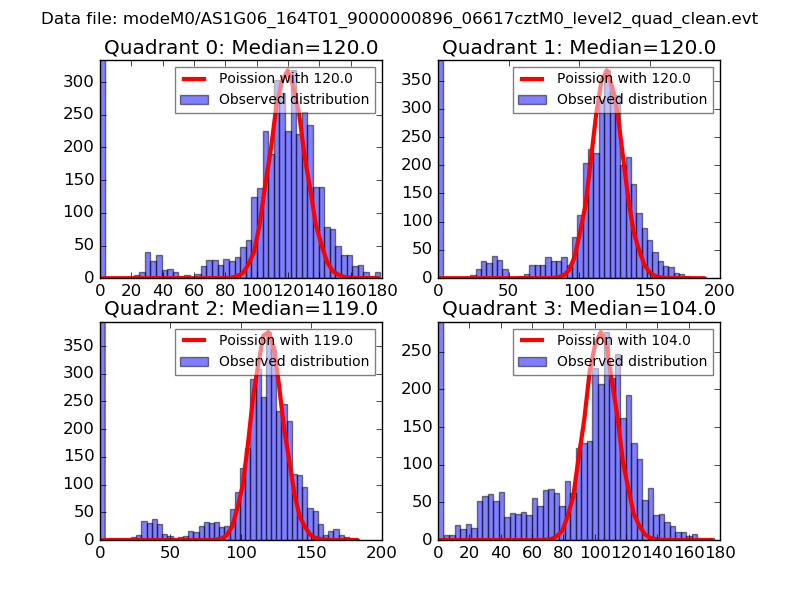
| Comparison with Poisson distribution Blue bars denote a histogram of data divided into 1 sec bins. Red curve is a Poisson curve with rate = median count rate of data. |
 |
 |
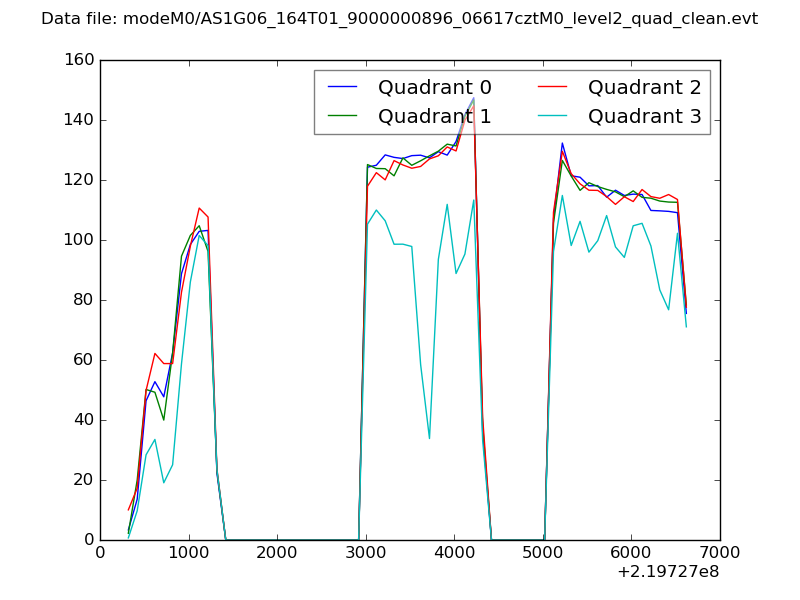
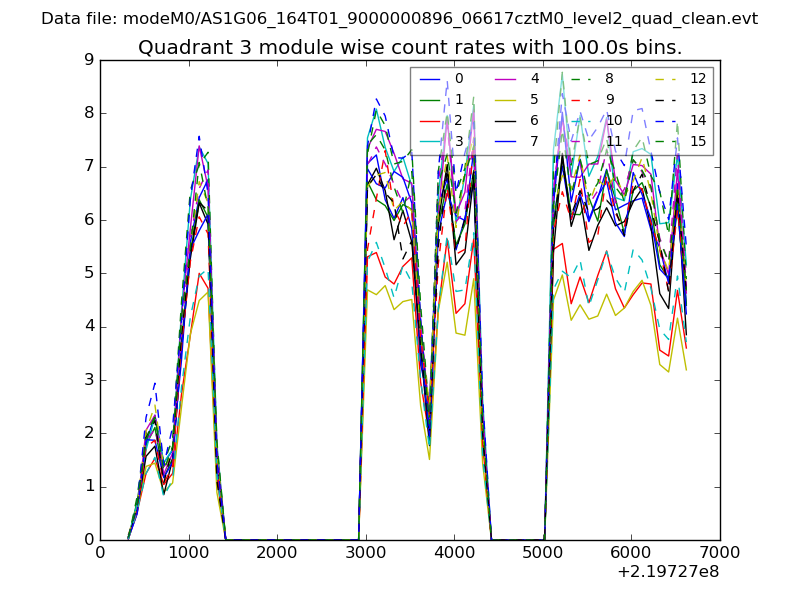
| Quadrant-wise count rates Data is divided into 100 sec bins |
 |
|
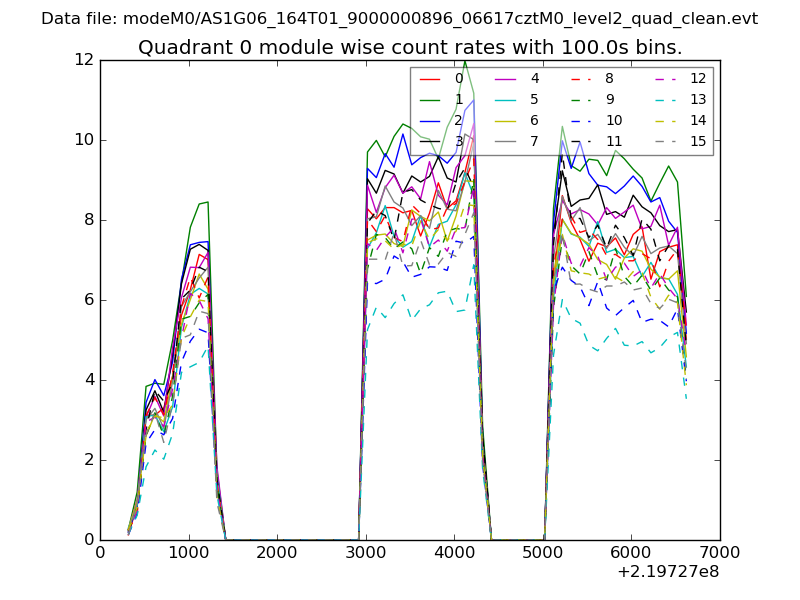
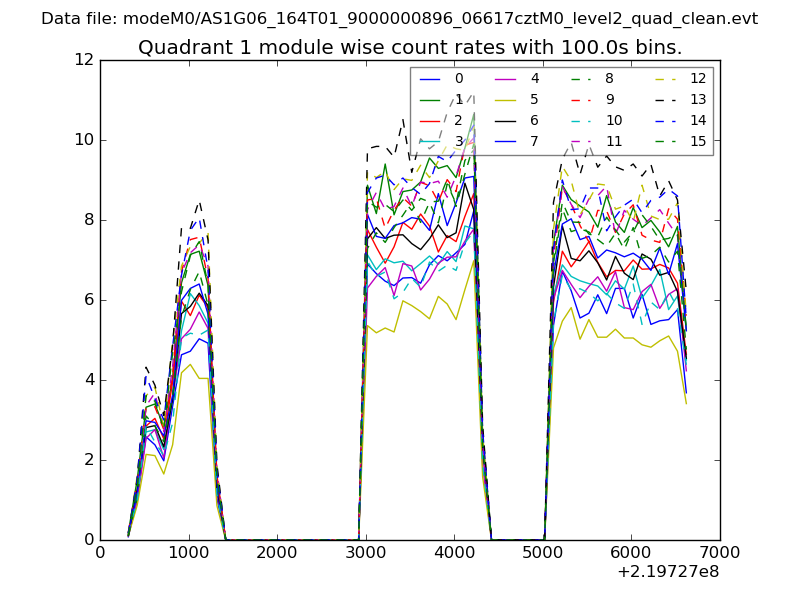
| Module-wise count rates for Quadrant A Data is divided into 100 sec bins |
 |
 |
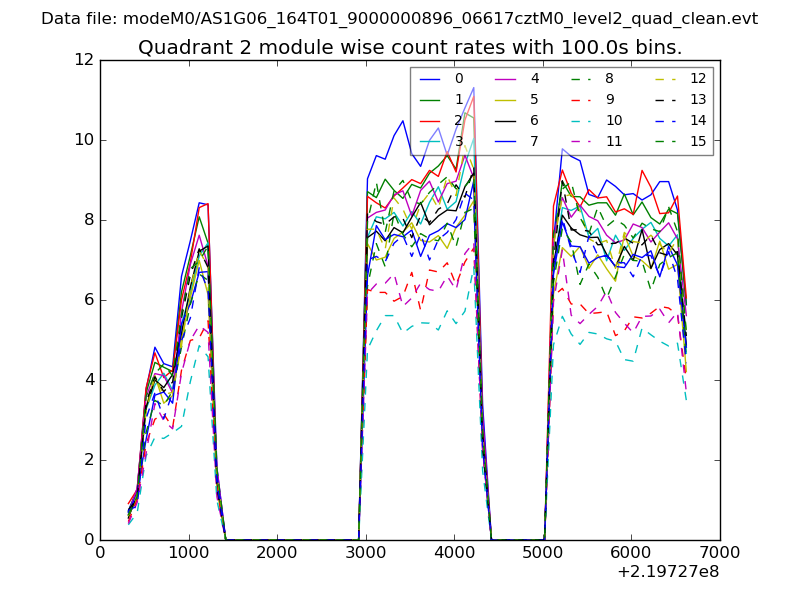
| Module-wise count rates for Quadrant B Data is divided into 100 sec bins |
 |
 |
| Module-wise count rates for Quadrant C Data is divided into 100 sec bins |
 |
 |
| Module-wise count rates for Quadrant D Data is divided into 100 sec bins |
 |
 |
| Parameter | Plot |
|---|---|
| CZT HV Monitor | 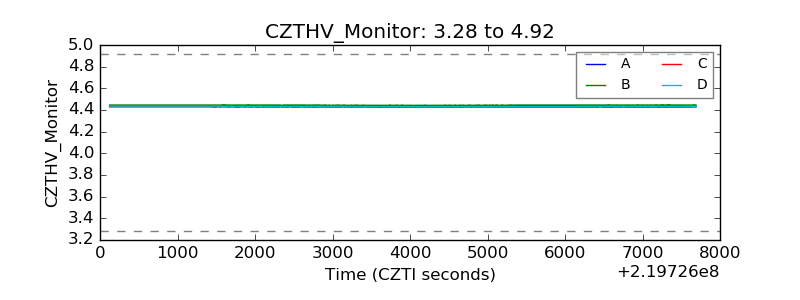 |
| D_VDD | 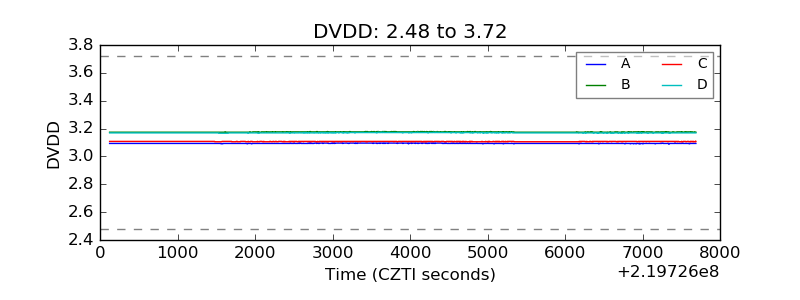 |
| Temperature 1 | 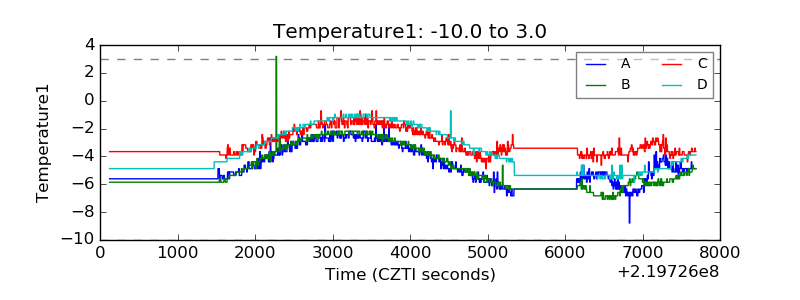 |
| Veto HV Monitor | 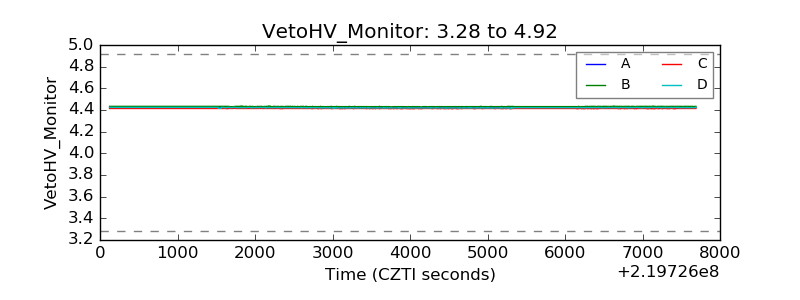 |
| Veto LLD | 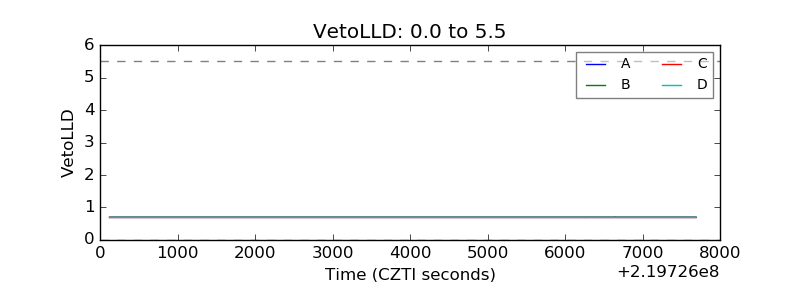 |
| Alpha Counter | 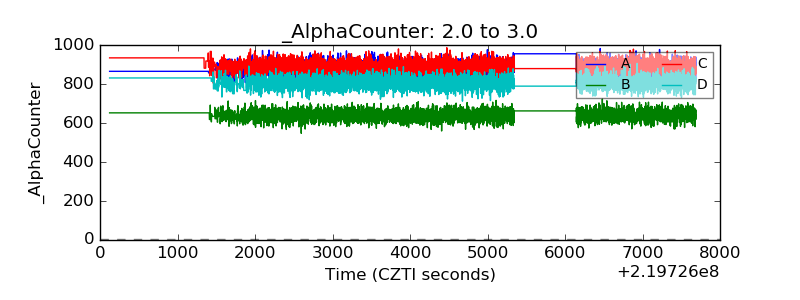 |
| _CPM_Rate | 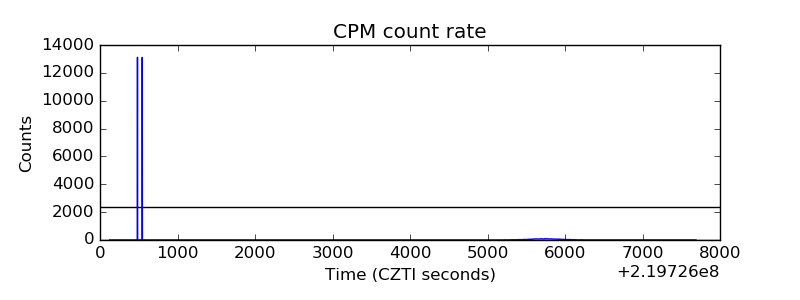 |
| CZT Counter | 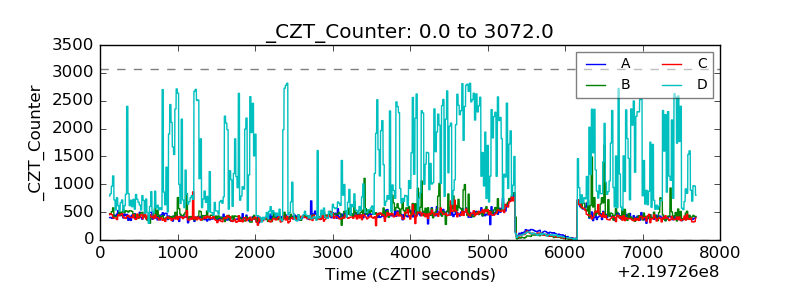 |
| +2.5 Volts monitor |  |
| +5 Volts monitor |  |
| _ROLL_ROT | 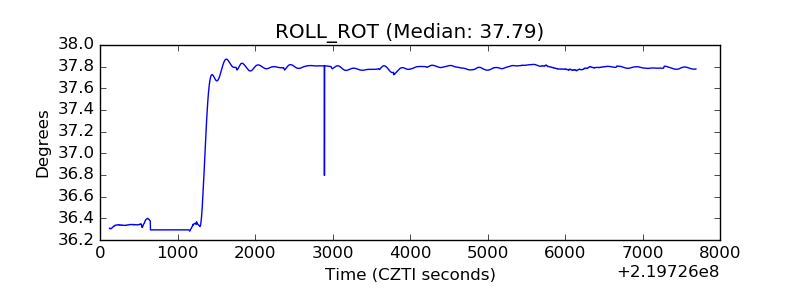 |
| _Roll_DEC | 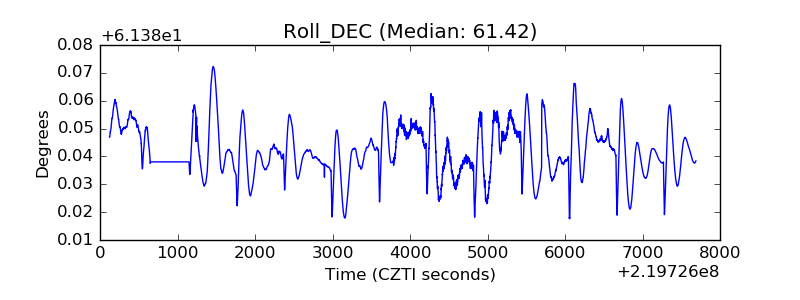 |
| _Roll_RA | 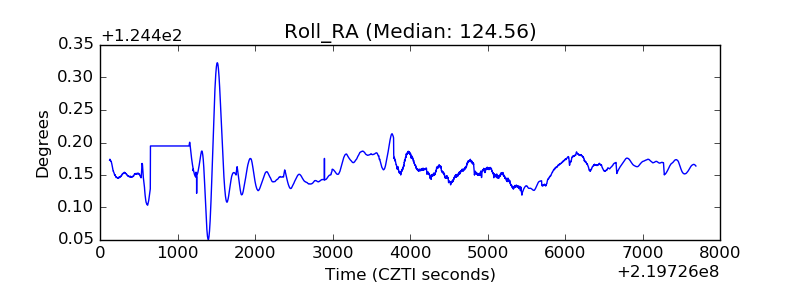 |
| Veto Counter | 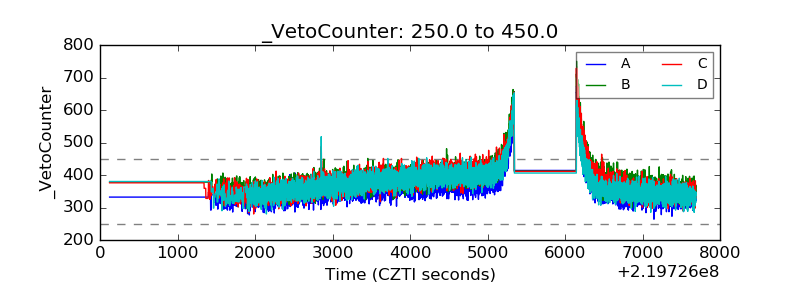 |