| Param | Original file | Final file |
|---|---|---|
| Filename | modeM0/AS1G06_164T01_9000000896_06618cztM0_level2.evt | modeM0/AS1G06_164T01_9000000896_06618cztM0_level2_quad_clean.evt |
| Size (bytes) | 953,593,920 | 152,700,480 |
| Size | 909.4 MB | 145.6 MB |
| Events in quadrant A | 5,202,995 | 985,350 |
| Events in quadrant B | 5,875,659 | 991,438 |
| Events in quadrant C | 5,032,220 | 983,176 |
| Events in quadrant D | 11,985,005 | 862,201 |
| Mode M0 | |||
|---|---|---|---|
| Quadrant | BADHDUFLAG | Total packets | Discarded packets |
| A | 0 | 23714 | 3 |
| B | 0 | 25463 | 2 |
| C | 0 | 23648 | 2 |
| D | 0 | 43968 | 2 |
| Mode M9 | |||
|---|---|---|---|
| Quadrant | BADHDUFLAG | Total packets | Discarded packets |
| A | 0 | 11 | 0 |
| B | 0 | 11 | 0 |
| C | 0 | 11 | 0 |
| D | 0 | 11 | 0 |
| Mode SS | |||
|---|---|---|---|
| Quadrant | BADHDUFLAG | Total packets | Discarded packets |
| A | 0 | 236 | 0 |
| B | 0 | 236 | 0 |
| C | 0 | 236 | 0 |
| D | 0 | 236 | 0 |
| Quadrant | Total seconds | Saturated seconds | Saturation percentage |
|---|---|---|---|
| A | 11588 | 198 | 1.708664% |
| B | 11588 | 317 | 2.735589% |
| C | 11588 | 100 | 0.862962% |
| D | 11588 | 1729 | 14.920608% |
Noise dominated data is calculated using 1-second bins in cleaned event files. If a bin has >2000 counts, and if more than 50% of those come from <1% of pixels, then it is considered to be noise-dominated and hence unusable.
| Quadrant | # 1 sec bins | Bins with >0 counts | Bins with >2000 counts | High rate bins dominated by noise | Noise dominated (total time) | Noise dominated (detector-on time) | Marked lightcurve |
|---|---|---|---|---|---|---|---|
| A | 12693 | 11590 | 0 | 0 | 0.00% | 0.00% | 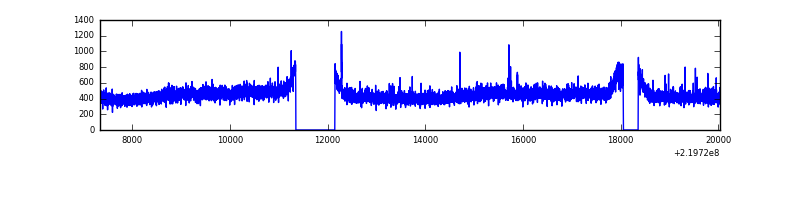 |
| B | 12693 | 11590 | 48 | 48 | 0.38% | 0.41% | 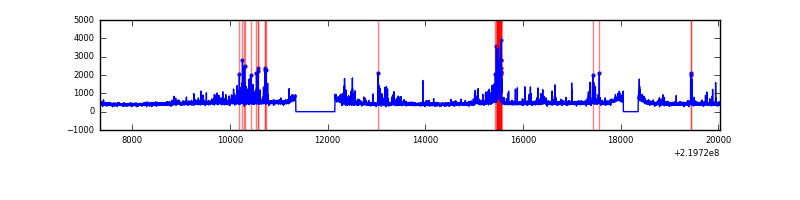 |
| C | 12693 | 11590 | 3 | 3 | 0.02% | 0.03% | 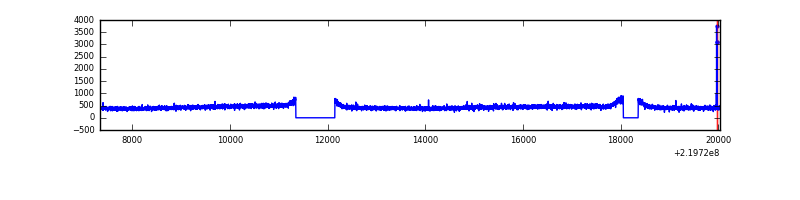 |
| D | 12693 | 11590 | 1327 | 1327 | 10.45% | 11.45% | 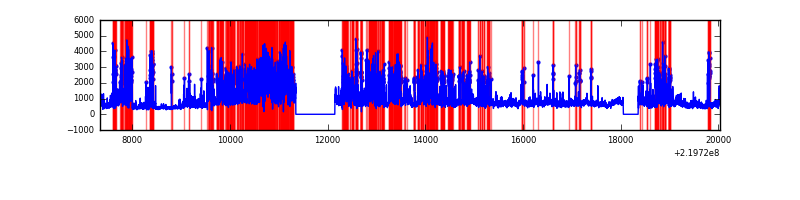 |
Top three noisy pixels from each quadrant. If the there are fewer than three noisy pixels in the level2.evt file, extra rows are filled as -1
| Pixel properties | Quadrant properties | ||||||
|---|---|---|---|---|---|---|---|
| Quadrant | DetID | PixID | Counts | Sigma | Mean | Median | Sigma |
| A | 8 | 15 | 74978 | 273.44 | 1327 | 1297 | 269.5 |
| A | 0 | 226 | 12611 | 41.99 | 1327 | 1297 | 269.5 |
| A | 12 | 194 | 12329 | 40.94 | 1327 | 1297 | 269.5 |
| B | 4 | 80 | 218025 | 858.09 | 1330 | 1297 | 252.6 |
| B | 0 | 219 | 192983 | 758.94 | 1330 | 1297 | 252.6 |
| B | 4 | 48 | 155031 | 608.68 | 1330 | 1297 | 252.6 |
| C | 9 | 54 | 14754 | 45.83 | 1281 | 1282 | 293.9 |
| C | 1 | 16 | 12364 | 37.7 | 1281 | 1282 | 293.9 |
| C | 13 | 61 | 10125 | 30.08 | 1281 | 1282 | 293.9 |
| D | 8 | 195 | 3590253 | 12005.81 | 1219 | 1177 | 298.9 |
| D | 2 | 33 | 1895814 | 6337.74 | 1219 | 1177 | 298.9 |
| D | 14 | 34 | 1356798 | 4534.68 | 1219 | 1177 | 298.9 |
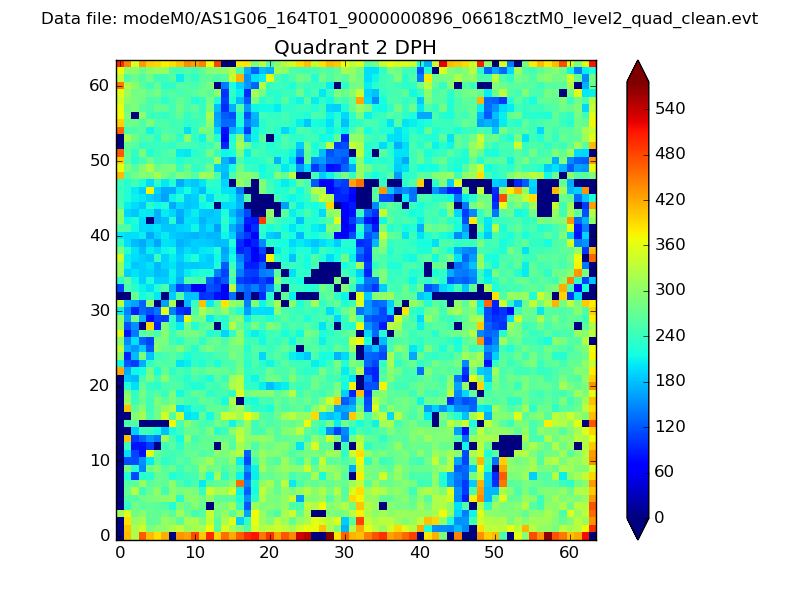
Histogram calculated using DETX and DETY for each event in the final _common_clean file
| Quadrant A | 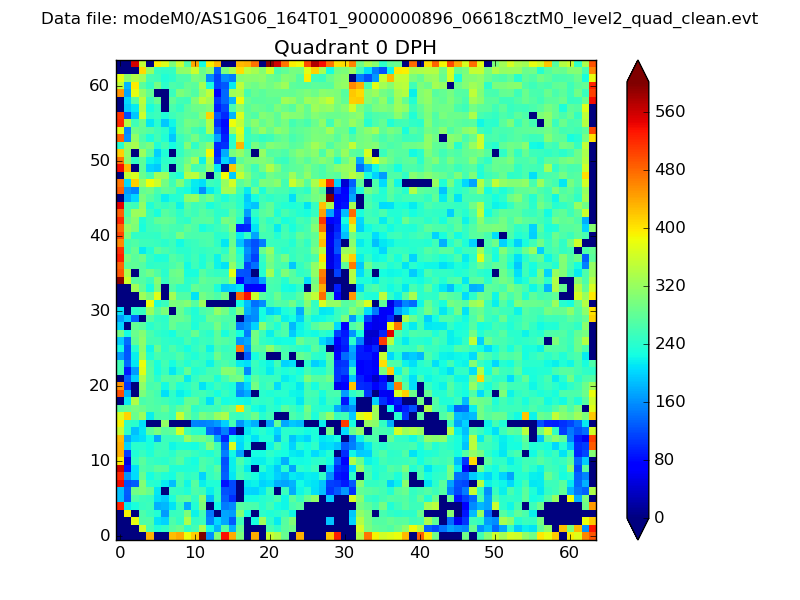 |
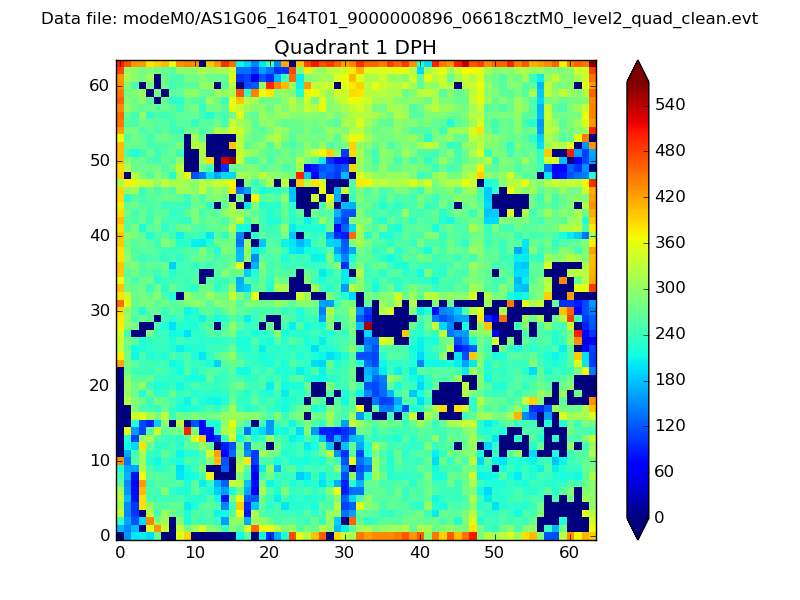 |
Quadrant B |
|---|---|---|---|
| Quadrant D | 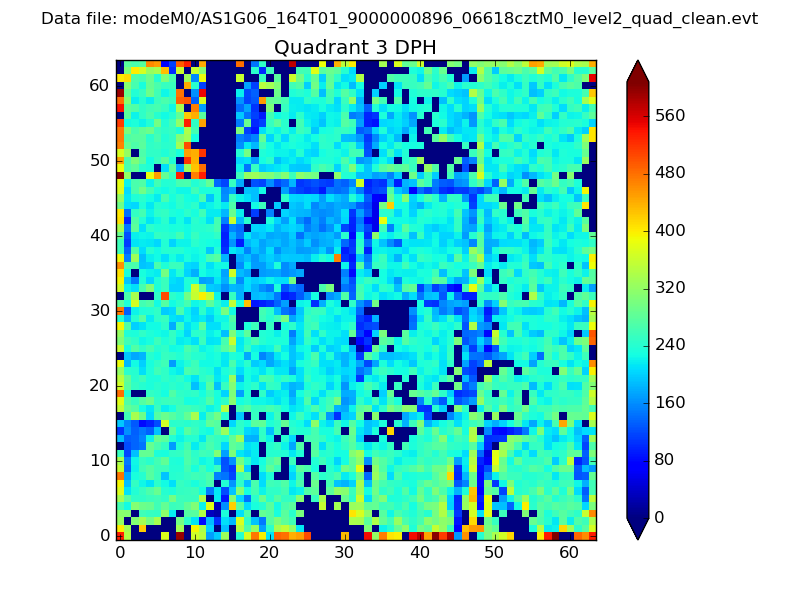 |
 |
Quadrant C |
| Plot type | Count rate plots | Images |
|---|---|---|
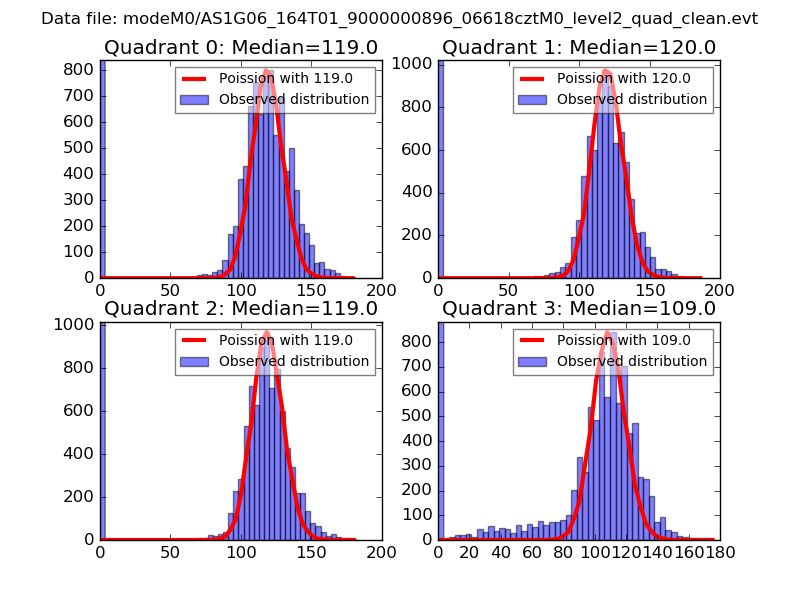
| Comparison with Poisson distribution Blue bars denote a histogram of data divided into 1 sec bins. Red curve is a Poisson curve with rate = median count rate of data. |
 |
 |
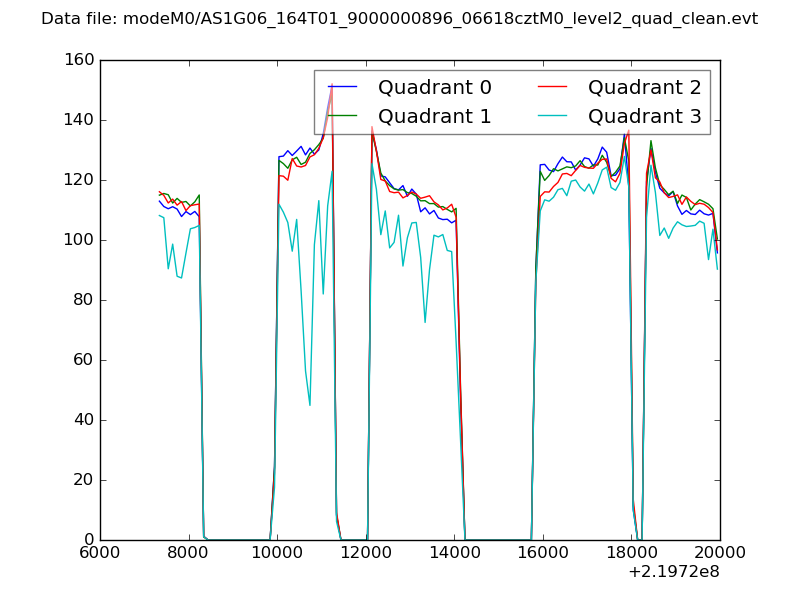
| Quadrant-wise count rates Data is divided into 100 sec bins |
 |
|
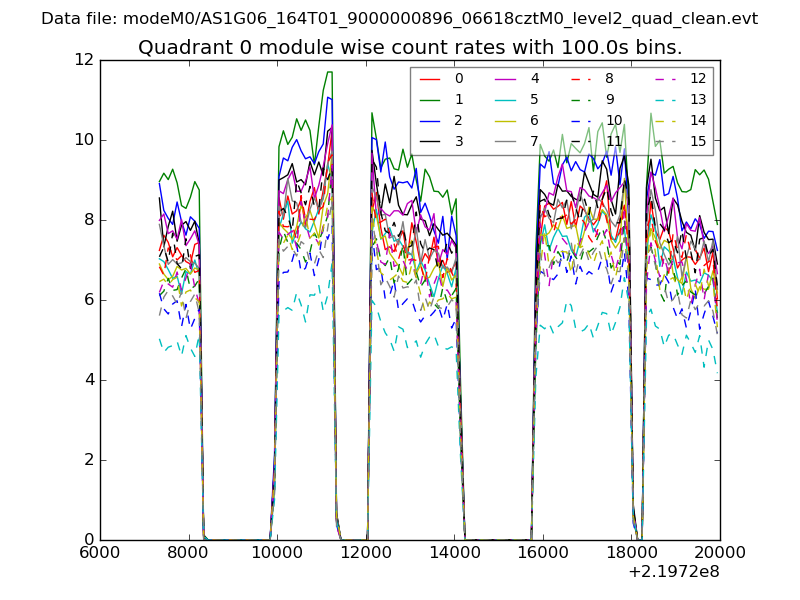
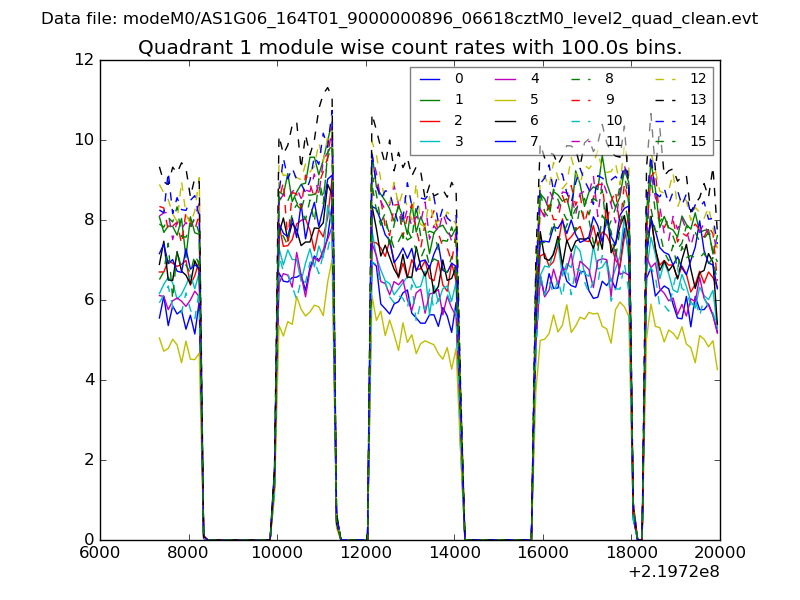
| Module-wise count rates for Quadrant A Data is divided into 100 sec bins |
 |
 |
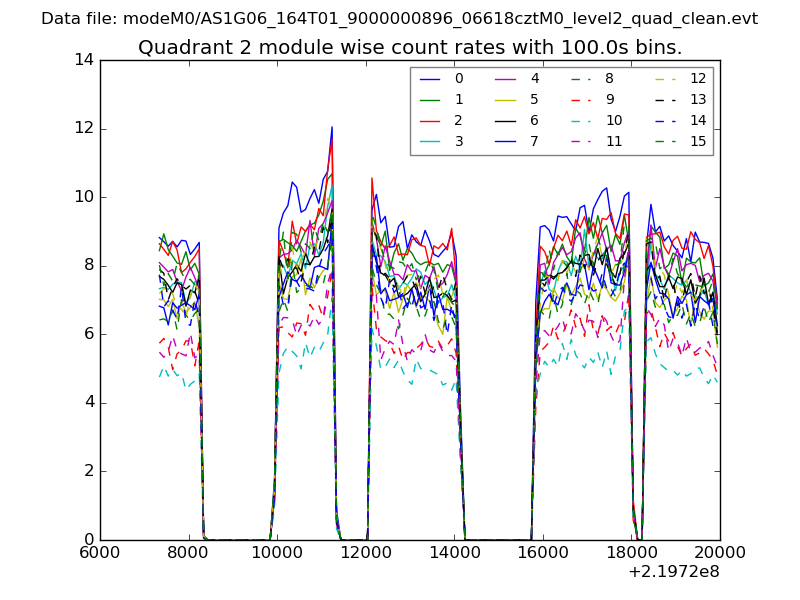
| Module-wise count rates for Quadrant B Data is divided into 100 sec bins |
 |
 |
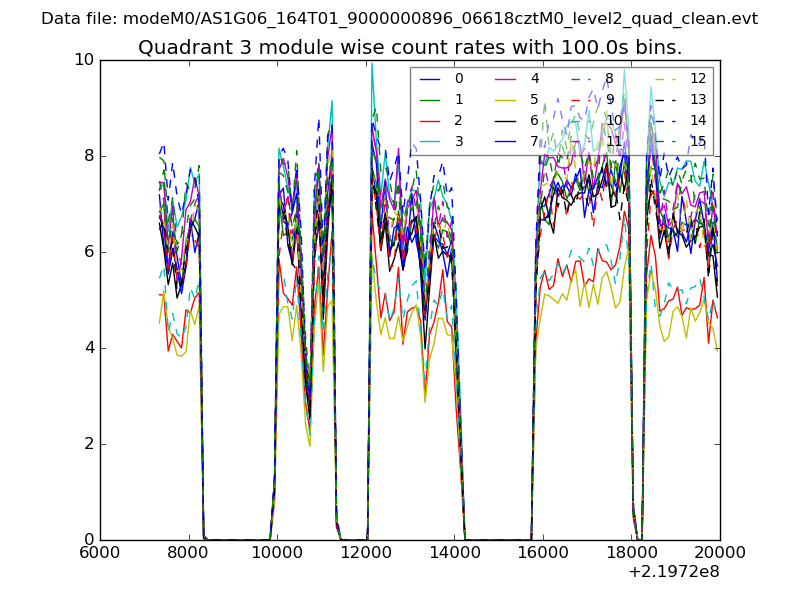
| Module-wise count rates for Quadrant C Data is divided into 100 sec bins |
 |
 |
| Module-wise count rates for Quadrant D Data is divided into 100 sec bins |
 |
 |
| Parameter | Plot |
|---|---|
| CZT HV Monitor | 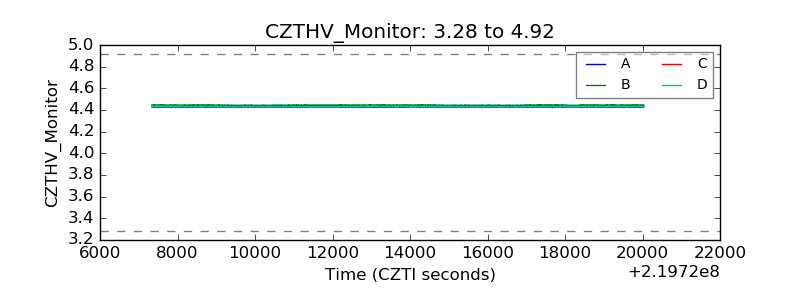 |
| D_VDD | 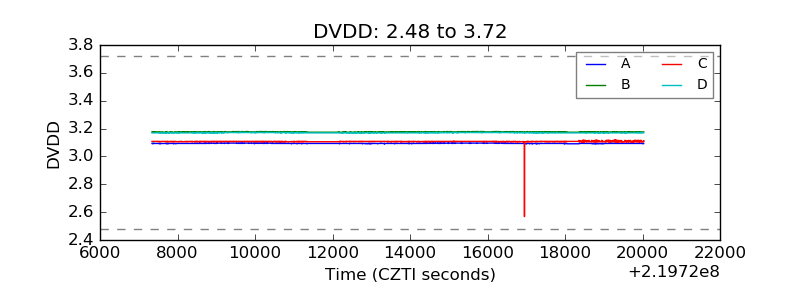 |
| Temperature 1 | 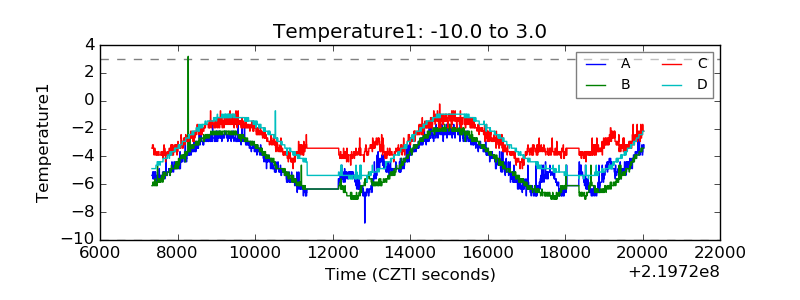 |
| Veto HV Monitor | 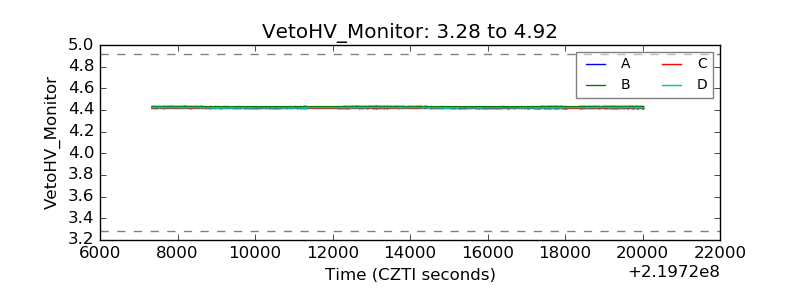 |
| Veto LLD | 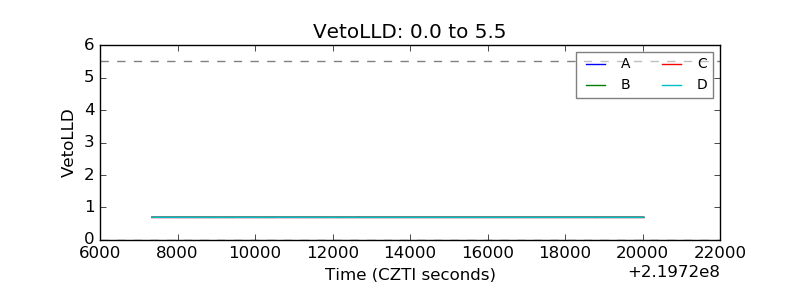 |
| Alpha Counter | 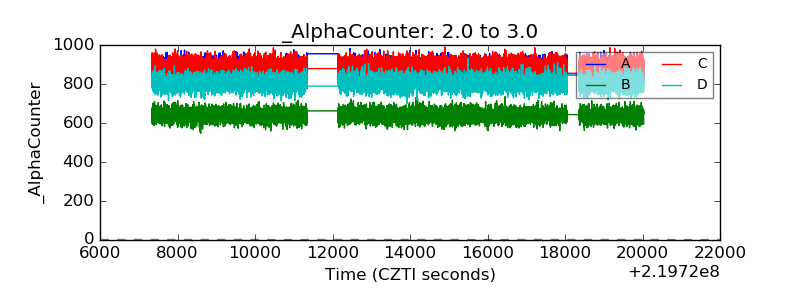 |
| _CPM_Rate | 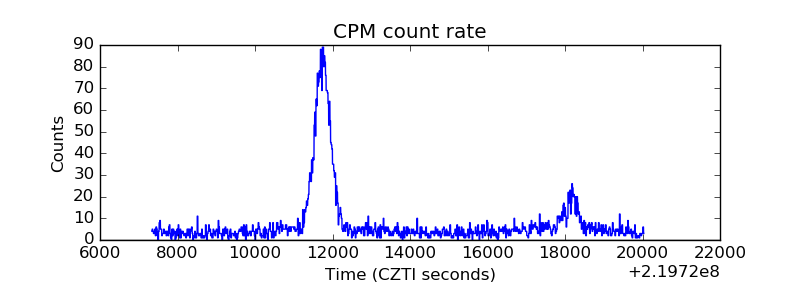 |
| CZT Counter | 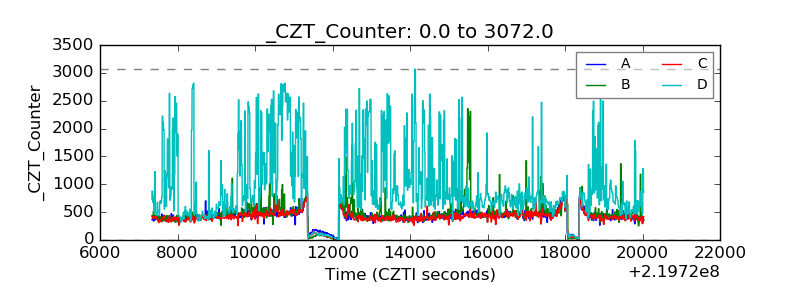 |
| +2.5 Volts monitor |  |
| +5 Volts monitor |  |
| _ROLL_ROT | 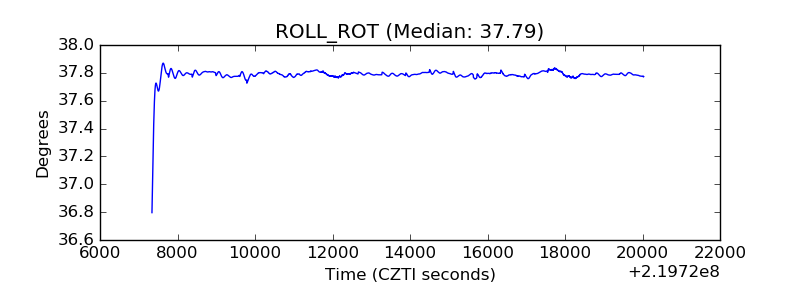 |
| _Roll_DEC | 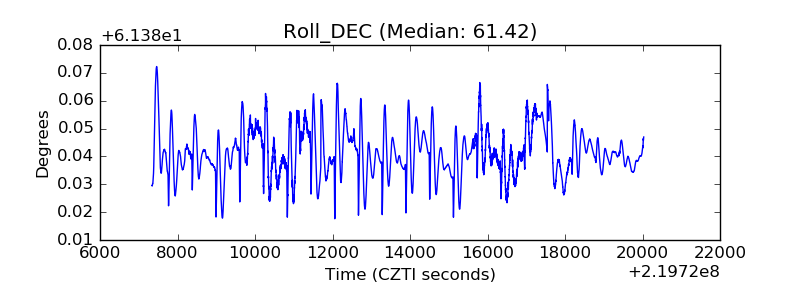 |
| _Roll_RA | 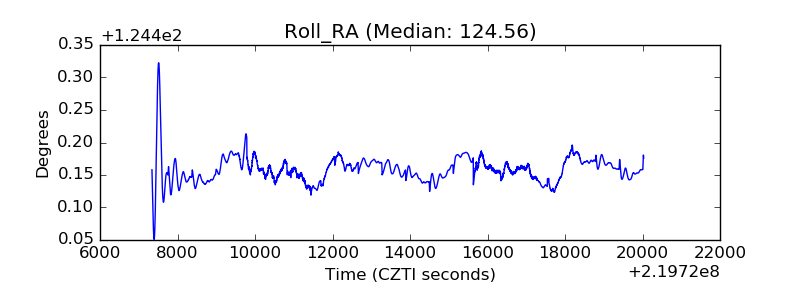 |
| Veto Counter | 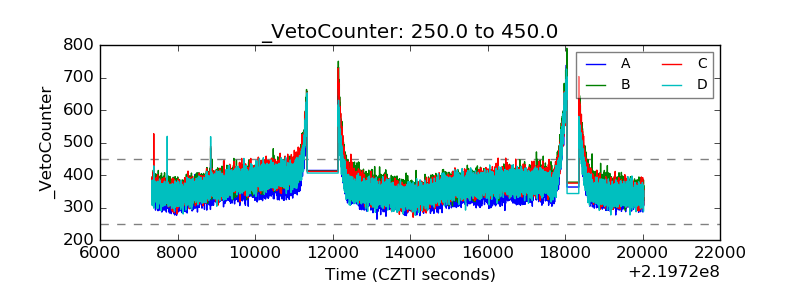 |