| Param | Original file | Final file |
|---|---|---|
| Filename | modeM0/AS1G06_164T01_9000000896_06619cztM0_level2.evt | modeM0/AS1G06_164T01_9000000896_06619cztM0_level2_quad_clean.evt |
| Size (bytes) | 550,344,960 | 101,661,120 |
| Size | 524.8 MB | 97.0 MB |
| Events in quadrant A | 3,359,602 | 645,959 |
| Events in quadrant B | 3,769,364 | 652,500 |
| Events in quadrant C | 3,553,071 | 645,077 |
| Events in quadrant D | 5,473,990 | 610,982 |
| Mode M0 | |||
|---|---|---|---|
| Quadrant | BADHDUFLAG | Total packets | Discarded packets |
| A | 0 | 15492 | 1 |
| B | 0 | 16462 | 0 |
| C | 0 | 16127 | 0 |
| D | 0 | 21592 | 0 |
| Mode SS | |||
|---|---|---|---|
| Quadrant | BADHDUFLAG | Total packets | Discarded packets |
| A | 0 | 150 | 0 |
| B | 0 | 150 | 0 |
| C | 0 | 150 | 0 |
| D | 0 | 150 | 0 |
| Quadrant | Total seconds | Saturated seconds | Saturation percentage |
|---|---|---|---|
| A | 7531 | 251 | 3.332891% |
| B | 7531 | 344 | 4.567786% |
| C | 7531 | 218 | 2.894702% |
| D | 7531 | 372 | 4.939583% |
Noise dominated data is calculated using 1-second bins in cleaned event files. If a bin has >2000 counts, and if more than 50% of those come from <1% of pixels, then it is considered to be noise-dominated and hence unusable.
| Quadrant | # 1 sec bins | Bins with >0 counts | Bins with >2000 counts | High rate bins dominated by noise | Noise dominated (total time) | Noise dominated (detector-on time) | Marked lightcurve |
|---|---|---|---|---|---|---|---|
| A | 7531 | 7531 | 1 | 1 | 0.01% | 0.01% | 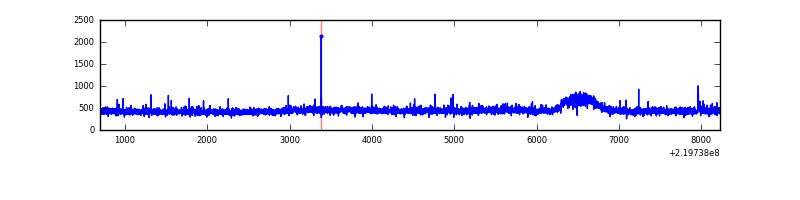 |
| B | 7531 | 7531 | 45 | 45 | 0.60% | 0.60% | 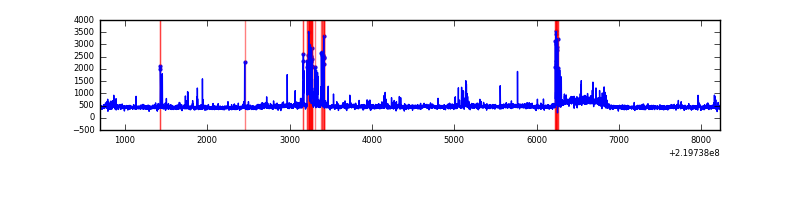 |
| C | 7531 | 7531 | 52 | 52 | 0.69% | 0.69% | 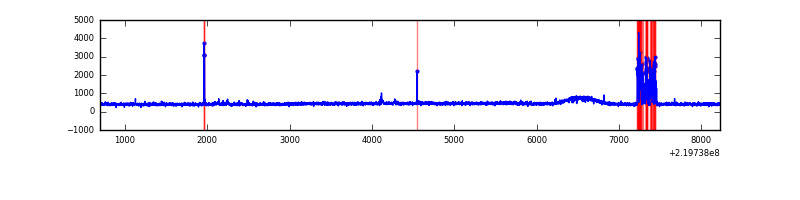 |
| D | 7531 | 7531 | 128 | 128 | 1.70% | 1.70% | 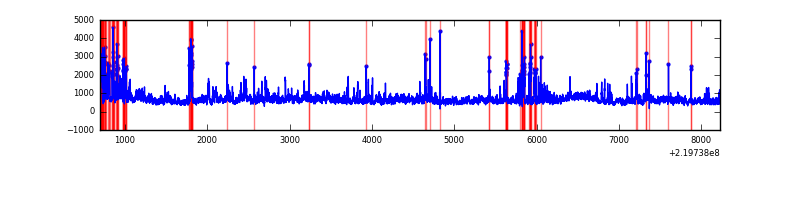 |
Top three noisy pixels from each quadrant. If the there are fewer than three noisy pixels in the level2.evt file, extra rows are filled as -1
| Pixel properties | Quadrant properties | ||||||
|---|---|---|---|---|---|---|---|
| Quadrant | DetID | PixID | Counts | Sigma | Mean | Median | Sigma |
| A | 8 | 15 | 22770 | 123.88 | 862 | 843 | 177.0 |
| A | 14 | 111 | 12141 | 63.83 | 862 | 843 | 177.0 |
| A | 0 | 226 | 8178 | 41.44 | 862 | 843 | 177.0 |
| B | 4 | 48 | 224509 | 1342.3 | 864 | 842 | 166.6 |
| B | 0 | 219 | 106628 | 634.86 | 864 | 842 | 166.6 |
| B | 0 | 214 | 29720 | 173.31 | 864 | 842 | 166.6 |
| C | 9 | 54 | 271089 | 1411.57 | 832 | 833 | 191.5 |
| C | 8 | 128 | 16683 | 82.78 | 832 | 833 | 191.5 |
| C | 8 | 112 | 8935 | 42.32 | 832 | 833 | 191.5 |
| D | 8 | 195 | 1414701 | 6977.35 | 827 | 797 | 202.6 |
| D | 2 | 33 | 558042 | 2749.9 | 827 | 797 | 202.6 |
| D | 14 | 34 | 224180 | 1102.35 | 827 | 797 | 202.6 |
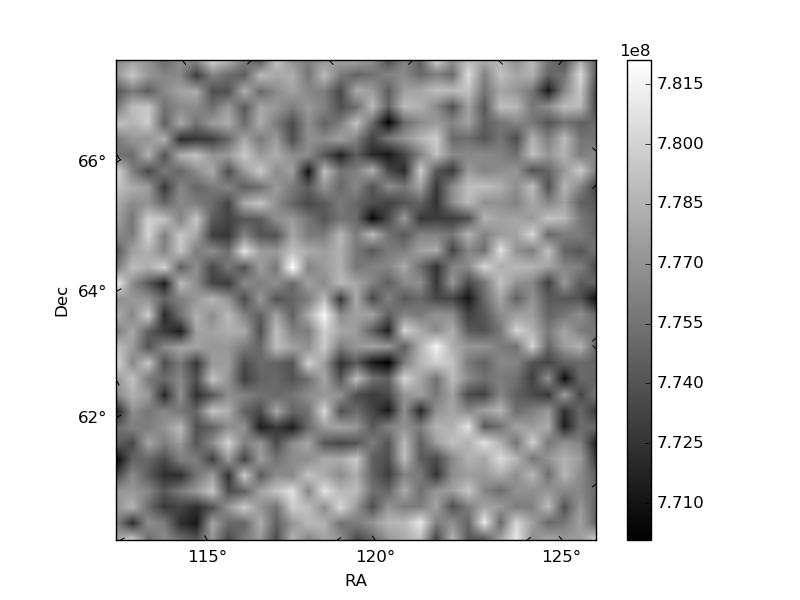
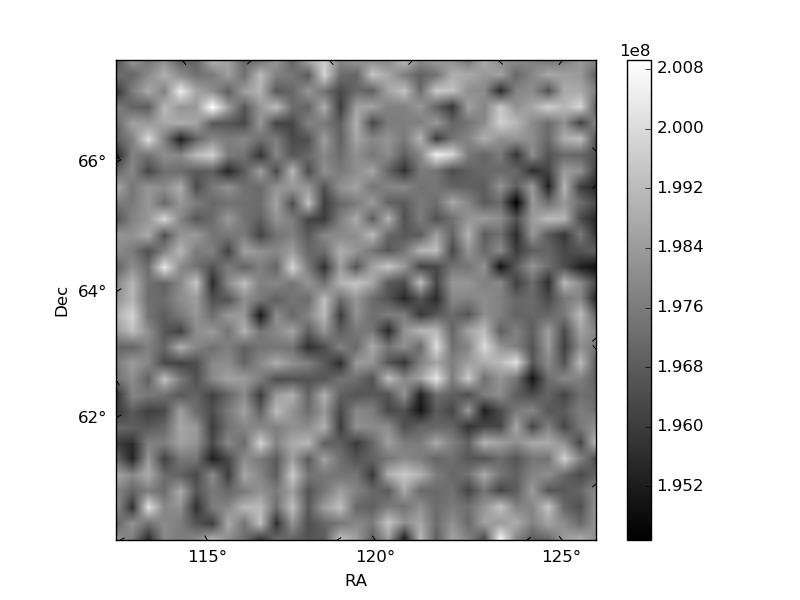
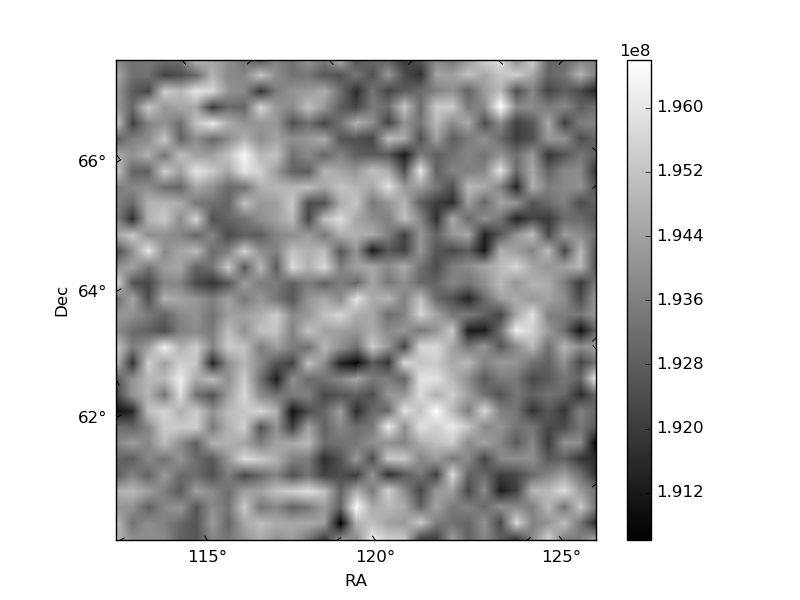
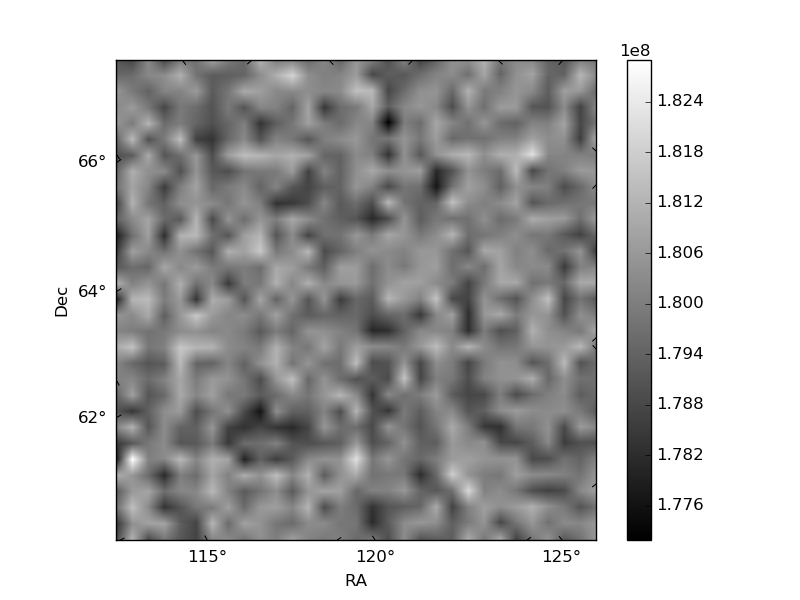
Histogram calculated using DETX and DETY for each event in the final _common_clean file
| Quadrant A | 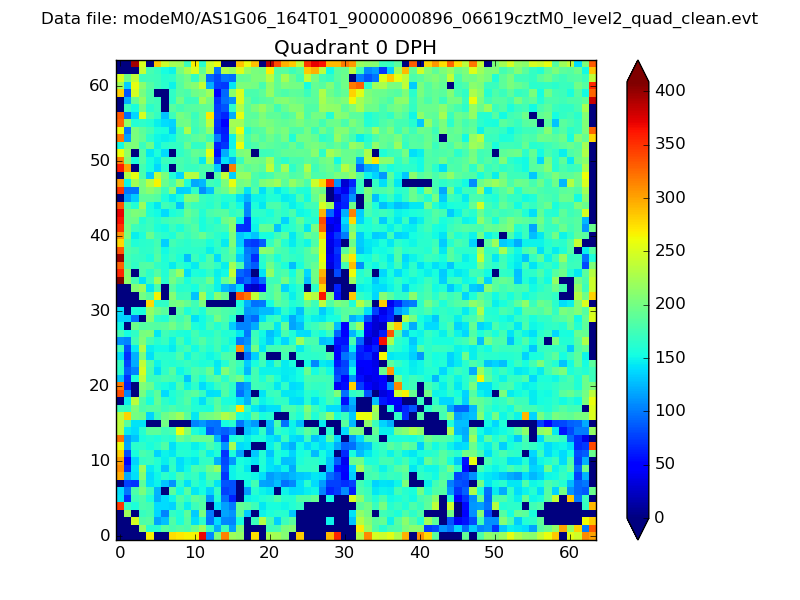 |
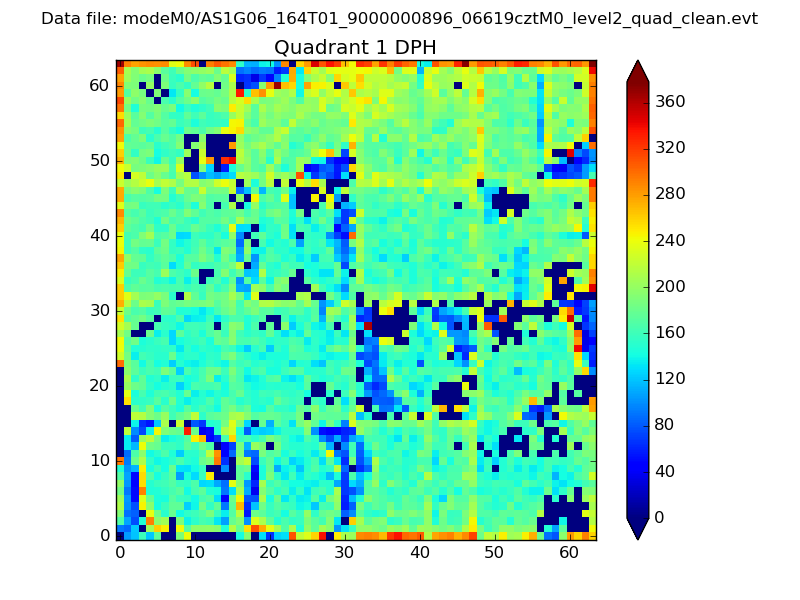 |
Quadrant B |
|---|---|---|---|
| Quadrant D |  |
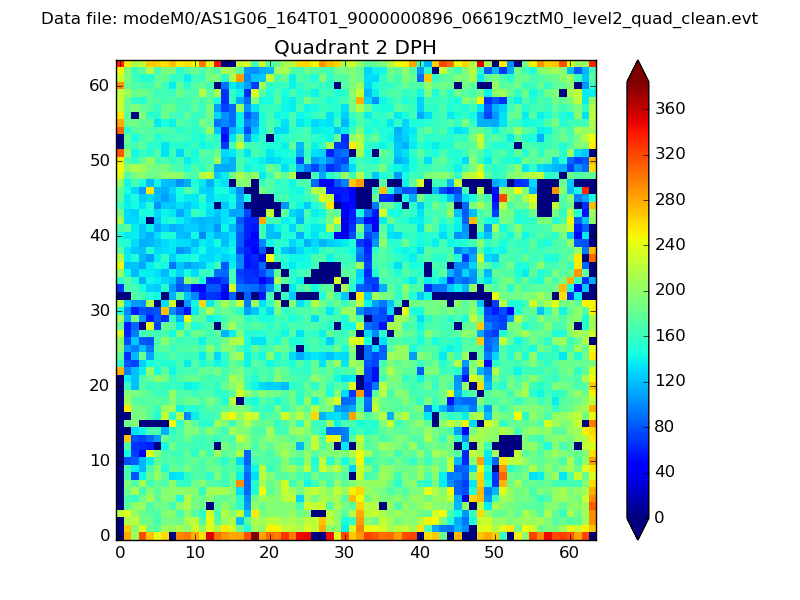 |
Quadrant C |
| Plot type | Count rate plots | Images |
|---|---|---|
| Comparison with Poisson distribution Blue bars denote a histogram of data divided into 1 sec bins. Red curve is a Poisson curve with rate = median count rate of data. |
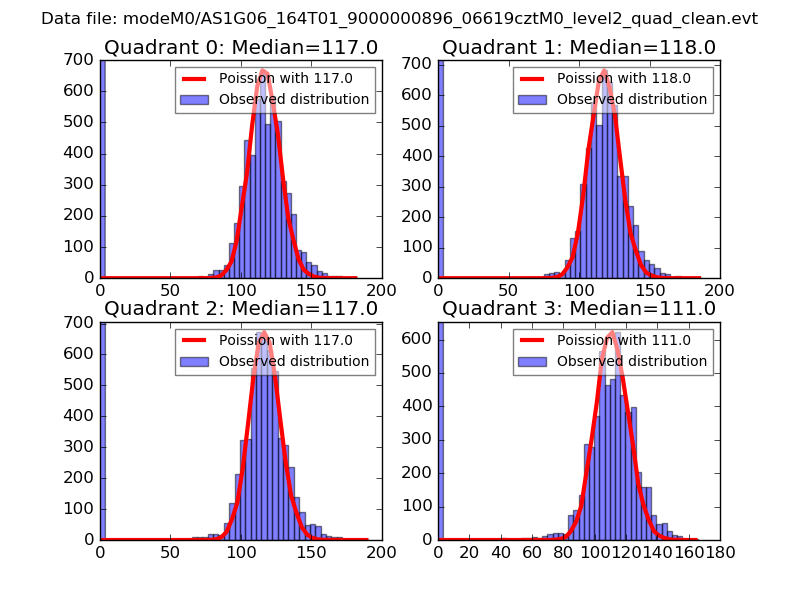 |
 |
| Quadrant-wise count rates Data is divided into 100 sec bins |
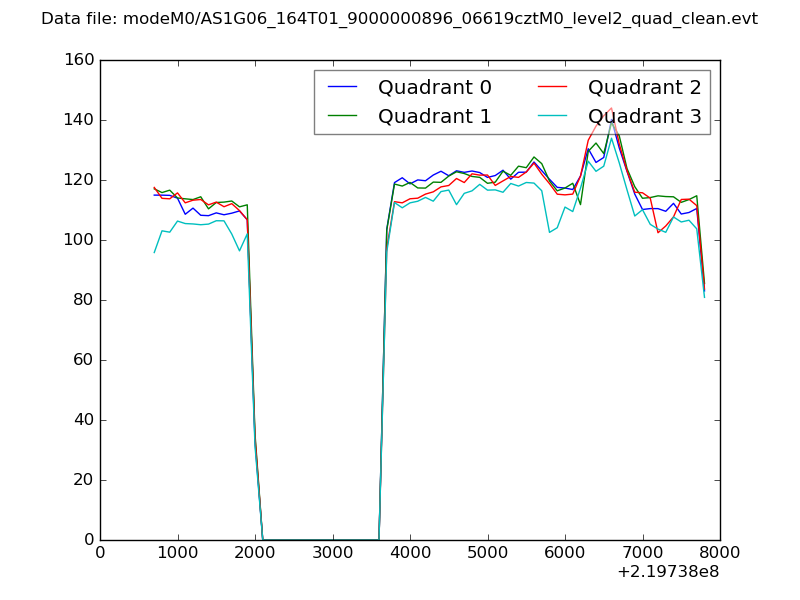 |
|
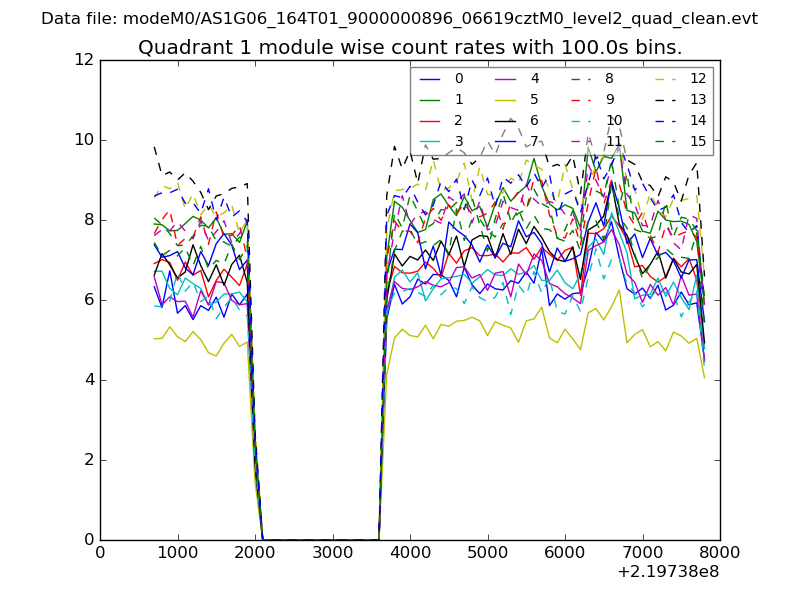
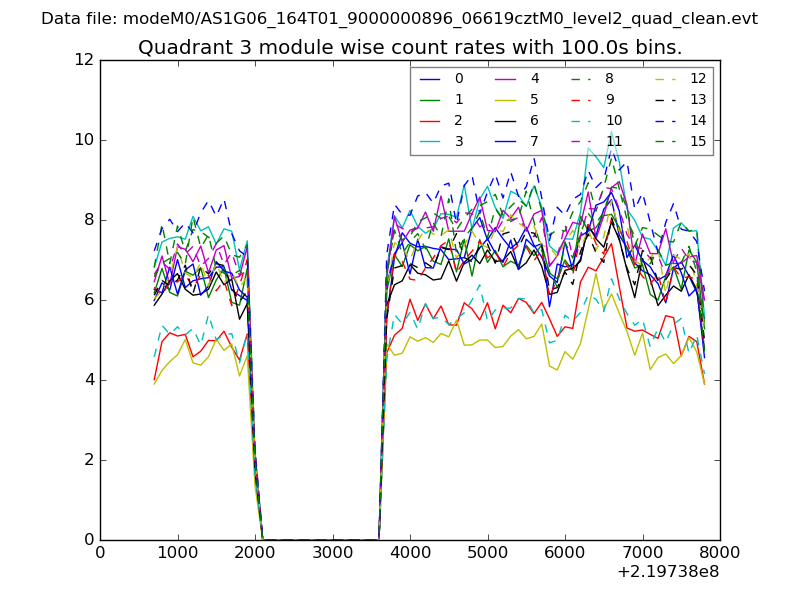
| Module-wise count rates for Quadrant A Data is divided into 100 sec bins |
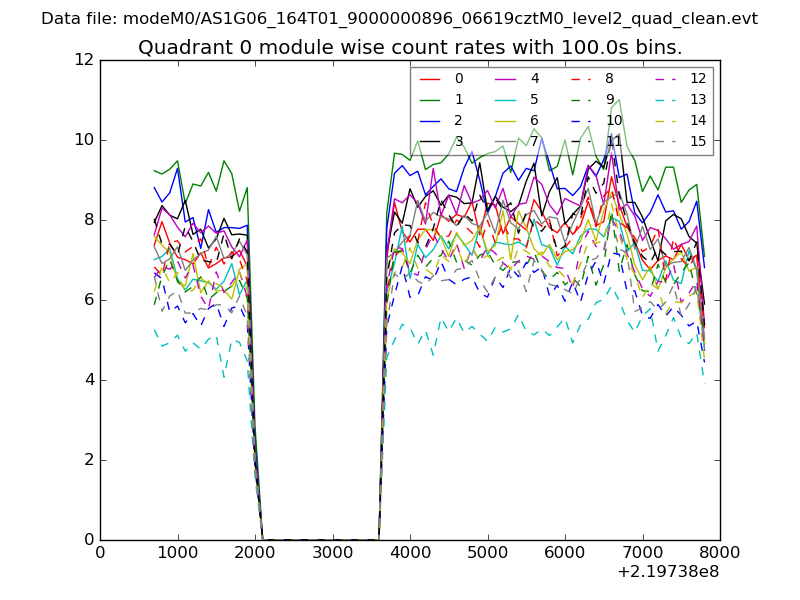 |
 |
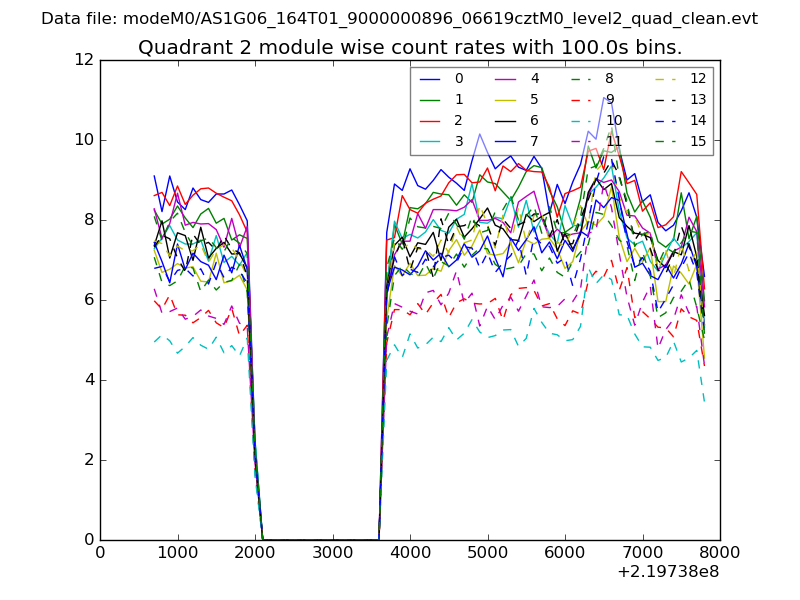
| Module-wise count rates for Quadrant B Data is divided into 100 sec bins |
 |
 |
| Module-wise count rates for Quadrant C Data is divided into 100 sec bins |
 |
 |
| Module-wise count rates for Quadrant D Data is divided into 100 sec bins |
 |
 |
| Parameter | Plot |
|---|---|
| CZT HV Monitor | 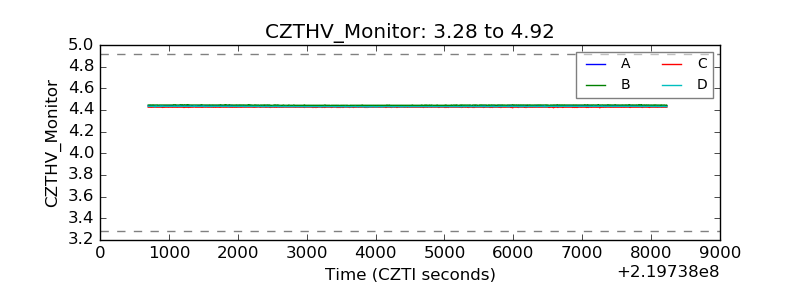 |
| D_VDD | 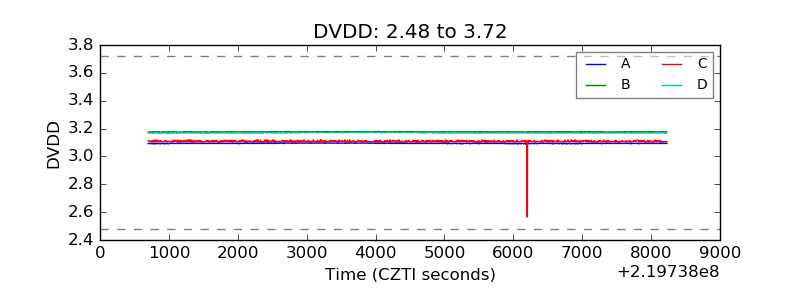 |
| Temperature 1 | 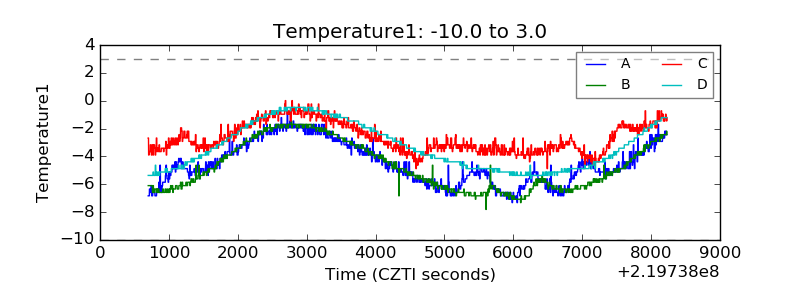 |
| Veto HV Monitor | 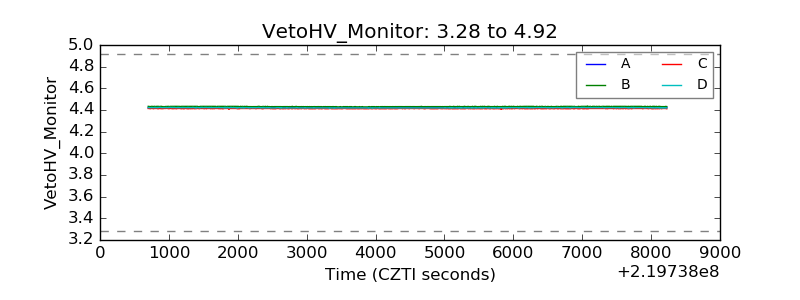 |
| Veto LLD | 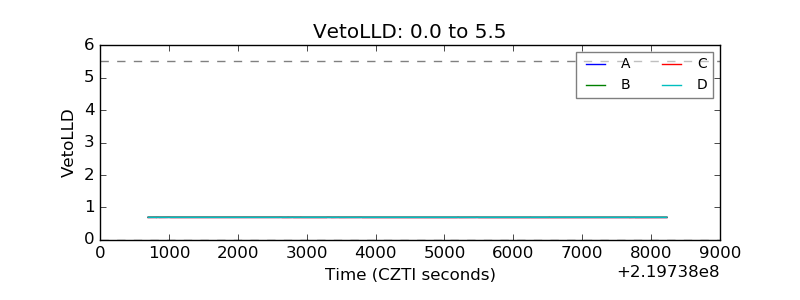 |
| Alpha Counter | 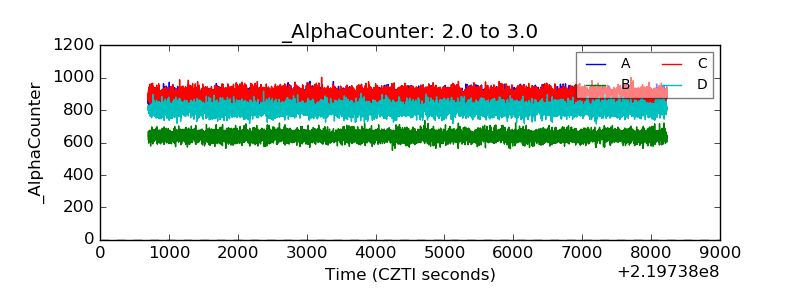 |
| _CPM_Rate | 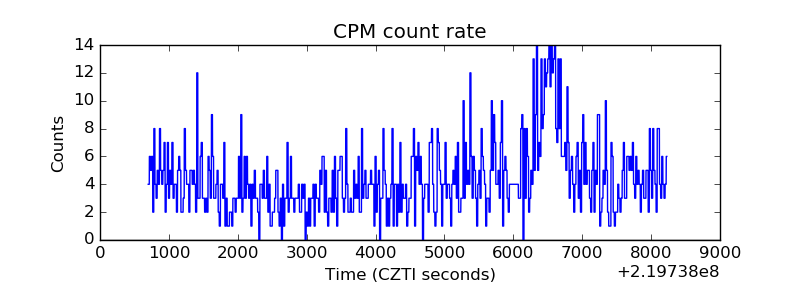 |
| CZT Counter | 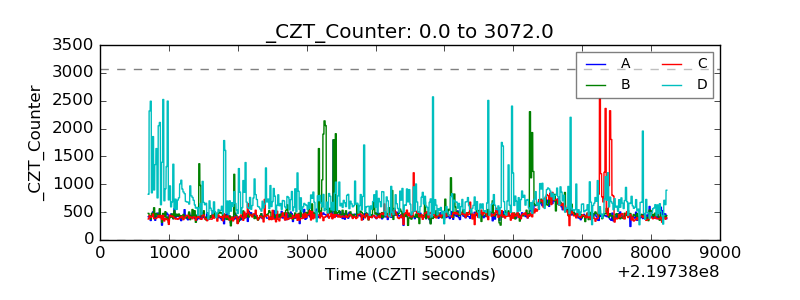 |
| +2.5 Volts monitor |  |
| +5 Volts monitor |  |
| _ROLL_ROT | 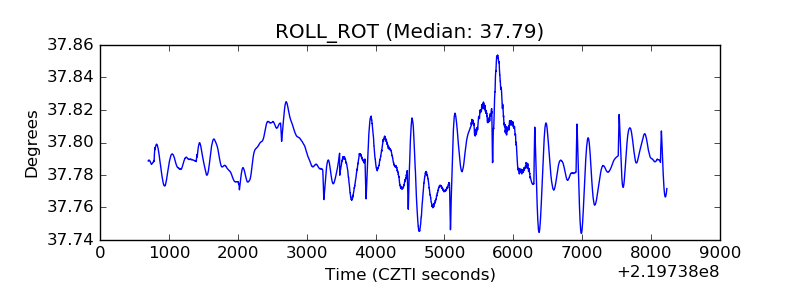 |
| _Roll_DEC | 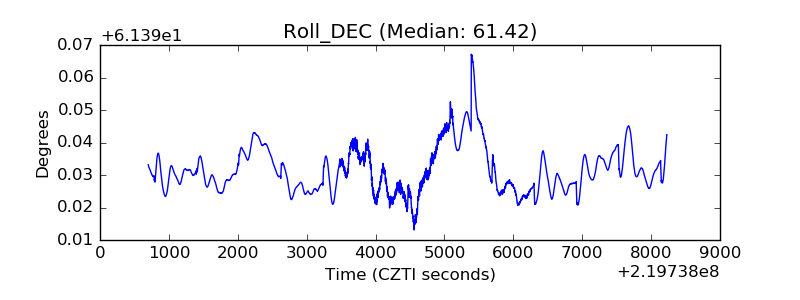 |
| _Roll_RA | 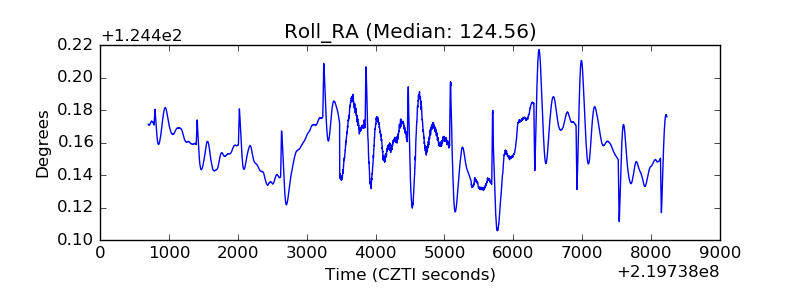 |
| Veto Counter | 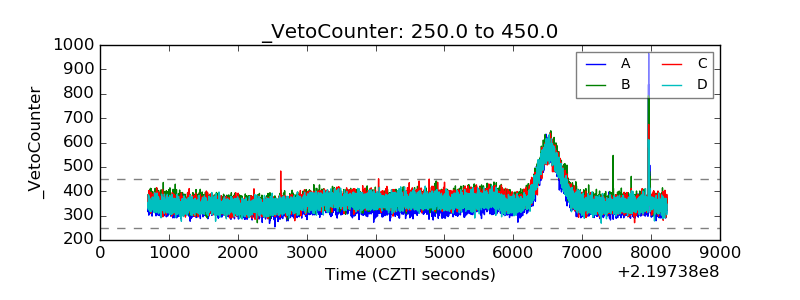 |