| Param | Original file | Final file |
|---|---|---|
| Filename | modeM0/AS1G06_164T01_9000000896_06620cztM0_level2.evt | modeM0/AS1G06_164T01_9000000896_06620cztM0_level2_quad_clean.evt |
| Size (bytes) | 502,200,000 | 86,546,880 |
| Size | 478.9 MB | 82.5 MB |
| Events in quadrant A | 3,154,207 | 540,277 |
| Events in quadrant B | 3,540,468 | 541,580 |
| Events in quadrant C | 3,285,237 | 532,456 |
| Events in quadrant D | 4,744,719 | 509,460 |
| Mode M0 | |||
|---|---|---|---|
| Quadrant | BADHDUFLAG | Total packets | Discarded packets |
| A | 0 | 14831 | 394 |
| B | 0 | 15732 | 416 |
| C | 0 | 15461 | 413 |
| D | 0 | 19473 | 456 |
| Mode M9 | |||
|---|---|---|---|
| Quadrant | BADHDUFLAG | Total packets | Discarded packets |
| A | 1 | 251318637792 | 0 |
| B | 1 | -1 | -1 |
| C | 1 | -1 | -1 |
| D | 1 | -1 | -1 |
| Mode SS | |||
|---|---|---|---|
| Quadrant | BADHDUFLAG | Total packets | Discarded packets |
| A | 0 | 146 | 2 |
| B | 0 | 146 | 4 |
| C | 0 | 146 | 2 |
| D | 0 | 146 | 4 |
| Quadrant | Total seconds | Saturated seconds | Saturation percentage |
|---|---|---|---|
| A | 7138 | 17 | 0.238162% |
| B | 7141 | 57 | 0.798208% |
| C | 7135 | 62 | 0.868956% |
| D | 7134 | 111 | 1.555929% |
Noise dominated data is calculated using 1-second bins in cleaned event files. If a bin has >2000 counts, and if more than 50% of those come from <1% of pixels, then it is considered to be noise-dominated and hence unusable.
| Quadrant | # 1 sec bins | Bins with >0 counts | Bins with >2000 counts | High rate bins dominated by noise | Noise dominated (total time) | Noise dominated (detector-on time) | Marked lightcurve |
|---|---|---|---|---|---|---|---|
| A | 7841 | 7163 | 1 | 1 | 0.01% | 0.01% | 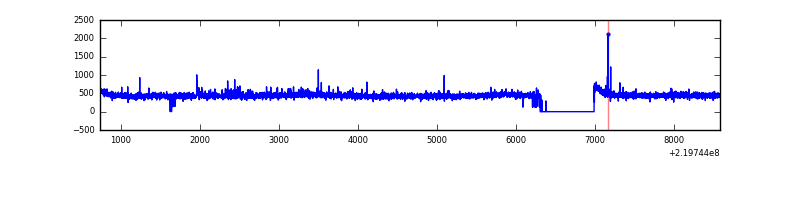 |
| B | 7841 | 7168 | 18 | 18 | 0.23% | 0.25% | 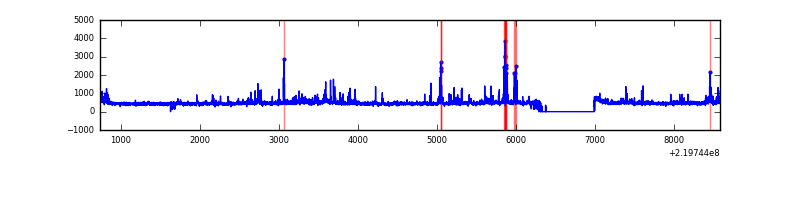 |
| C | 7840 | 7159 | 53 | 53 | 0.68% | 0.74% | 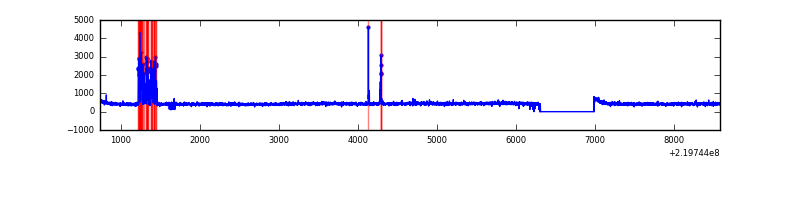 |
| D | 7840 | 7168 | 84 | 84 | 1.07% | 1.17% |  |
Top three noisy pixels from each quadrant. If the there are fewer than three noisy pixels in the level2.evt file, extra rows are filled as -1
| Pixel properties | Quadrant properties | ||||||
|---|---|---|---|---|---|---|---|
| Quadrant | DetID | PixID | Counts | Sigma | Mean | Median | Sigma |
| A | 8 | 15 | 46988 | 280.59 | 804 | 784 | 164.7 |
| A | 14 | 111 | 12163 | 69.1 | 804 | 784 | 164.7 |
| A | 0 | 226 | 7527 | 40.95 | 804 | 784 | 164.7 |
| B | 0 | 219 | 111196 | 713.53 | 807 | 787 | 154.7 |
| B | 15 | 204 | 85697 | 548.74 | 807 | 787 | 154.7 |
| B | 4 | 48 | 79388 | 507.96 | 807 | 787 | 154.7 |
| C | 9 | 54 | 257583 | 1443.72 | 769 | 771 | 177.9 |
| C | 8 | 128 | 10831 | 56.55 | 769 | 771 | 177.9 |
| C | 1 | 16 | 7063 | 35.37 | 769 | 771 | 177.9 |
| D | 8 | 195 | 1221033 | 6423.61 | 770 | 744 | 190.0 |
| D | 2 | 33 | 280920 | 1474.85 | 770 | 744 | 190.0 |
| D | 14 | 34 | 150409 | 787.84 | 770 | 744 | 190.0 |
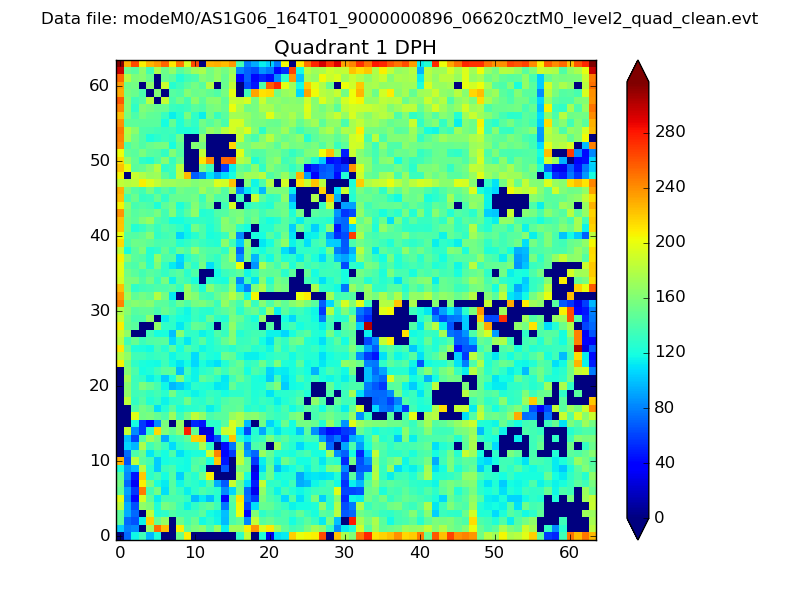
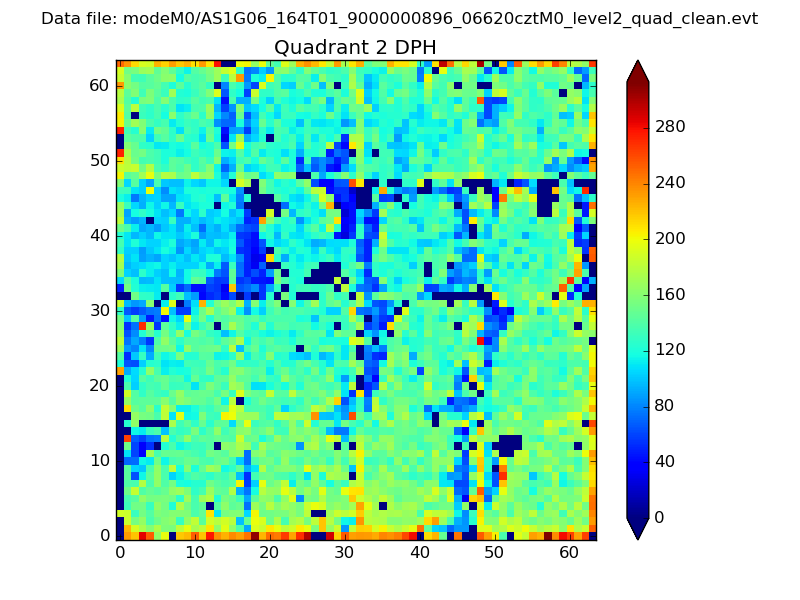
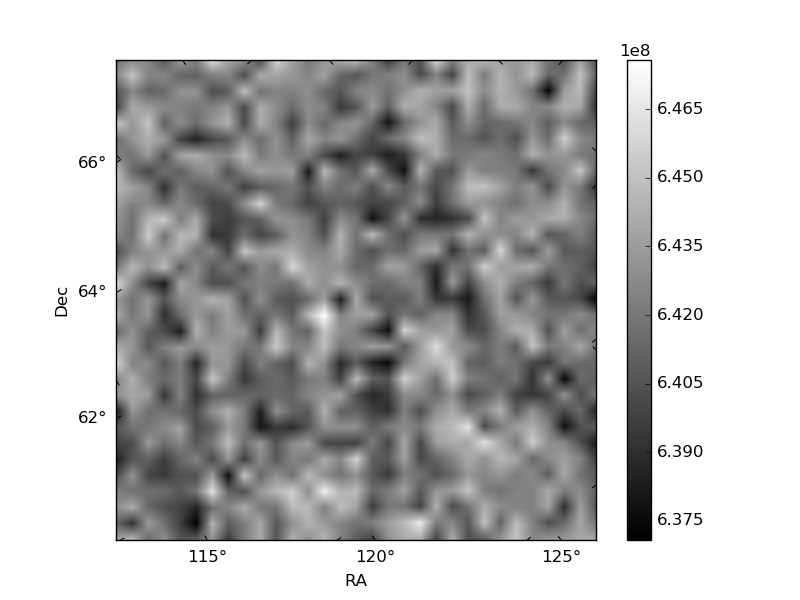
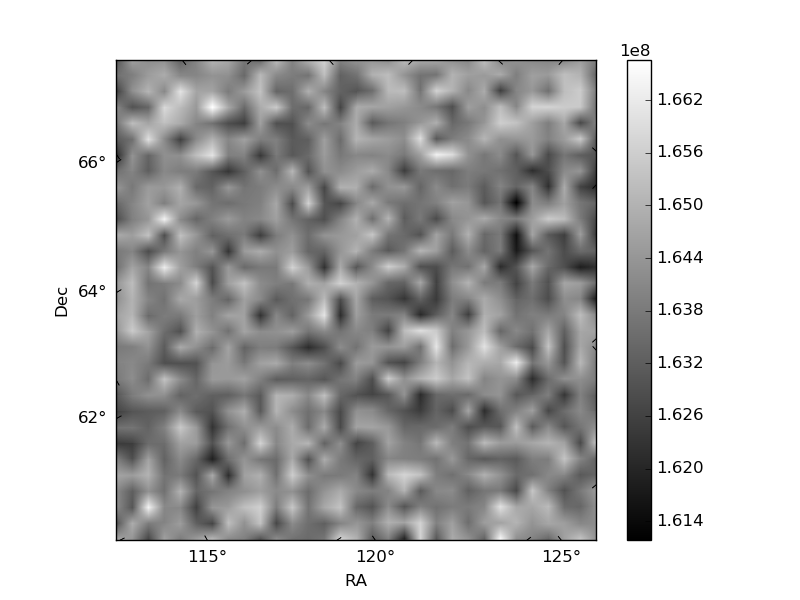
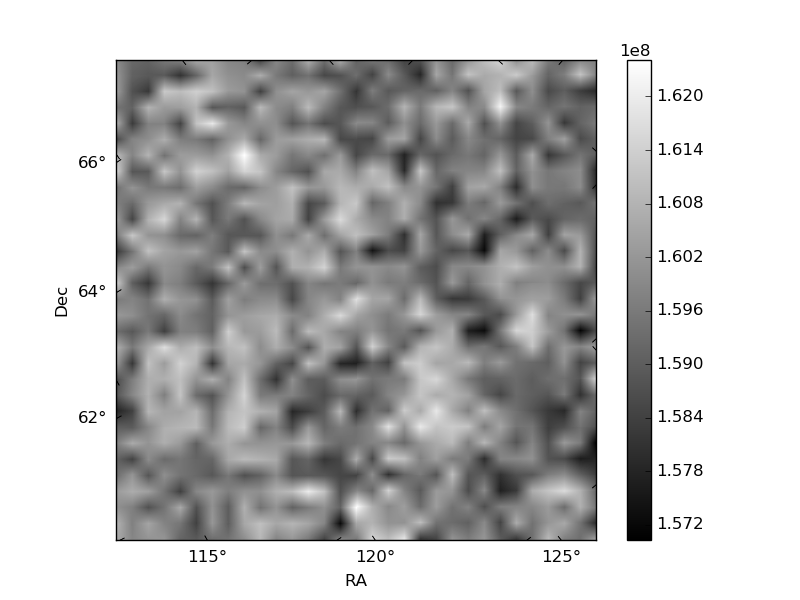
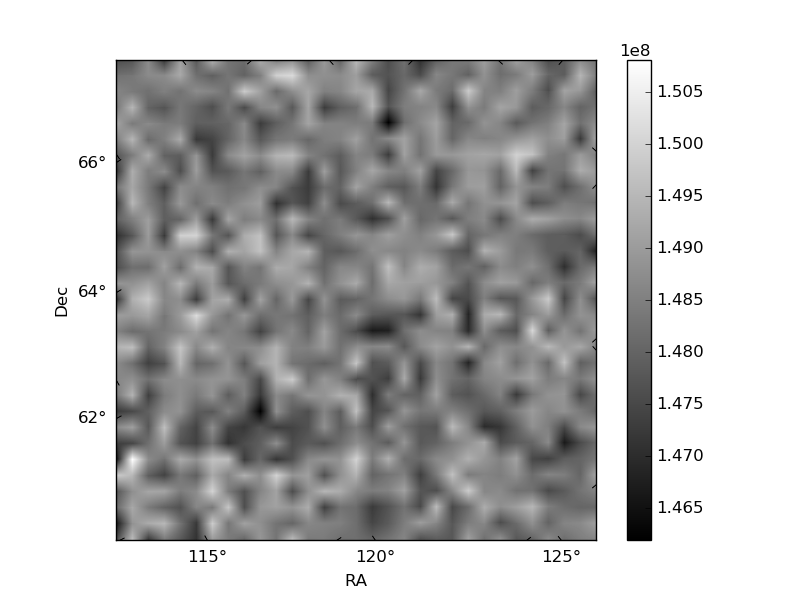
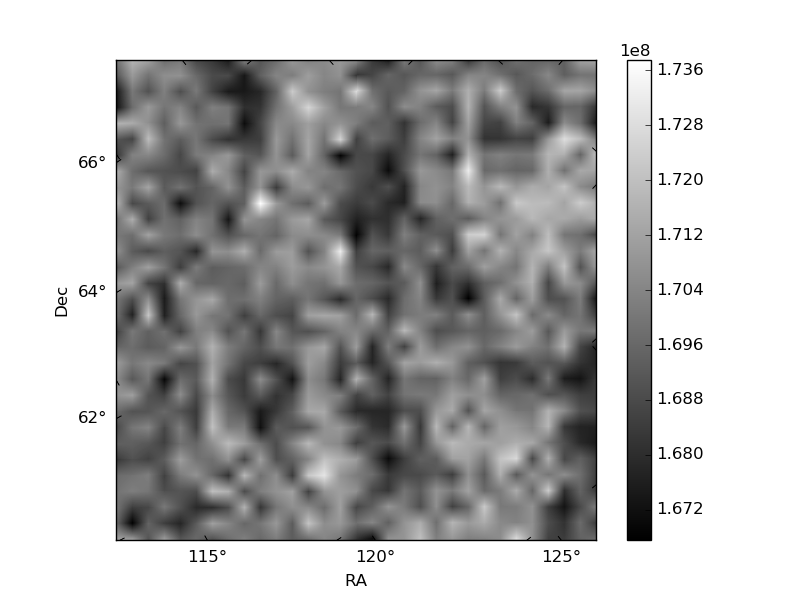
Histogram calculated using DETX and DETY for each event in the final _common_clean file
| Quadrant A | 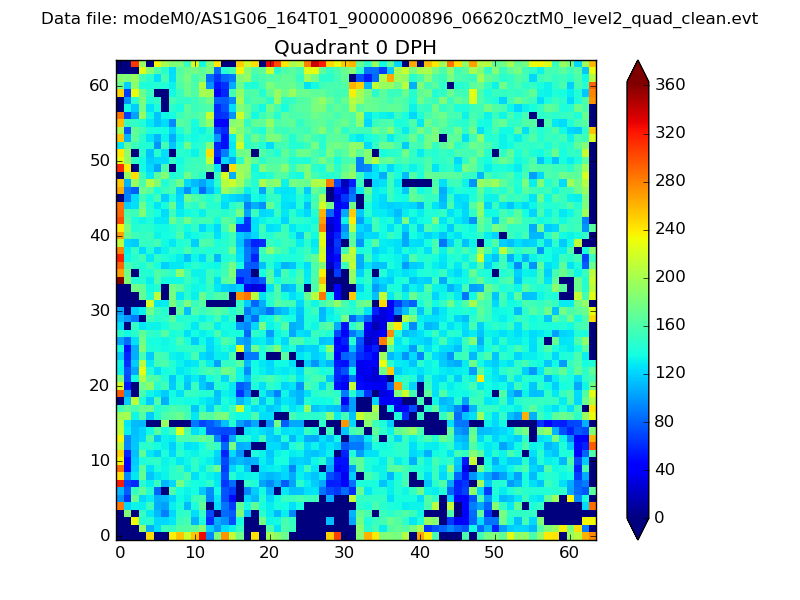 |
 |
Quadrant B |
|---|---|---|---|
| Quadrant D | 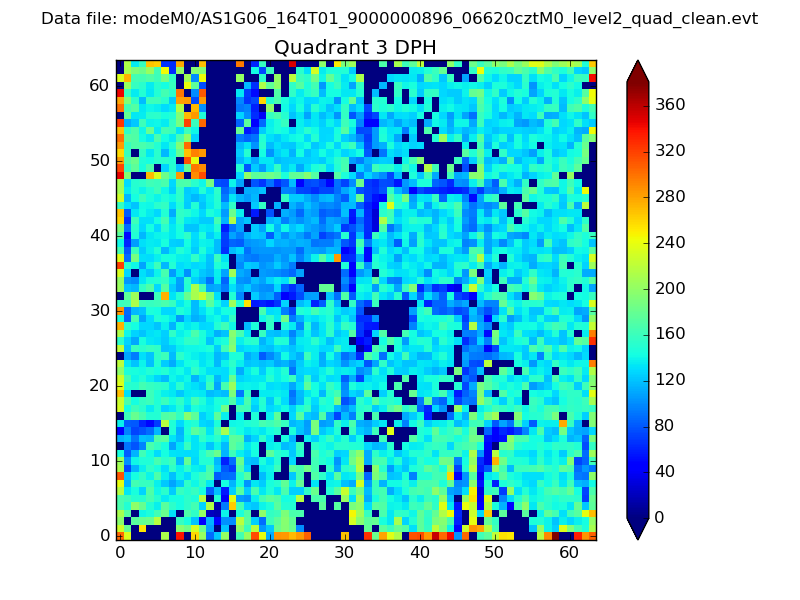 |
 |
Quadrant C |
| Plot type | Count rate plots | Images |
|---|---|---|
| Comparison with Poisson distribution Blue bars denote a histogram of data divided into 1 sec bins. Red curve is a Poisson curve with rate = median count rate of data. |
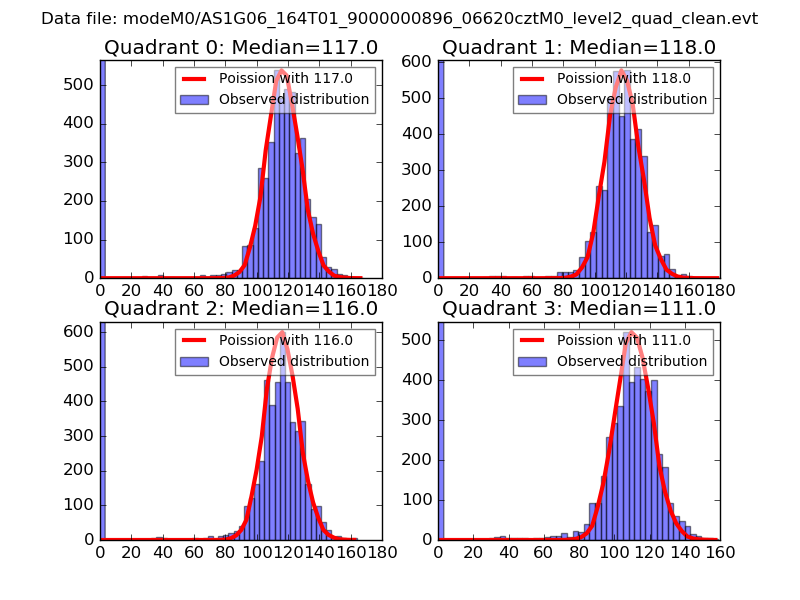 |
 |
| Quadrant-wise count rates Data is divided into 100 sec bins |
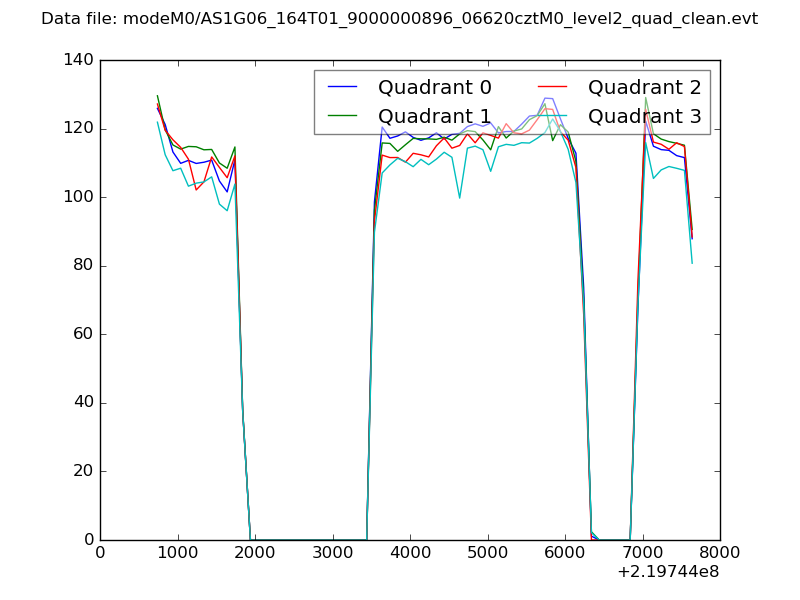 |
|
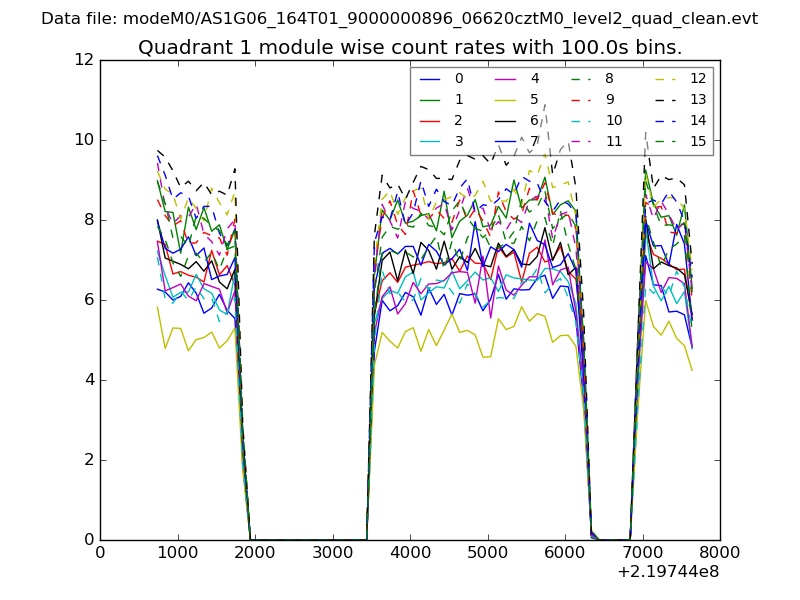
| Module-wise count rates for Quadrant A Data is divided into 100 sec bins |
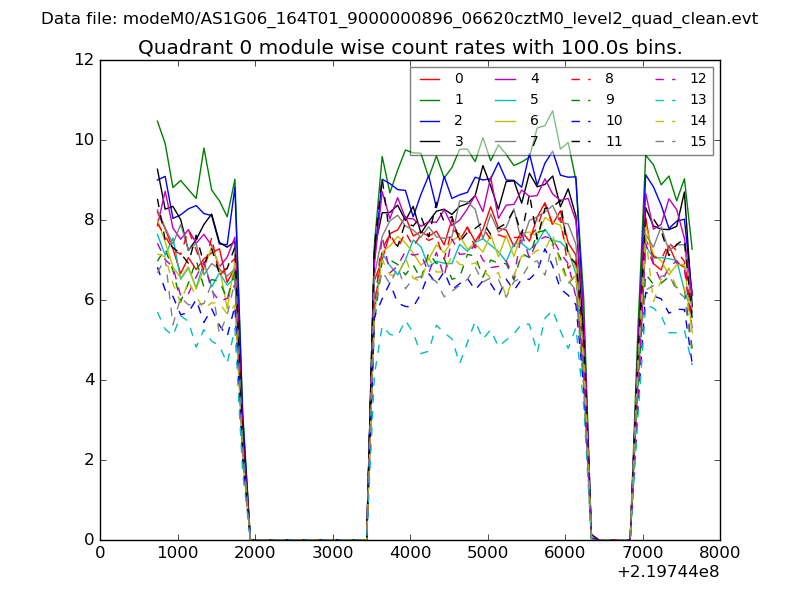 |
 |
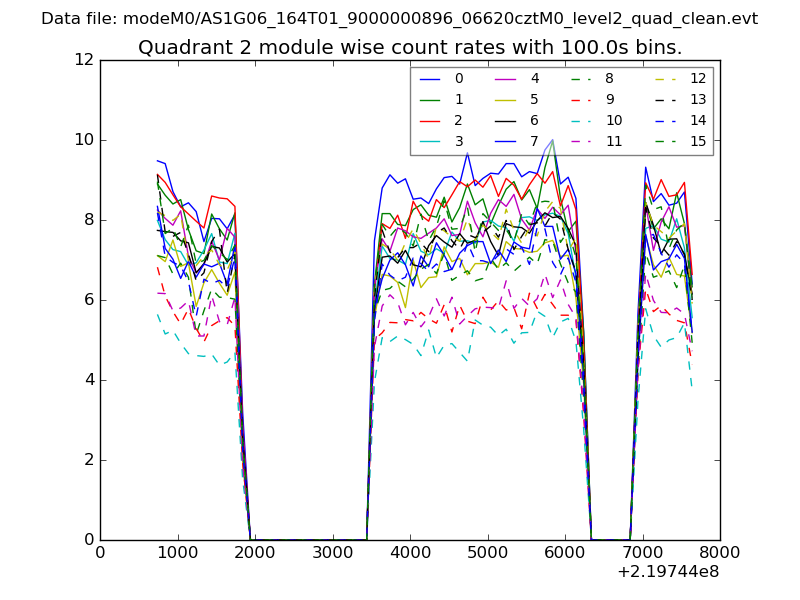
| Module-wise count rates for Quadrant B Data is divided into 100 sec bins |
 |
 |
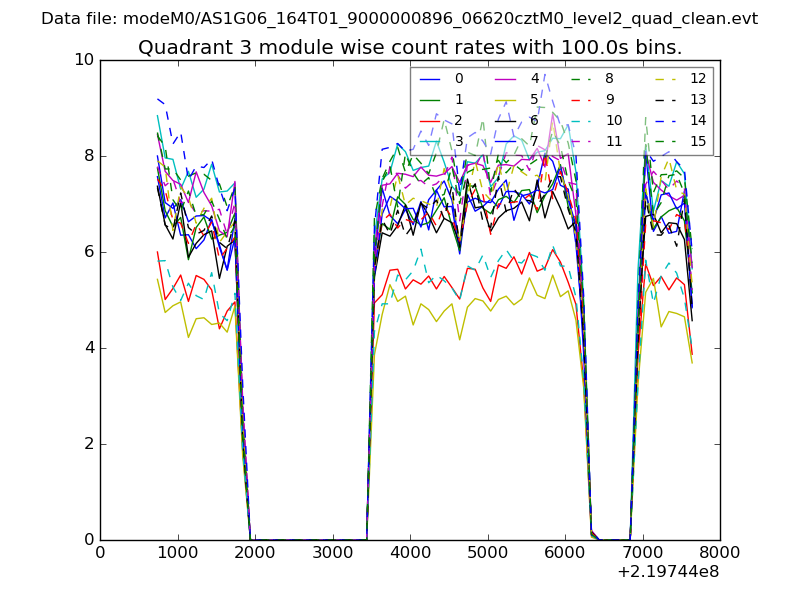
| Module-wise count rates for Quadrant C Data is divided into 100 sec bins |
 |
 |
| Module-wise count rates for Quadrant D Data is divided into 100 sec bins |
 |
 |
| Parameter | Plot |
|---|---|
| CZT HV Monitor | 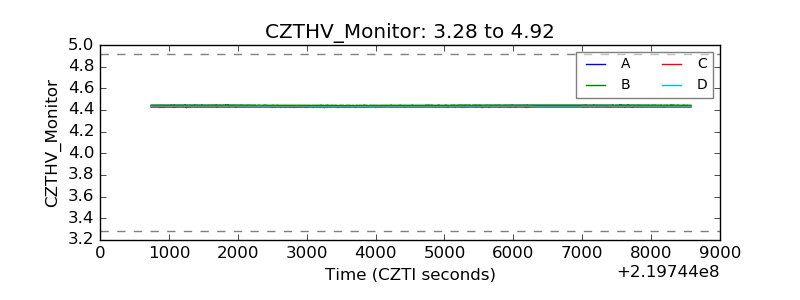 |
| D_VDD | 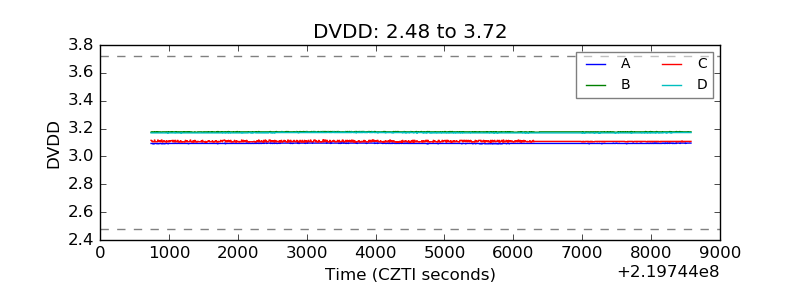 |
| Temperature 1 | 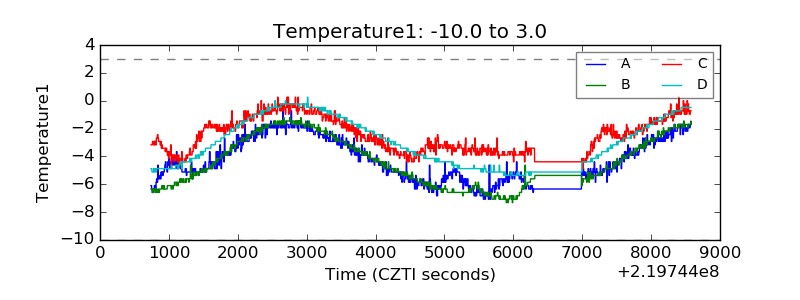 |
| Veto HV Monitor | 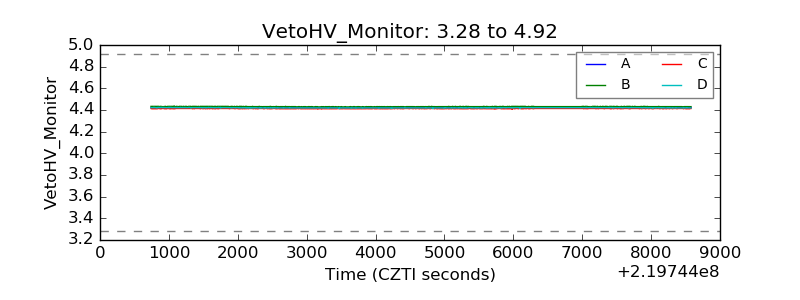 |
| Veto LLD | 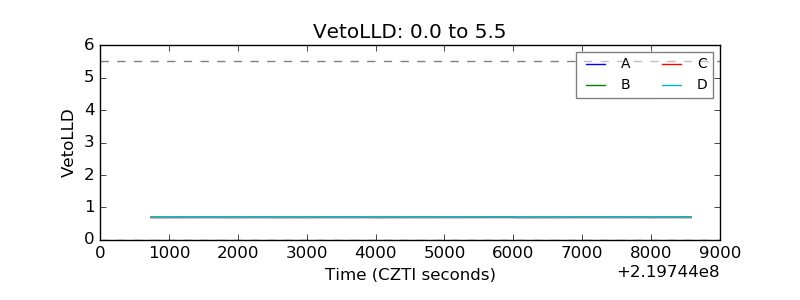 |
| Alpha Counter | 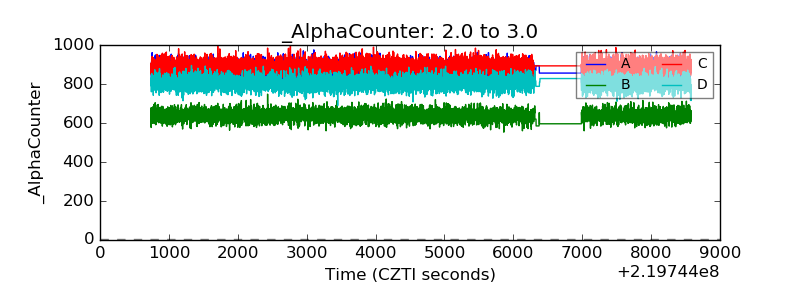 |
| _CPM_Rate | 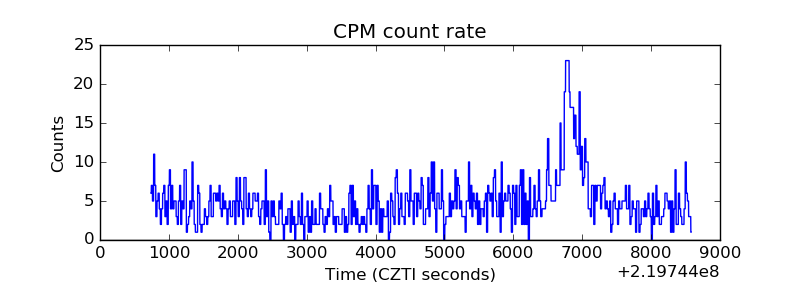 |
| CZT Counter | 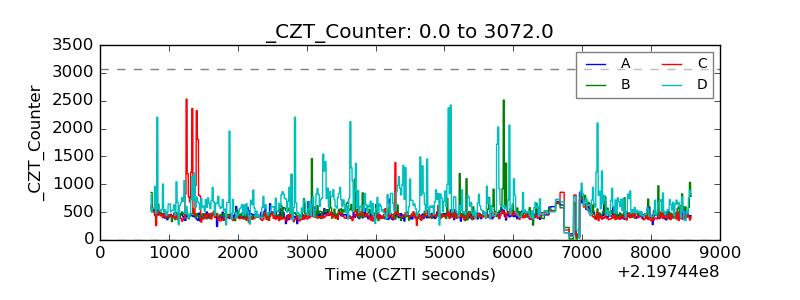 |
| +2.5 Volts monitor |  |
| +5 Volts monitor |  |
| _ROLL_ROT | 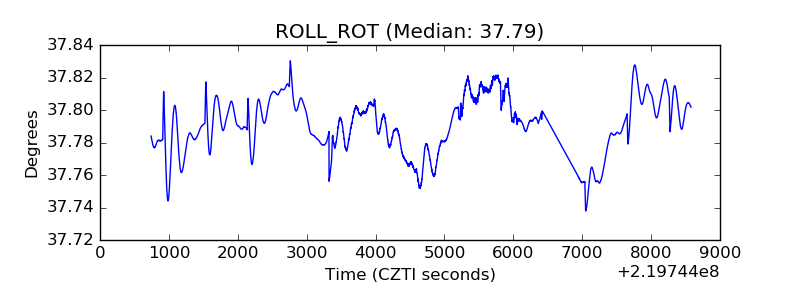 |
| _Roll_DEC | 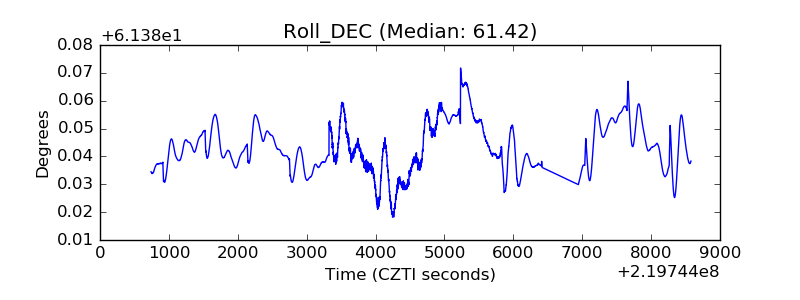 |
| _Roll_RA | 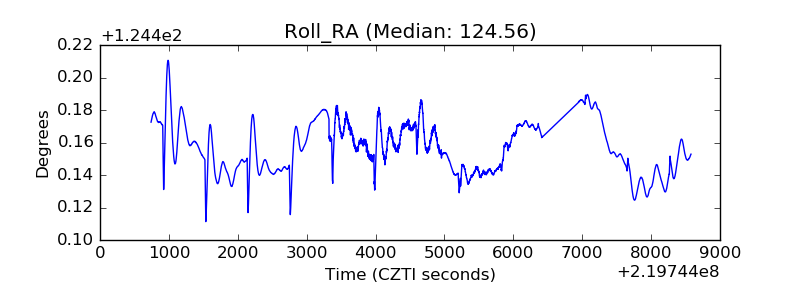 |
| Veto Counter | 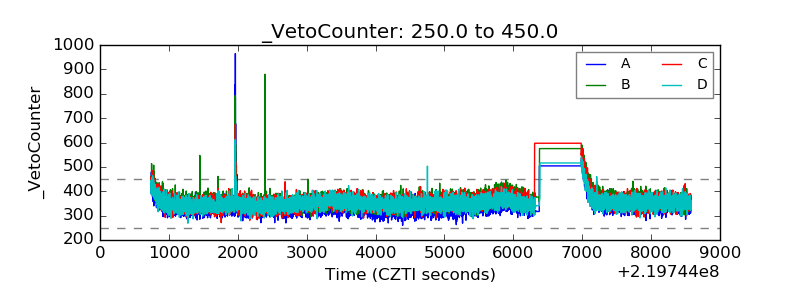 |