| Param | Original file | Final file |
|---|---|---|
| Filename | modeM0/AS1G06_164T01_9000000896_06623cztM0_level2.evt | modeM0/AS1G06_164T01_9000000896_06623cztM0_level2_quad_clean.evt |
| Size (bytes) | 803,283,840 | 145,670,400 |
| Size | 766.1 MB | 138.9 MB |
| Events in quadrant A | 4,982,143 | 926,933 |
| Events in quadrant B | 5,856,344 | 919,853 |
| Events in quadrant C | 4,866,437 | 910,344 |
| Events in quadrant D | 7,860,997 | 875,981 |
| Mode M0 | |||
|---|---|---|---|
| Quadrant | BADHDUFLAG | Total packets | Discarded packets |
| A | 0 | 22867 | 2 |
| B | 0 | 24989 | 2 |
| C | 0 | 22867 | 2 |
| D | 0 | 31207 | 2 |
| Mode M9 | |||
|---|---|---|---|
| Quadrant | BADHDUFLAG | Total packets | Discarded packets |
| A | 0 | 5 | 0 |
| B | 0 | 5 | 0 |
| C | 0 | 5 | 0 |
| D | 0 | 5 | 0 |
| Mode SS | |||
|---|---|---|---|
| Quadrant | BADHDUFLAG | Total packets | Discarded packets |
| A | 0 | 230 | 0 |
| B | 0 | 230 | 0 |
| C | 0 | 230 | 0 |
| D | 0 | 230 | 0 |
| Quadrant | Total seconds | Saturated seconds | Saturation percentage |
|---|---|---|---|
| A | 11244 | 141 | 1.254002% |
| B | 11244 | 268 | 2.383493% |
| C | 11244 | 114 | 1.013874% |
| D | 11244 | 237 | 2.107791% |
Noise dominated data is calculated using 1-second bins in cleaned event files. If a bin has >2000 counts, and if more than 50% of those come from <1% of pixels, then it is considered to be noise-dominated and hence unusable.
| Quadrant | # 1 sec bins | Bins with >0 counts | Bins with >2000 counts | High rate bins dominated by noise | Noise dominated (total time) | Noise dominated (detector-on time) | Marked lightcurve |
|---|---|---|---|---|---|---|---|
| A | 11774 | 11247 | 3 | 3 | 0.03% | 0.03% | 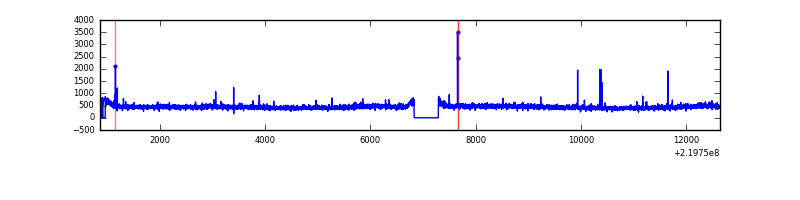 |
| B | 11774 | 11247 | 74 | 74 | 0.63% | 0.66% | 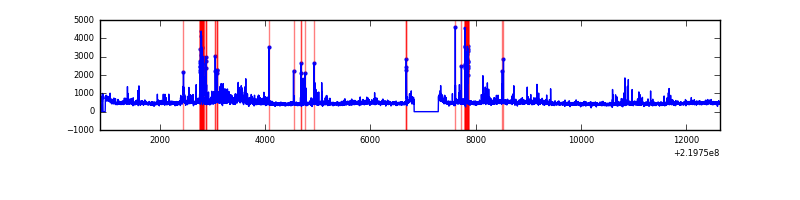 |
| C | 11774 | 11247 | 8 | 8 | 0.07% | 0.07% | 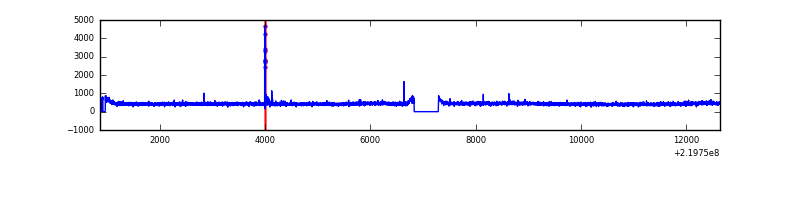 |
| D | 11774 | 11247 | 99 | 99 | 0.84% | 0.88% | 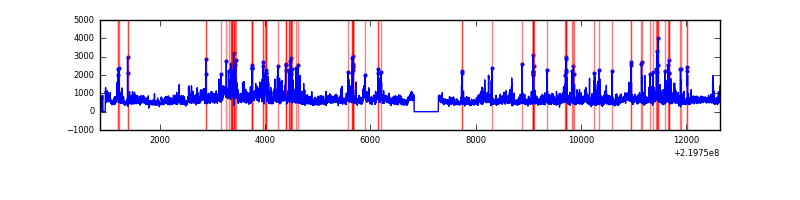 |
Top three noisy pixels from each quadrant. If the there are fewer than three noisy pixels in the level2.evt file, extra rows are filled as -1
| Pixel properties | Quadrant properties | ||||||
|---|---|---|---|---|---|---|---|
| Quadrant | DetID | PixID | Counts | Sigma | Mean | Median | Sigma |
| A | 8 | 15 | 33439 | 124.4 | 1272 | 1246 | 258.8 |
| A | 14 | 111 | 29226 | 108.12 | 1272 | 1246 | 258.8 |
| A | 13 | 251 | 18517 | 66.74 | 1272 | 1246 | 258.8 |
| B | 15 | 204 | 233145 | 960.45 | 1274 | 1241 | 241.5 |
| B | 4 | 48 | 219502 | 903.95 | 1274 | 1241 | 241.5 |
| B | 0 | 219 | 152509 | 626.49 | 1274 | 1241 | 241.5 |
| C | 9 | 54 | 55317 | 190.25 | 1228 | 1231 | 284.3 |
| C | 1 | 16 | 18575 | 61.01 | 1228 | 1231 | 284.3 |
| C | 13 | 61 | 9736 | 29.92 | 1228 | 1231 | 284.3 |
| D | 8 | 195 | 2315826 | 7747.44 | 1227 | 1187 | 298.8 |
| D | 2 | 33 | 298415 | 994.87 | 1227 | 1187 | 298.8 |
| D | 14 | 34 | 272696 | 908.78 | 1227 | 1187 | 298.8 |
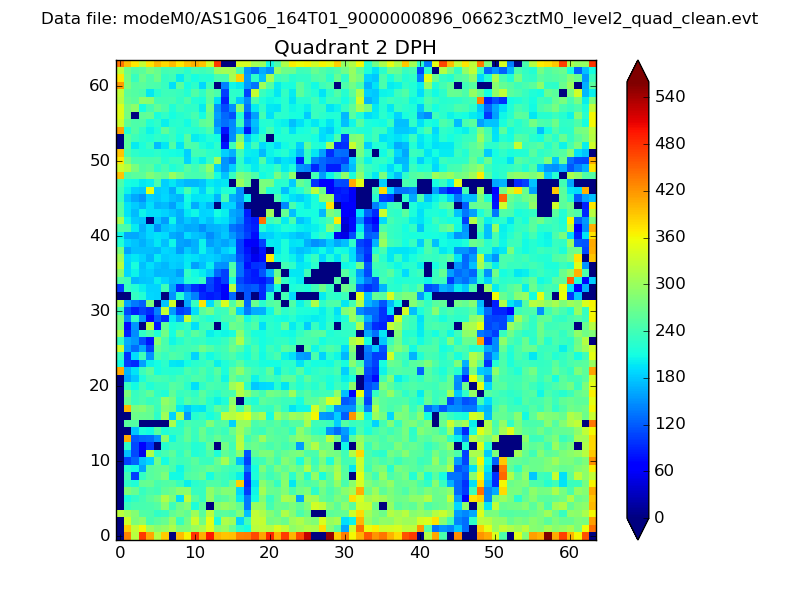
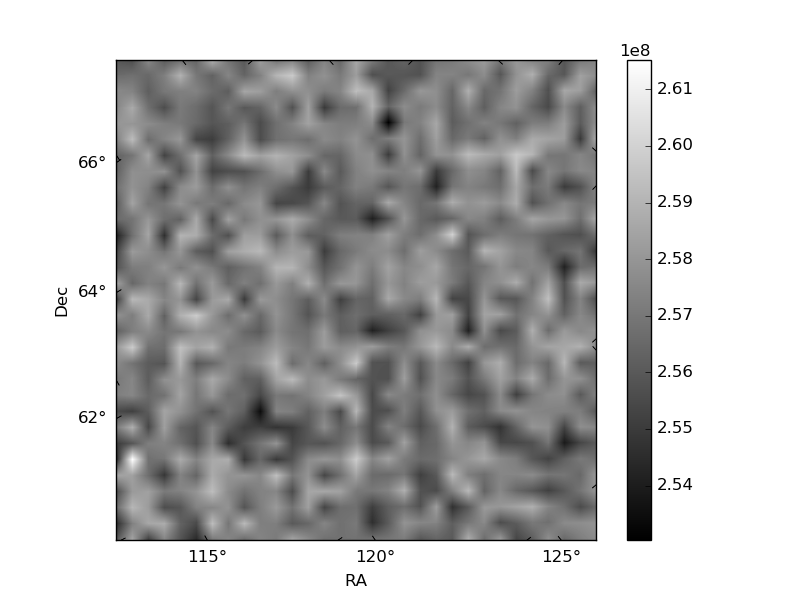
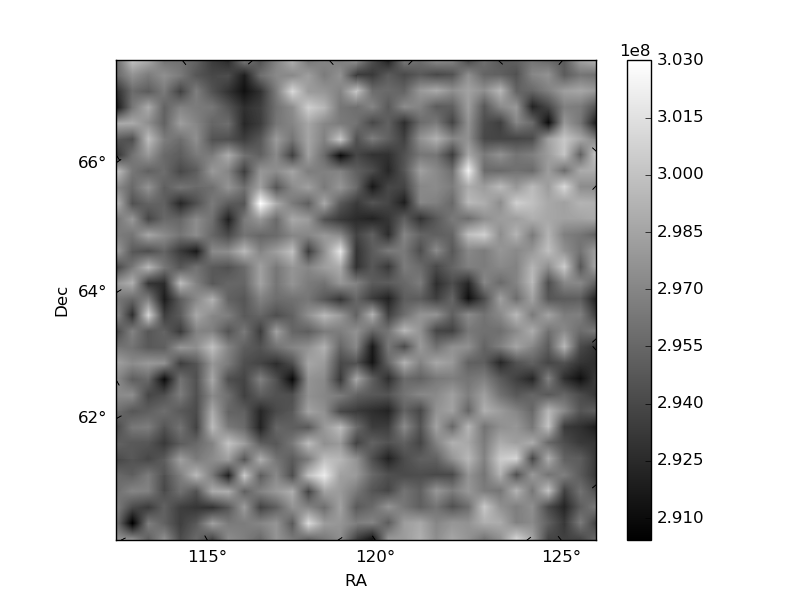
Histogram calculated using DETX and DETY for each event in the final _common_clean file
| Quadrant A | 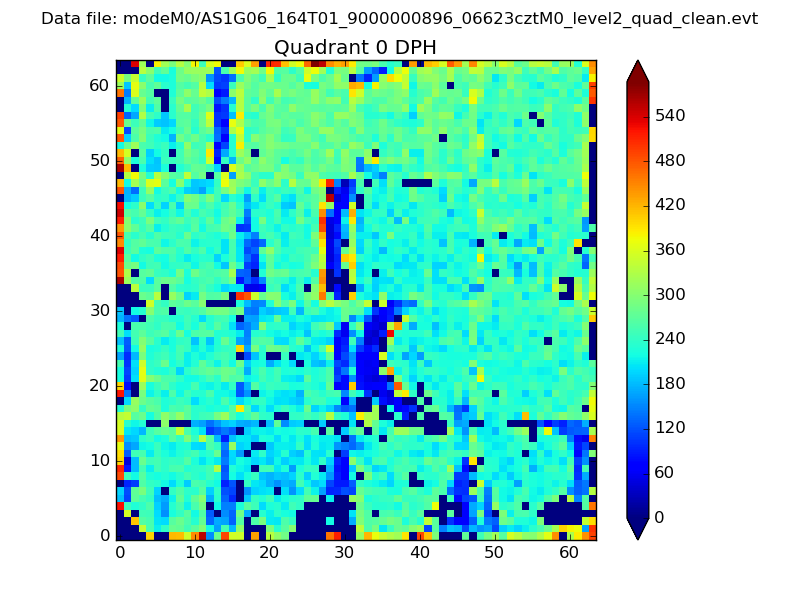 |
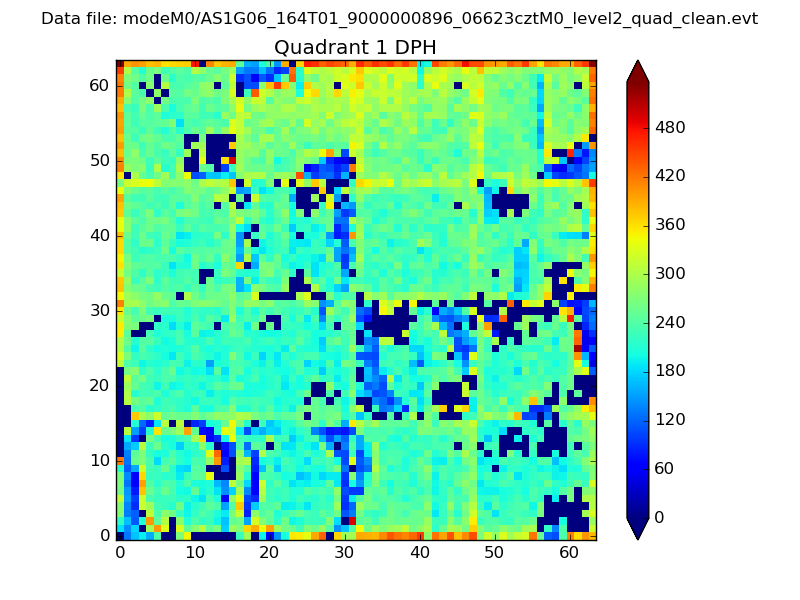 |
Quadrant B |
|---|---|---|---|
| Quadrant D | 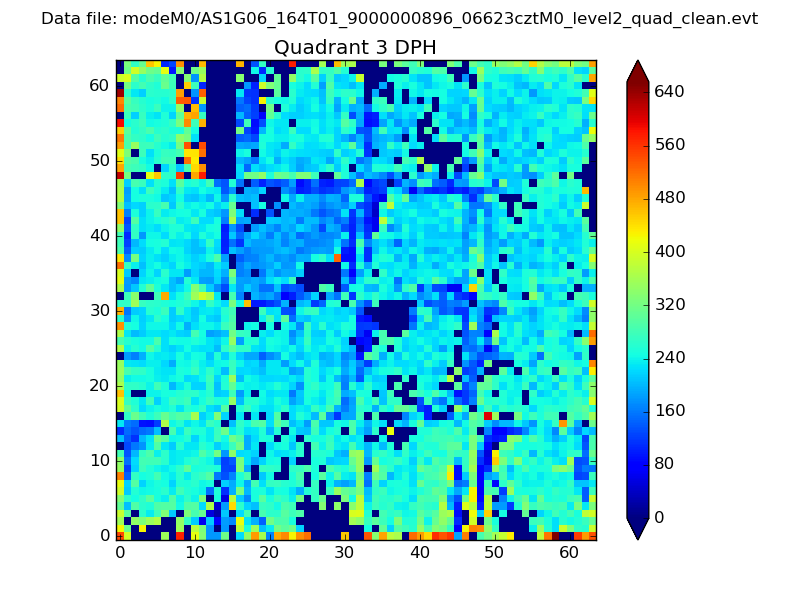 |
 |
Quadrant C |
| Plot type | Count rate plots | Images |
|---|---|---|
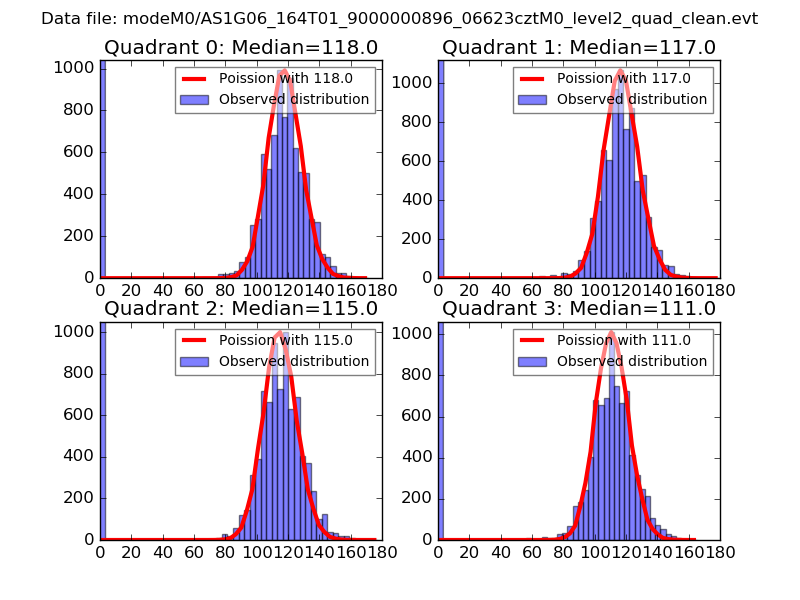
| Comparison with Poisson distribution Blue bars denote a histogram of data divided into 1 sec bins. Red curve is a Poisson curve with rate = median count rate of data. |
 |
 |
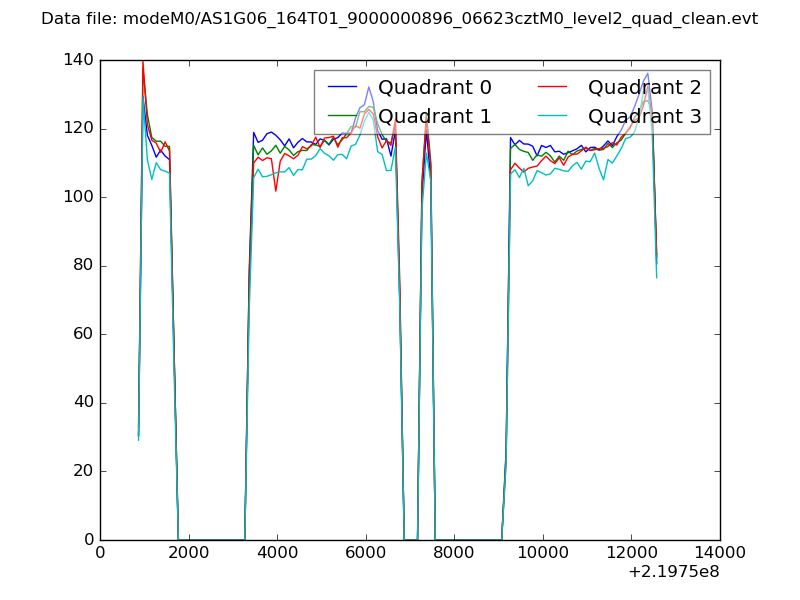
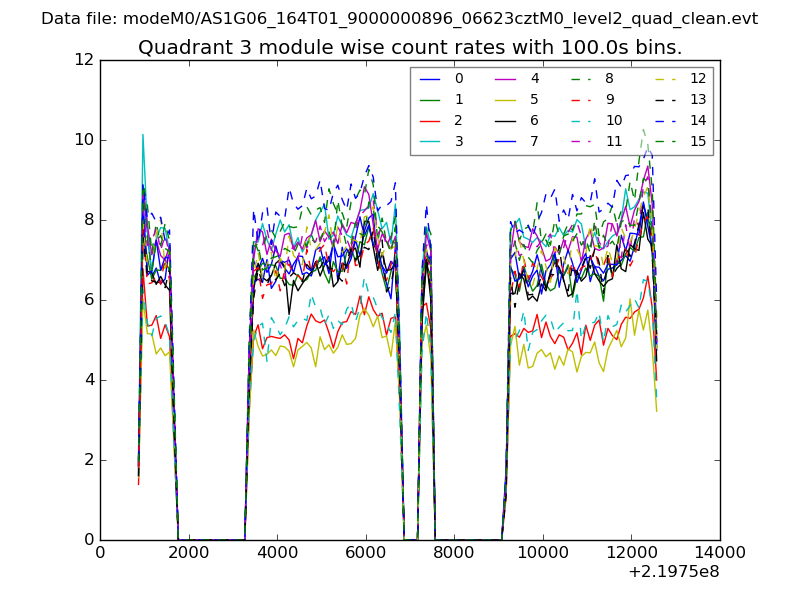
| Quadrant-wise count rates Data is divided into 100 sec bins |
 |
|
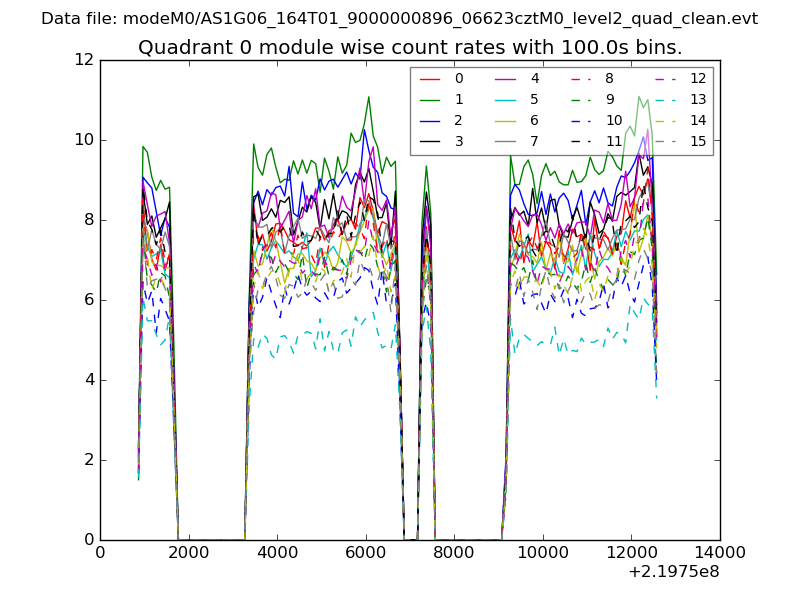
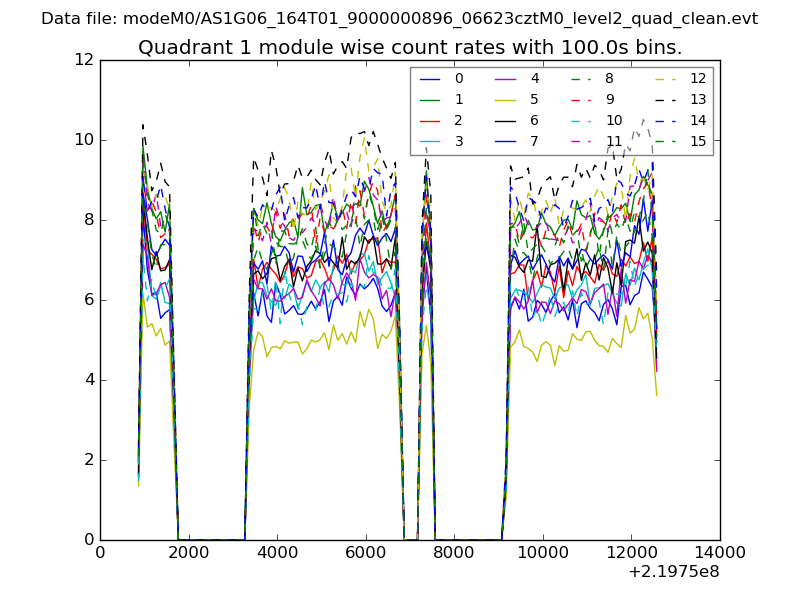
| Module-wise count rates for Quadrant A Data is divided into 100 sec bins |
 |
 |
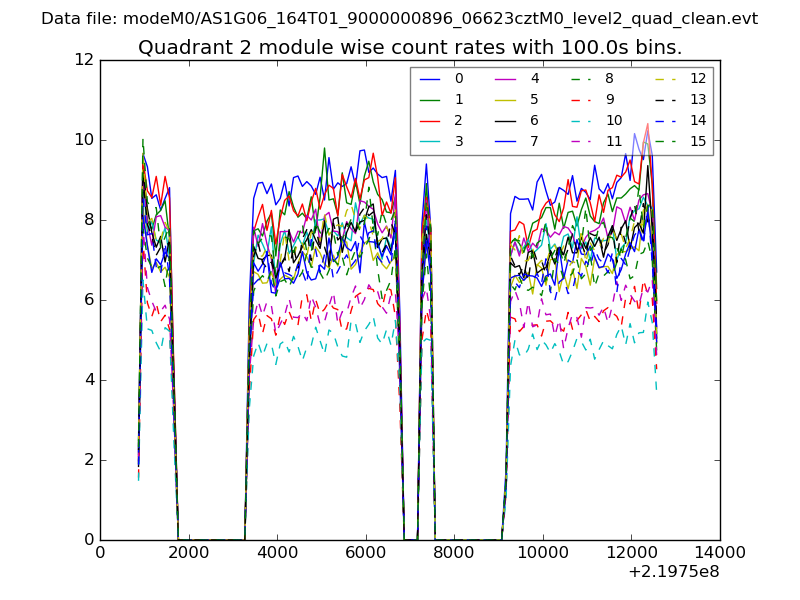
| Module-wise count rates for Quadrant B Data is divided into 100 sec bins |
 |
 |
| Module-wise count rates for Quadrant C Data is divided into 100 sec bins |
 |
 |
| Module-wise count rates for Quadrant D Data is divided into 100 sec bins |
 |
 |
| Parameter | Plot |
|---|---|
| CZT HV Monitor | 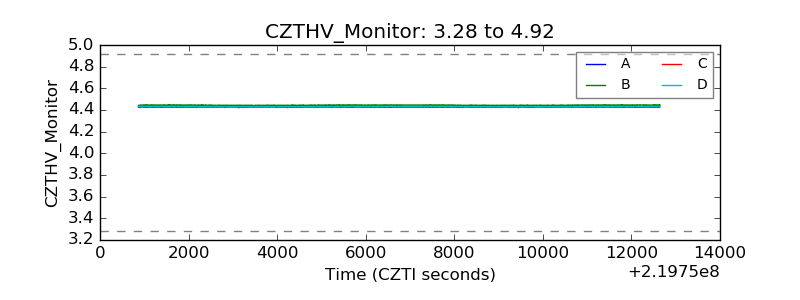 |
| D_VDD | 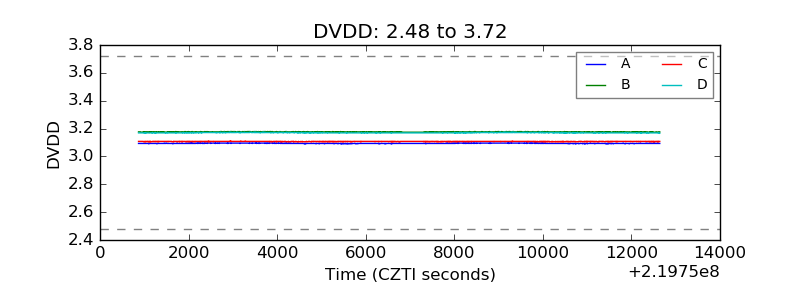 |
| Temperature 1 | 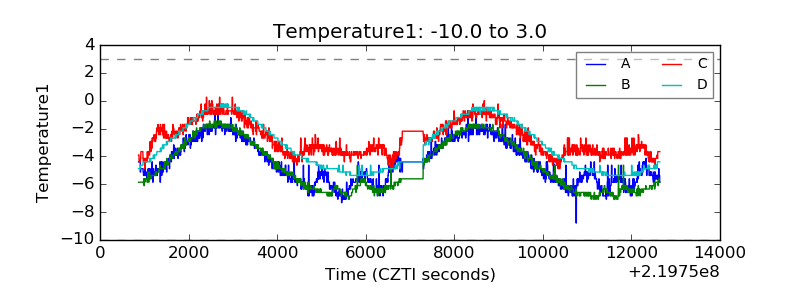 |
| Veto HV Monitor | 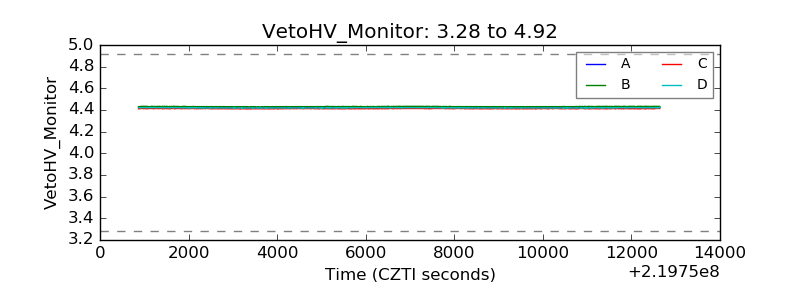 |
| Veto LLD | 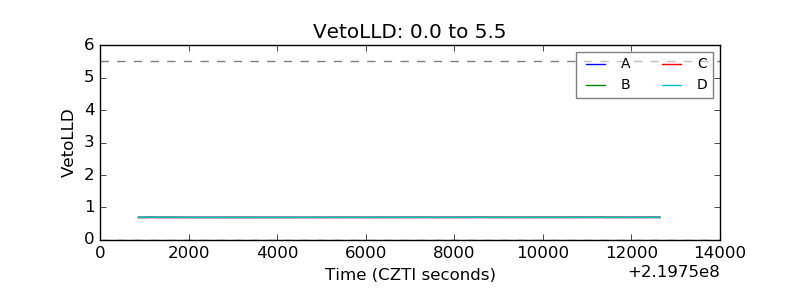 |
| Alpha Counter | 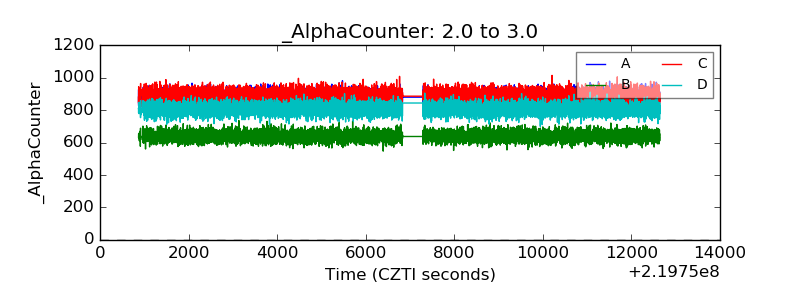 |
| _CPM_Rate |  |
| CZT Counter | 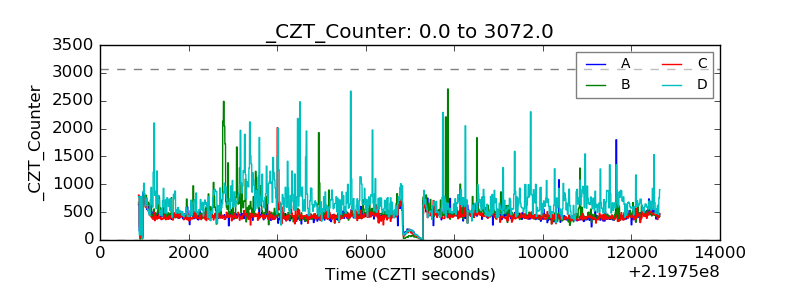 |
| +2.5 Volts monitor |  |
| +5 Volts monitor |  |
| _ROLL_ROT | 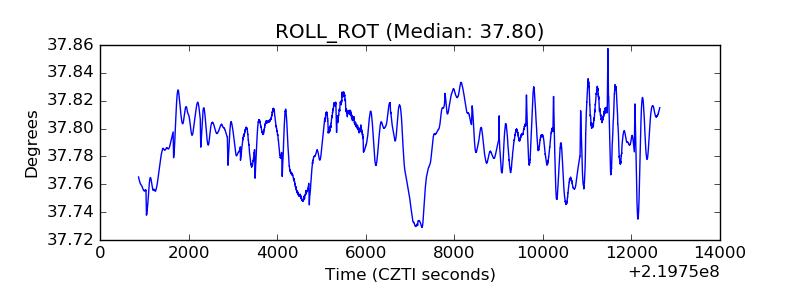 |
| _Roll_DEC | 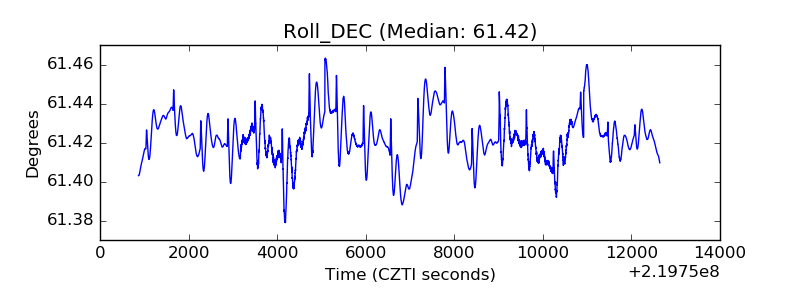 |
| _Roll_RA | 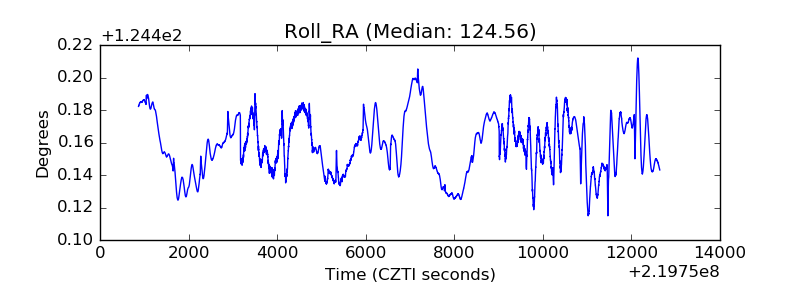 |
| Veto Counter | 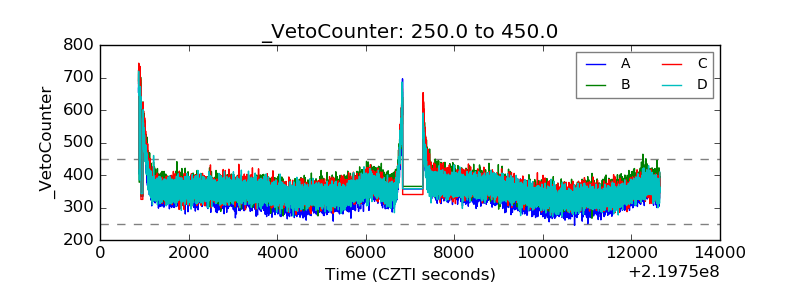 |