| Param | Original file | Final file |
|---|---|---|
| Filename | modeM0/AS1G06_164T01_9000000896_06626cztM0_level2.evt | modeM0/AS1G06_164T01_9000000896_06626cztM0_level2_quad_clean.evt |
| Size (bytes) | 1,172,980,800 | 212,143,680 |
| Size | 1.1 GB | 202.3 MB |
| Events in quadrant A | 7,315,543 | 1,351,216 |
| Events in quadrant B | 8,492,962 | 1,337,861 |
| Events in quadrant C | 7,169,223 | 1,323,316 |
| Events in quadrant D | 11,431,286 | 1,275,607 |
| Mode M0 | |||
|---|---|---|---|
| Quadrant | BADHDUFLAG | Total packets | Discarded packets |
| A | 0 | 33554 | 2 |
| B | 0 | 36378 | 2 |
| C | 0 | 33587 | 2 |
| D | 0 | 45458 | 2 |
| Mode M9 | |||
|---|---|---|---|
| Quadrant | BADHDUFLAG | Total packets | Discarded packets |
| A | 0 | 6 | 0 |
| B | 0 | 6 | 0 |
| C | 0 | 6 | 0 |
| D | 0 | 6 | 0 |
| Mode SS | |||
|---|---|---|---|
| Quadrant | BADHDUFLAG | Total packets | Discarded packets |
| A | 0 | 336 | 0 |
| B | 0 | 336 | 0 |
| C | 0 | 336 | 0 |
| D | 0 | 336 | 0 |
| Quadrant | Total seconds | Saturated seconds | Saturation percentage |
|---|---|---|---|
| A | 16486 | 283 | 1.716608% |
| B | 16486 | 444 | 2.693194% |
| C | 16486 | 241 | 1.461846% |
| D | 16486 | 445 | 2.699260% |
Noise dominated data is calculated using 1-second bins in cleaned event files. If a bin has >2000 counts, and if more than 50% of those come from <1% of pixels, then it is considered to be noise-dominated and hence unusable.
| Quadrant | # 1 sec bins | Bins with >0 counts | Bins with >2000 counts | High rate bins dominated by noise | Noise dominated (total time) | Noise dominated (detector-on time) | Marked lightcurve |
|---|---|---|---|---|---|---|---|
| A | 17131 | 16490 | 3 | 3 | 0.02% | 0.02% | 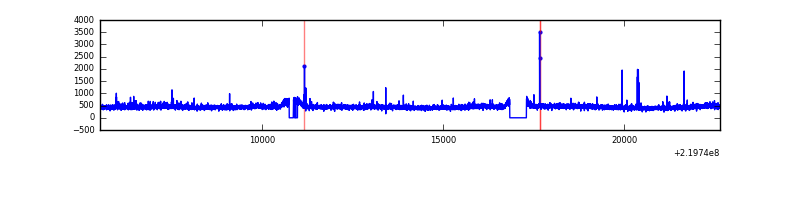 |
| B | 17131 | 16490 | 91 | 91 | 0.53% | 0.55% | 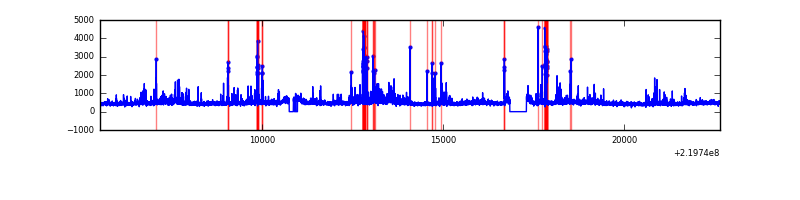 |
| C | 17131 | 16490 | 13 | 13 | 0.08% | 0.08% | 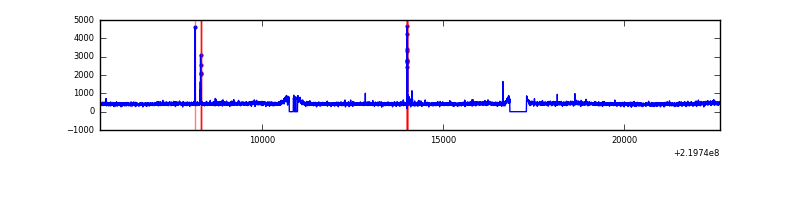 |
| D | 17131 | 16490 | 174 | 174 | 1.02% | 1.06% | 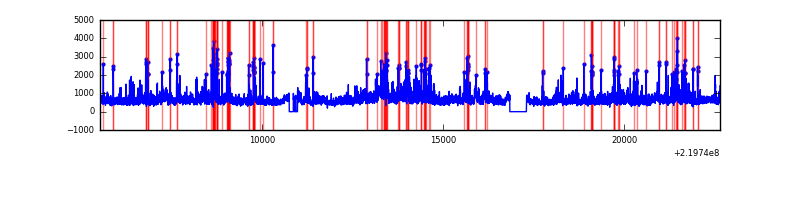 |
Top three noisy pixels from each quadrant. If the there are fewer than three noisy pixels in the level2.evt file, extra rows are filled as -1
| Pixel properties | Quadrant properties | ||||||
|---|---|---|---|---|---|---|---|
| Quadrant | DetID | PixID | Counts | Sigma | Mean | Median | Sigma |
| A | 8 | 15 | 75943 | 194.21 | 1866 | 1822 | 381.6 |
| A | 14 | 111 | 34118 | 84.62 | 1866 | 1822 | 381.6 |
| A | 13 | 251 | 19535 | 46.41 | 1866 | 1822 | 381.6 |
| B | 4 | 48 | 299133 | 836.5 | 1871 | 1824 | 355.4 |
| B | 15 | 204 | 285301 | 797.58 | 1871 | 1824 | 355.4 |
| B | 0 | 219 | 232371 | 648.66 | 1871 | 1824 | 355.4 |
| C | 9 | 54 | 86983 | 204.98 | 1804 | 1803 | 415.5 |
| C | 1 | 16 | 23949 | 53.29 | 1804 | 1803 | 415.5 |
| C | 13 | 61 | 14491 | 30.53 | 1804 | 1803 | 415.5 |
| D | 8 | 195 | 3238611 | 7389.63 | 1801 | 1741 | 438.0 |
| D | 2 | 33 | 514339 | 1170.24 | 1801 | 1741 | 438.0 |
| D | 14 | 34 | 405323 | 921.36 | 1801 | 1741 | 438.0 |
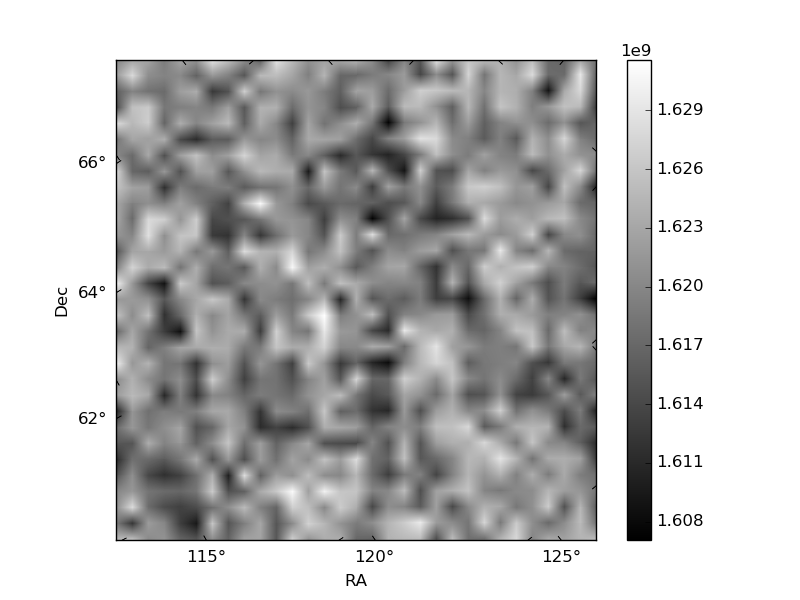
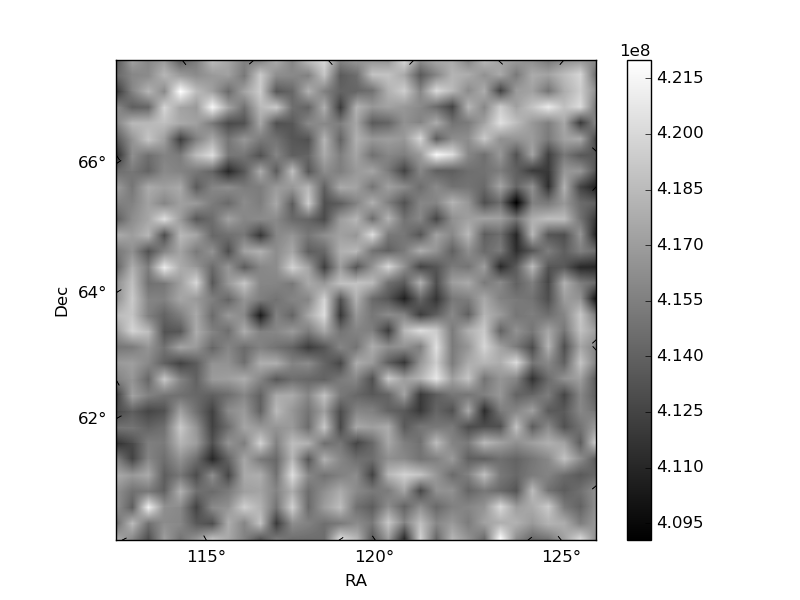
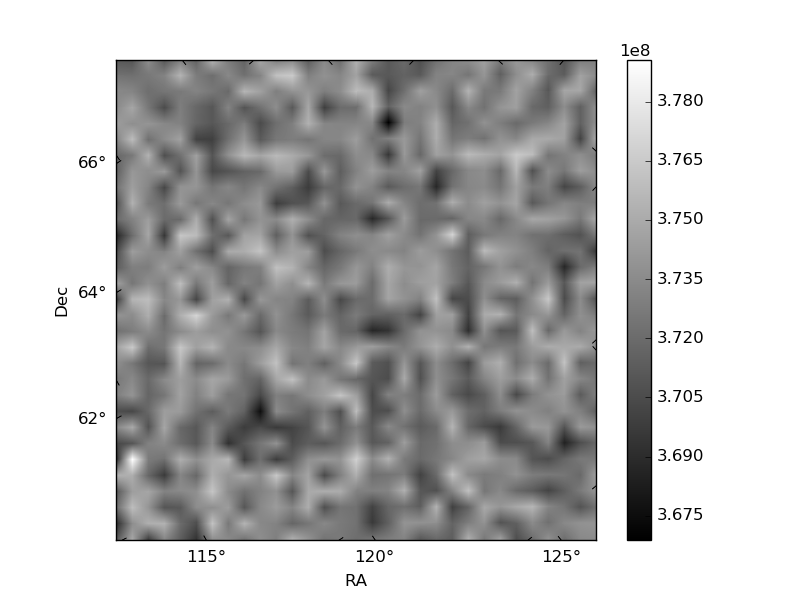
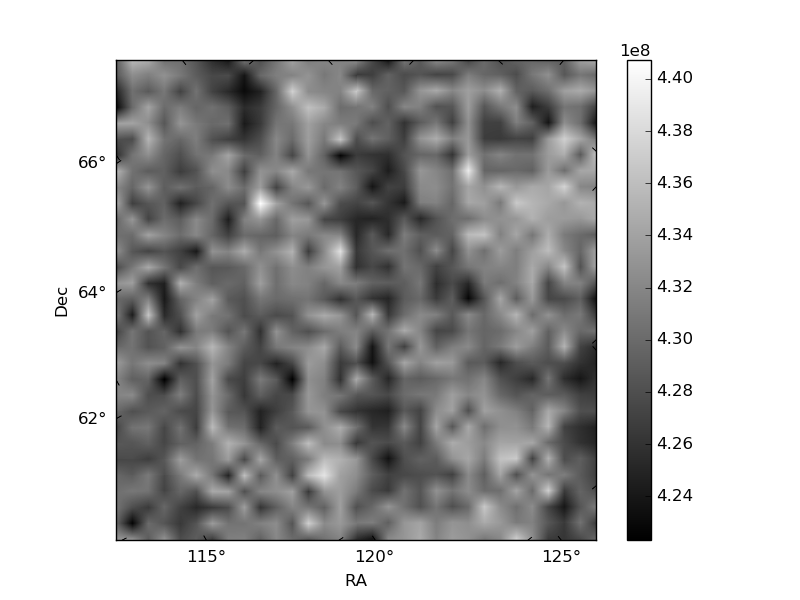
Histogram calculated using DETX and DETY for each event in the final _common_clean file
| Quadrant A | 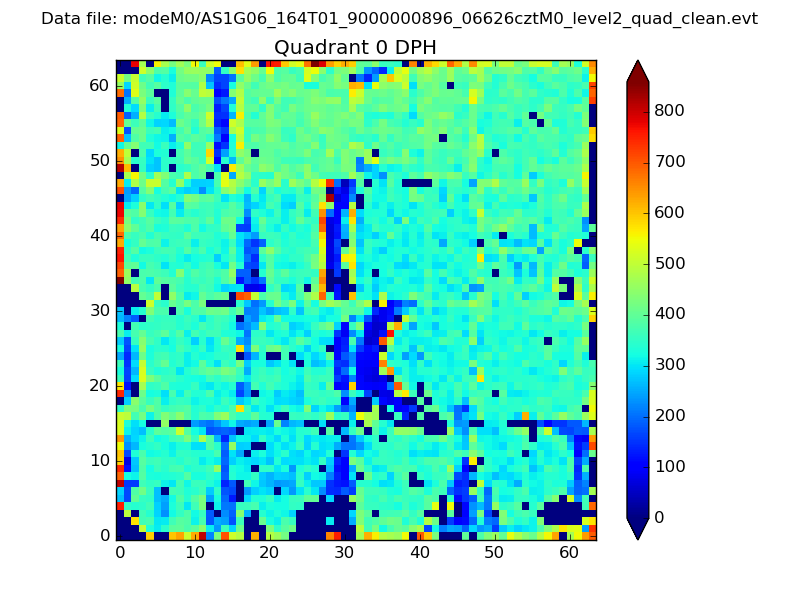 |
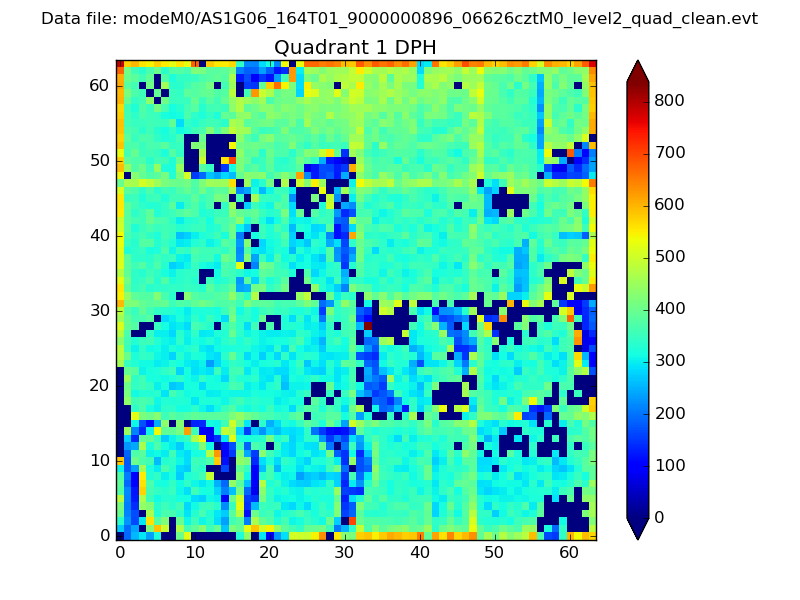 |
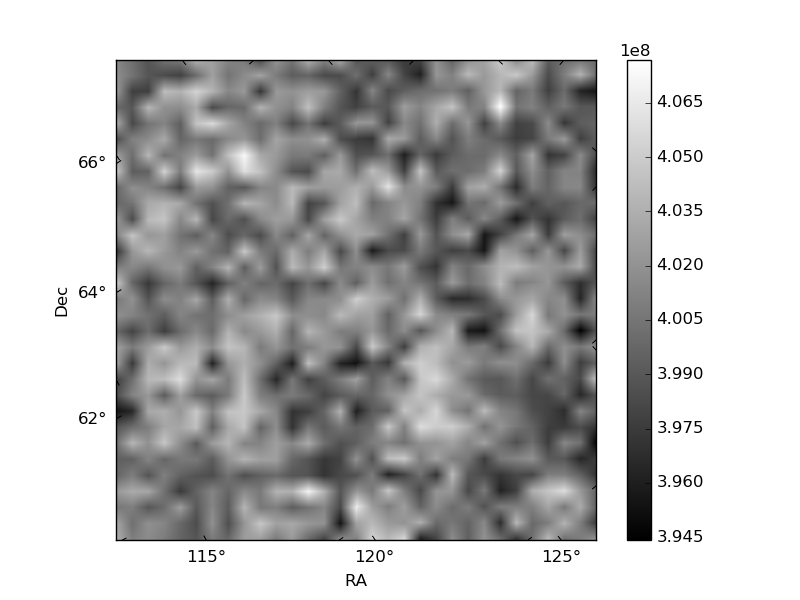
Quadrant B |
|---|---|---|---|
| Quadrant D | 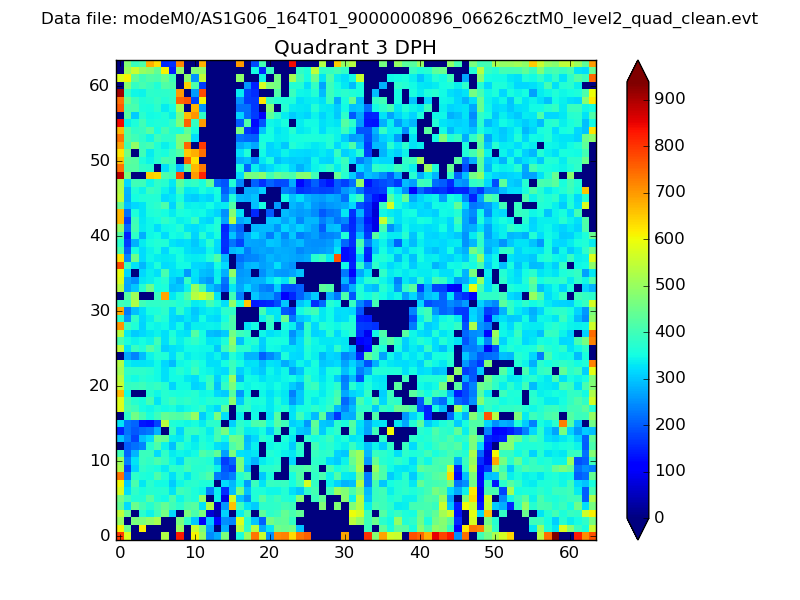 |
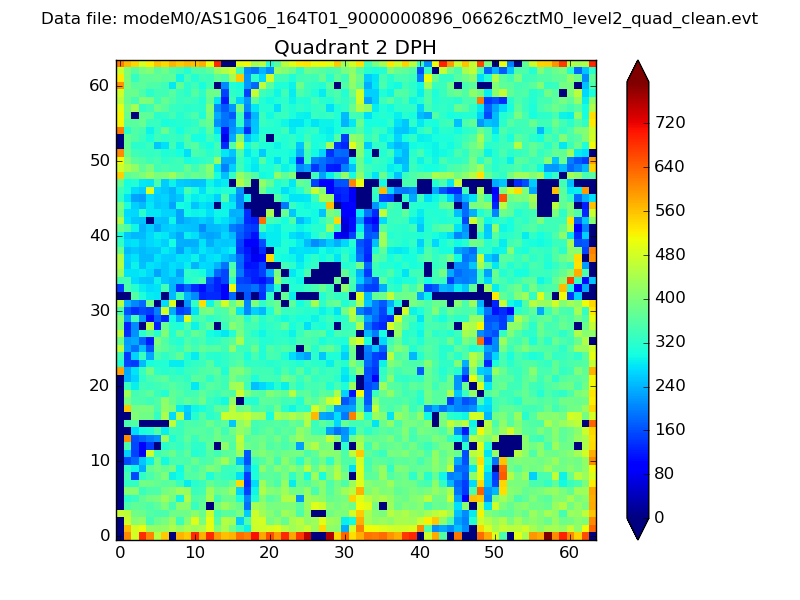 |
Quadrant C |
| Plot type | Count rate plots | Images |
|---|---|---|
| Comparison with Poisson distribution Blue bars denote a histogram of data divided into 1 sec bins. Red curve is a Poisson curve with rate = median count rate of data. |
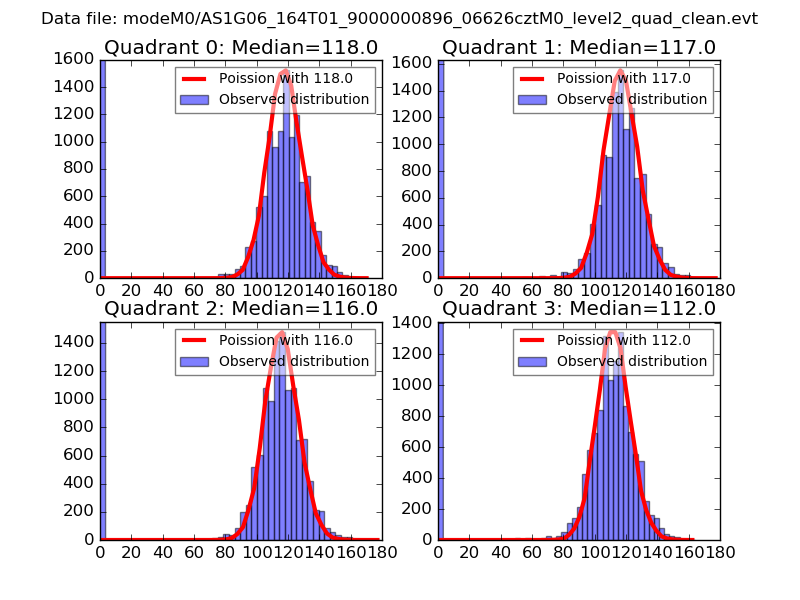 |
 |
| Quadrant-wise count rates Data is divided into 100 sec bins |
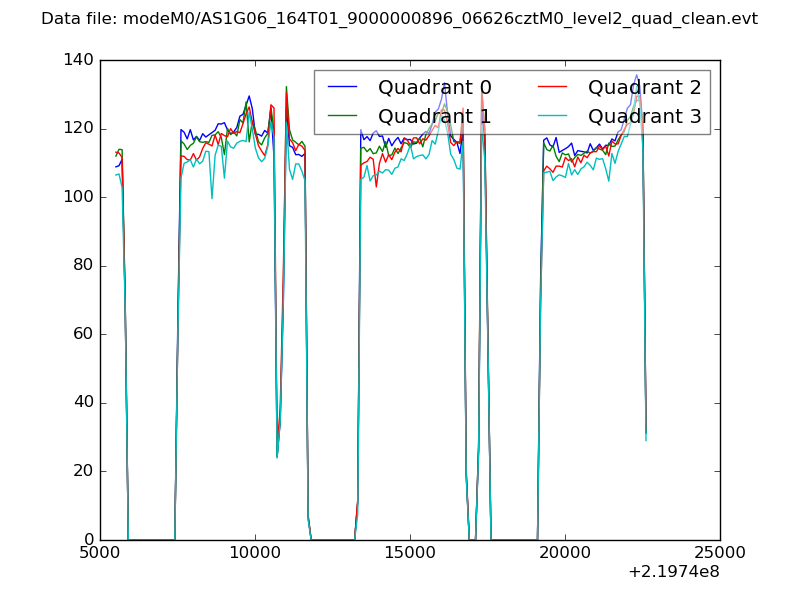 |
|
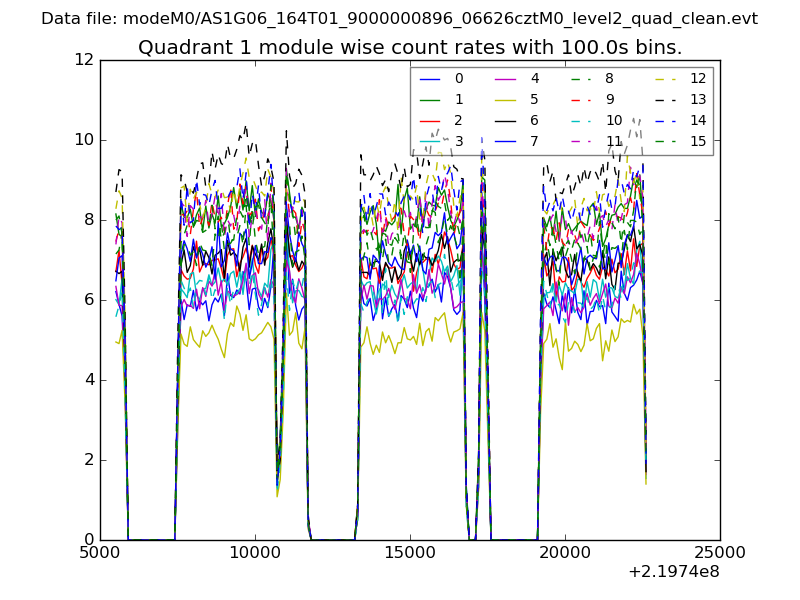
| Module-wise count rates for Quadrant A Data is divided into 100 sec bins |
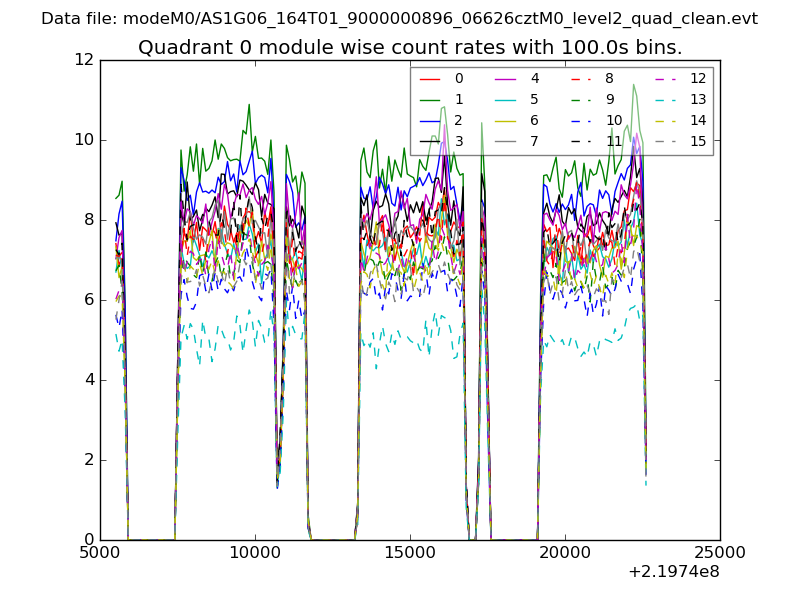 |
 |
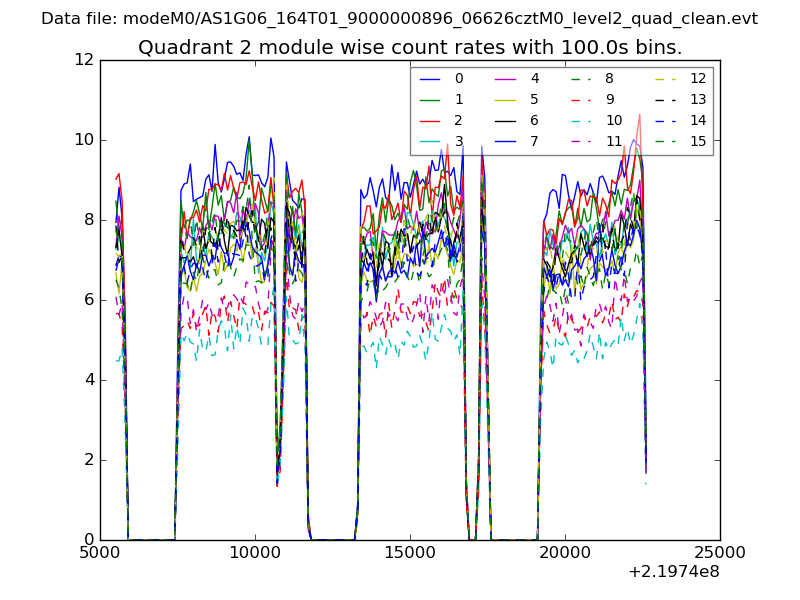
| Module-wise count rates for Quadrant B Data is divided into 100 sec bins |
 |
 |
| Module-wise count rates for Quadrant C Data is divided into 100 sec bins |
 |
 |
| Module-wise count rates for Quadrant D Data is divided into 100 sec bins |
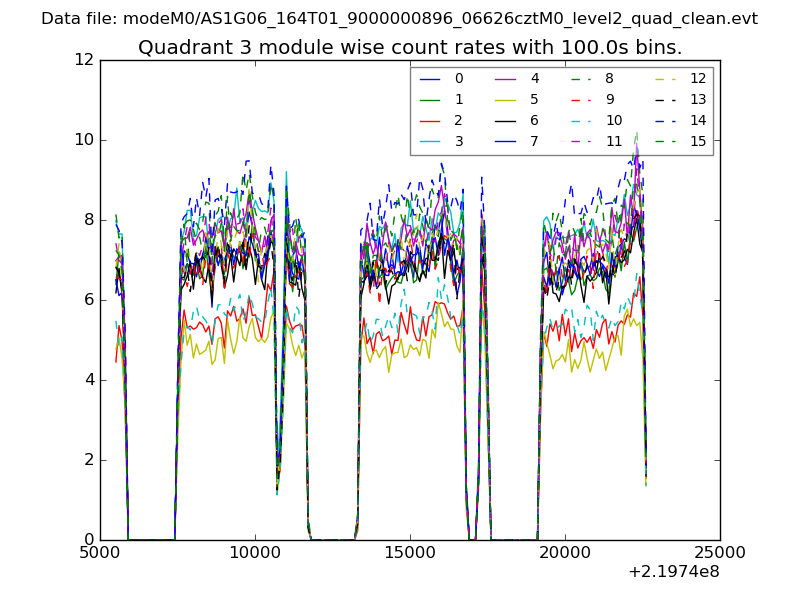 |
 |
| Parameter | Plot |
|---|---|
| CZT HV Monitor | 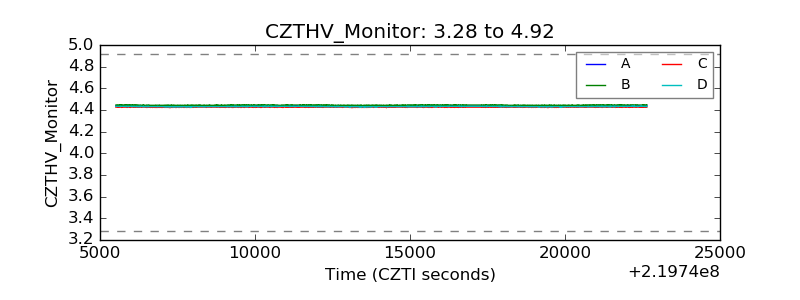 |
| D_VDD | 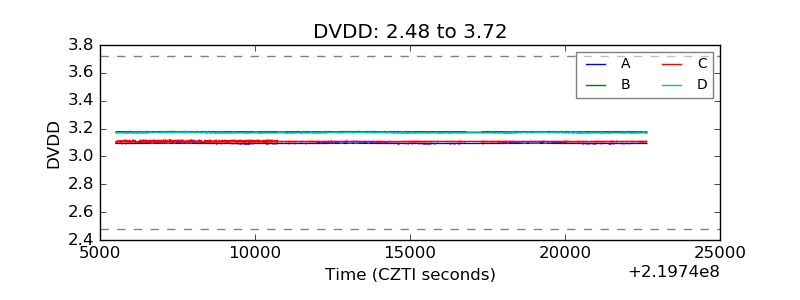 |
| Temperature 1 | 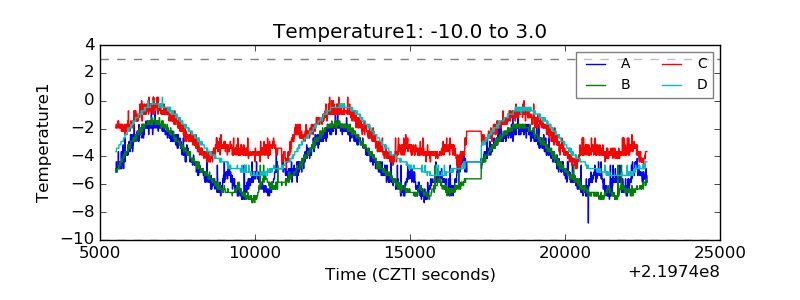 |
| Veto HV Monitor | 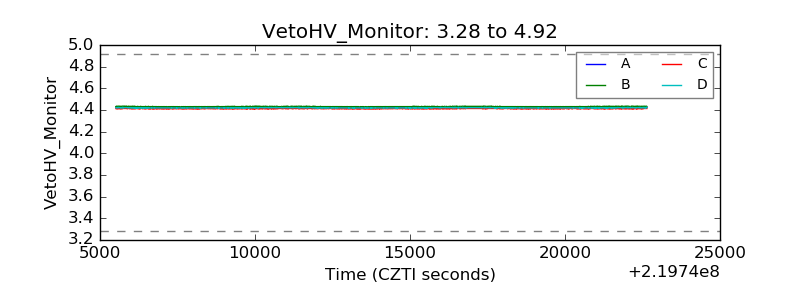 |
| Veto LLD | 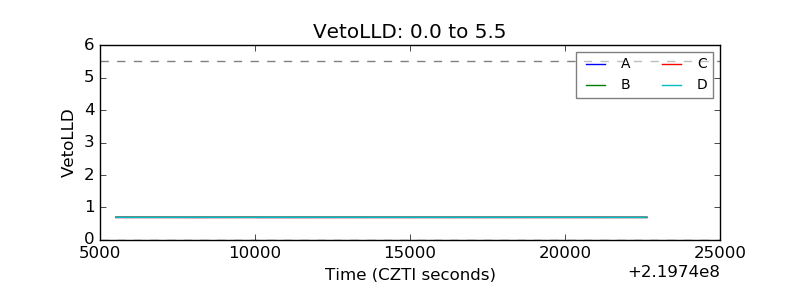 |
| Alpha Counter | 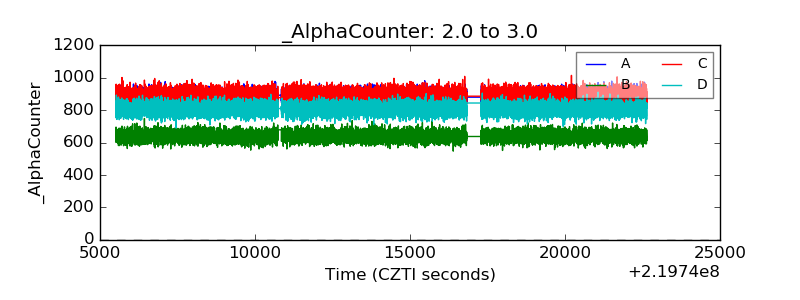 |
| _CPM_Rate |  |
| CZT Counter | 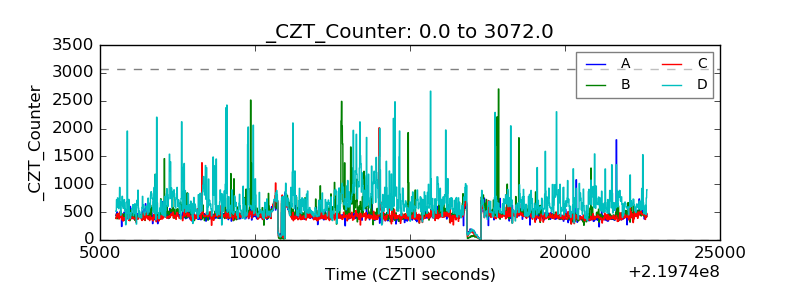 |
| +2.5 Volts monitor |  |
| +5 Volts monitor |  |
| _ROLL_ROT | 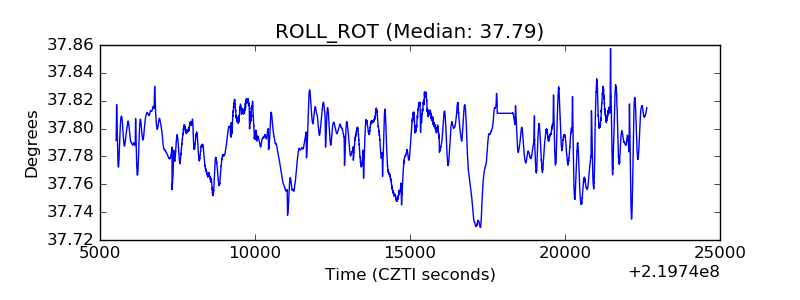 |
| _Roll_DEC |  |
| _Roll_RA | 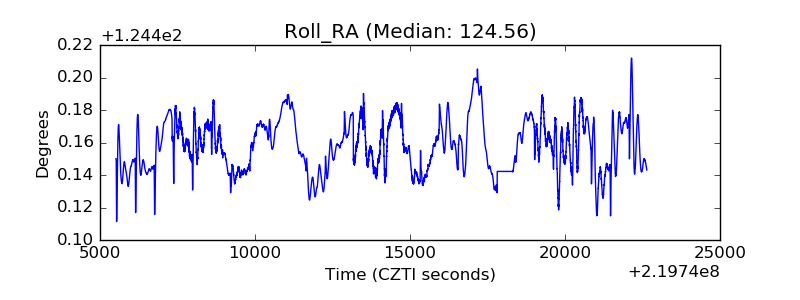 |
| Veto Counter | 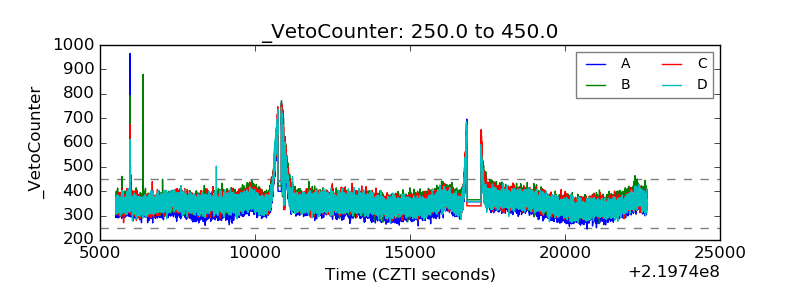 |