| Param | Original file | Final file |
|---|---|---|
| Filename | modeM0/AS1A02_111T01_9000000900cztM0_level2.fits | modeM0/AS1A02_111T01_9000000900cztM0_level2_quad_clean.evt |
| Size (bytes) | 206,366,400 | 236,905,920 |
| Size | 196.8 MB | 225.9 MB |
| Events in quadrant A | 1,232,148 | 1,481,921 |
| Events in quadrant B | 1,190,878 | 1,474,608 |
| Events in quadrant C | 1,227,478 | 1,410,699 |
| Events in quadrant D | 990,762 | 1,199,847 |
| Mode M0 | |||
|---|---|---|---|
| Quadrant | BADHDUFLAG | Total packets | Discarded packets |
| A | 0 | 50274 | 0 |
| B | 0 | 52059 | 0 |
| C | 0 | 47484 | 0 |
| D | 0 | 86172 | 0 |
| Mode M9 | |||
|---|---|---|---|
| Quadrant | BADHDUFLAG | Total packets | Discarded packets |
| A | 0 | 38 | 0 |
| B | 0 | 38 | 0 |
| C | 0 | 38 | 0 |
| D | 0 | 38 | 0 |
| Mode SS | |||
|---|---|---|---|
| Quadrant | BADHDUFLAG | Total packets | Discarded packets |
| A | 0 | 474 | 0 |
| B | 0 | 474 | 0 |
| C | 0 | 474 | 0 |
| D | 0 | 474 | 0 |
| Quadrant | Total seconds | Saturated seconds | Saturation percentage |
|---|---|---|---|
| A | 23369 | 456 | 1.951303% |
| B | 23369 | 529 | 2.263683% |
| C | 23369 | 213 | 0.911464% |
| D | 23369 | 2152 | 9.208781% |
Noise dominated data is calculated using 1-second bins in cleaned event files. If a bin has >2000 counts, and if more than 50% of those come from <1% of pixels, then it is considered to be noise-dominated and hence unusable.
| Quadrant | # 1 sec bins | Bins with >0 counts | Bins with >2000 counts | High rate bins dominated by noise | Noise dominated (total time) | Noise dominated (detector-on time) | Marked lightcurve |
|---|---|---|---|---|---|---|---|
| A | 26594 | 23368 | 0 | 0 | 0.00% | 0.00% | 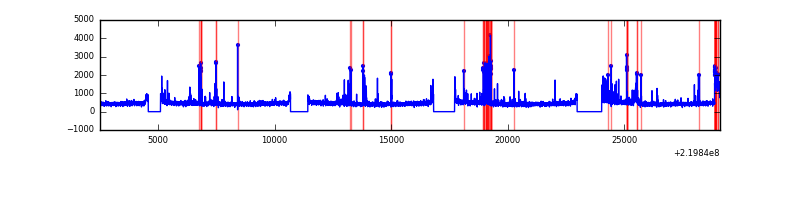 |
| B | 26594 | 23368 | 0 | 0 | 0.00% | 0.00% | 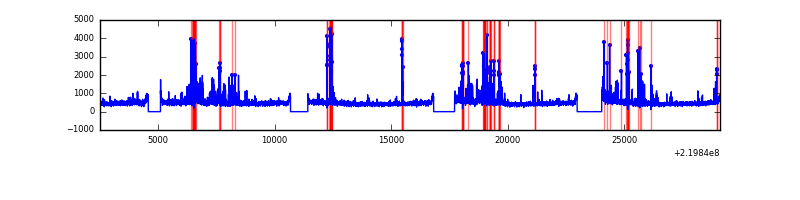 |
| C | 26594 | 23369 | 0 | 0 | 0.00% | 0.00% | 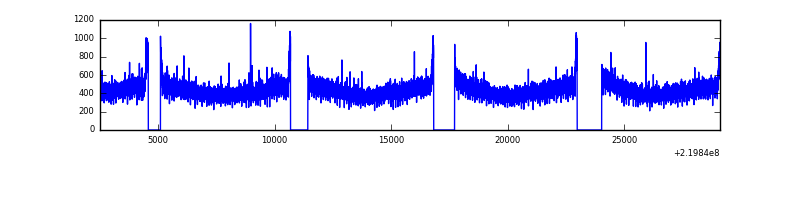 |
| D | 26594 | 23322 | 0 | 0 | 0.00% | 0.00% | 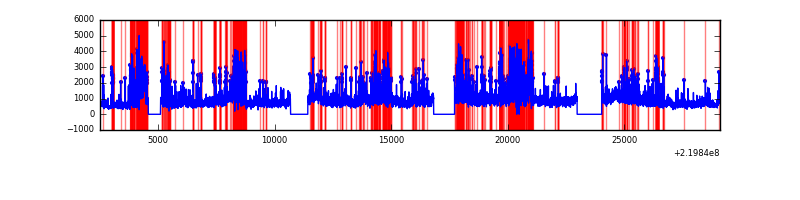 |
Top three noisy pixels from each quadrant. If the there are fewer than three noisy pixels in the level2.evt file, extra rows are filled as -1
| Pixel properties | Quadrant properties | ||||||
|---|---|---|---|---|---|---|---|
| Quadrant | DetID | PixID | Counts | Sigma | Mean | Median | Sigma |
| A | 14 | 188 | 1264 | 11.65 | 319 | 299 | 82.8 |
| A | 0 | 29 | 1252 | 11.51 | 319 | 299 | 82.8 |
| A | 14 | 204 | 1055 | 9.13 | 319 | 299 | 82.8 |
| B | 2 | 9 | 1041 | 11.64 | 314 | 298 | 63.8 |
| B | 12 | 226 | 858 | 8.77 | 314 | 298 | 63.8 |
| B | 14 | 254 | 849 | 8.63 | 314 | 298 | 63.8 |
| C | 1 | 81 | 918 | 7.17 | 323 | 298 | 86.5 |
| C | 12 | 241 | 910 | 7.07 | 323 | 298 | 86.5 |
| C | 1 | 80 | 892 | 6.87 | 323 | 298 | 86.5 |
| D | 3 | 14 | 780 | 6.72 | 282 | 255 | 78.1 |
| D | 11 | 82 | 731 | 6.09 | 282 | 255 | 78.1 |
| D | 3 | 159 | 696 | 5.65 | 282 | 255 | 78.1 |
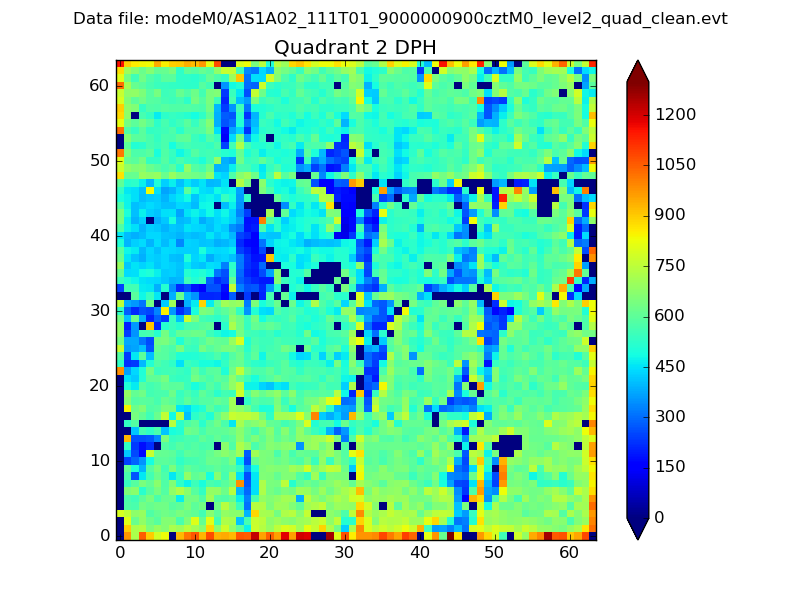
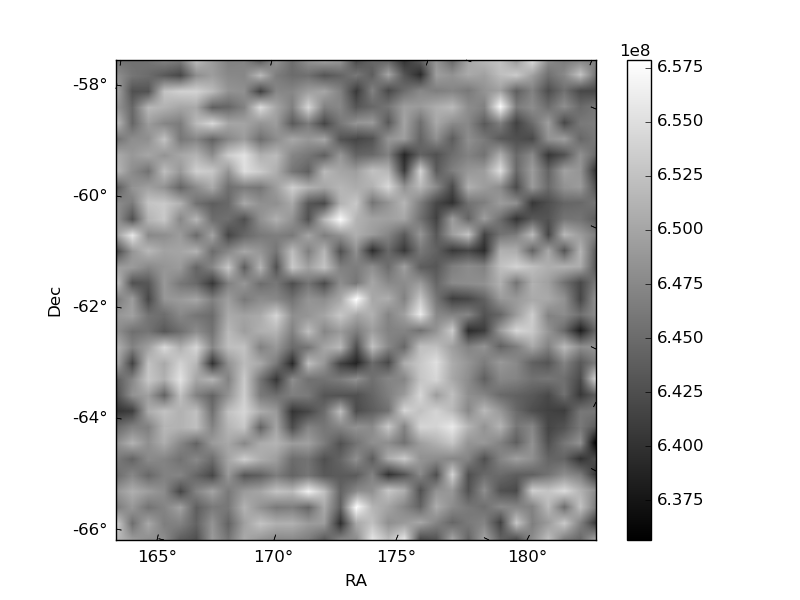
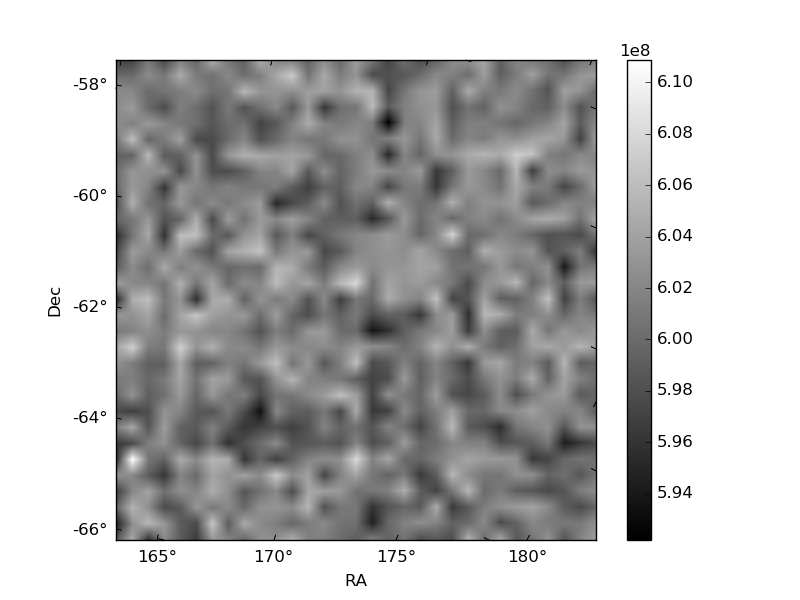
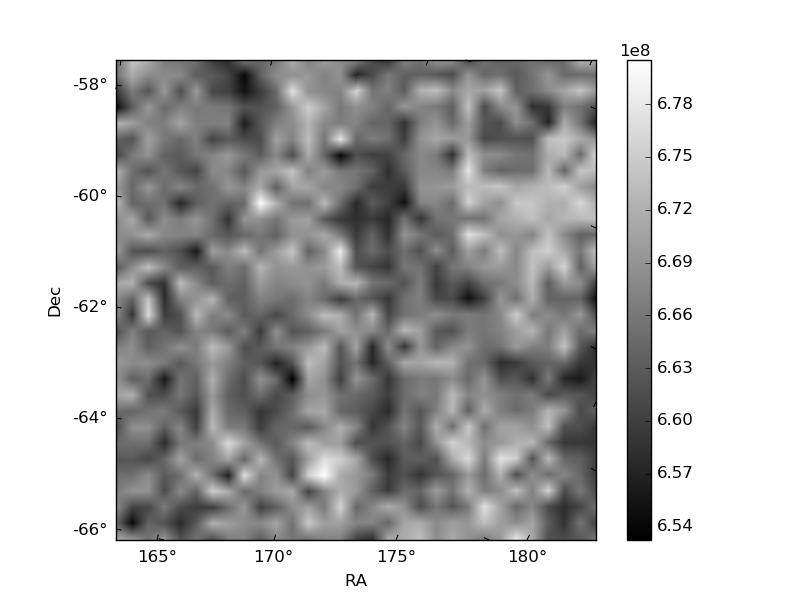
Histogram calculated using DETX and DETY for each event in the final _common_clean file
| Quadrant A | 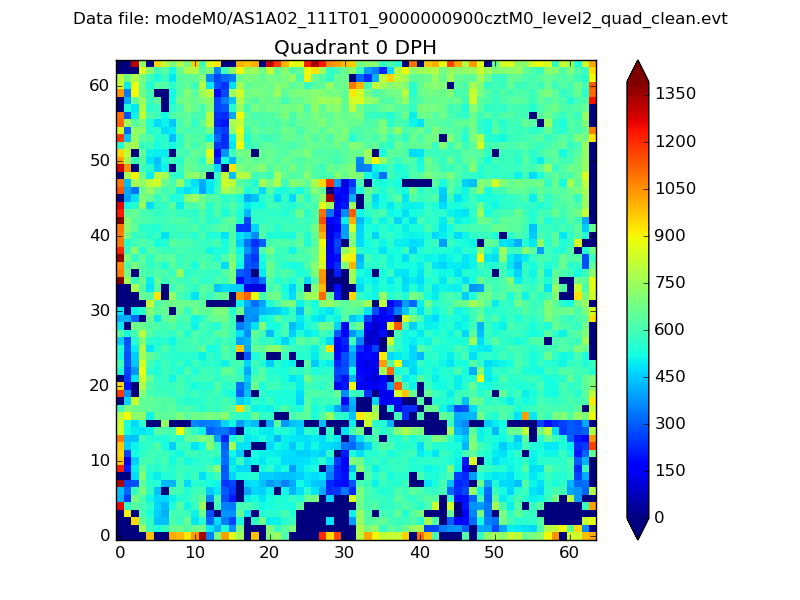 |
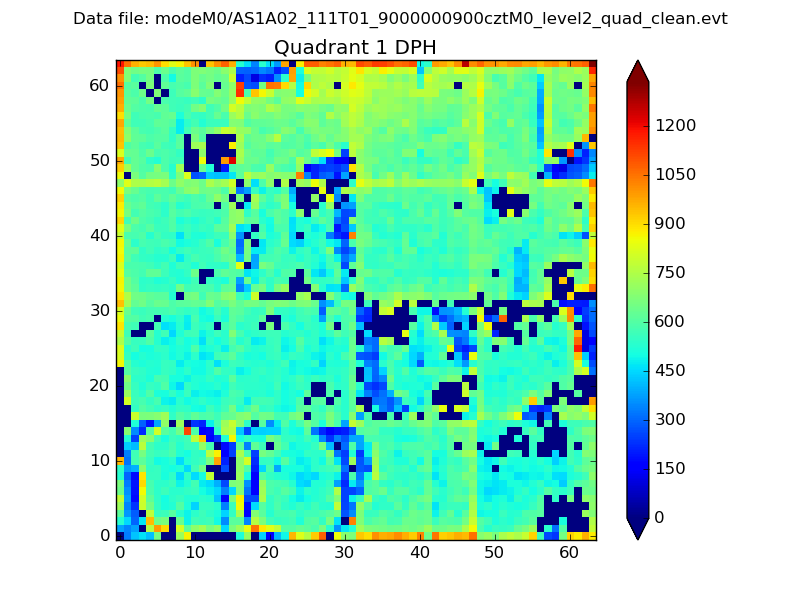 |
Quadrant B |
|---|---|---|---|
| Quadrant D | 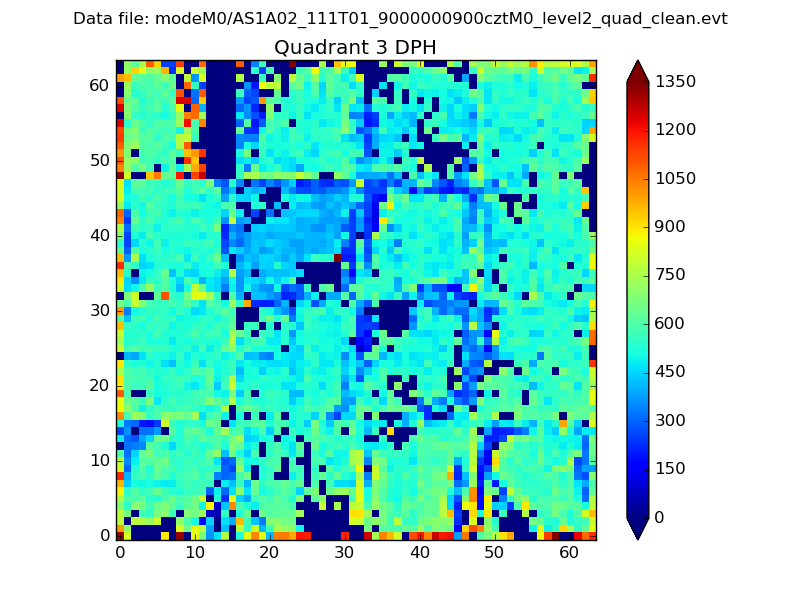 |
 |
Quadrant C |
| Plot type | Count rate plots | Images |
|---|---|---|
| Comparison with Poisson distribution Blue bars denote a histogram of data divided into 1 sec bins. Red curve is a Poisson curve with rate = median count rate of data. |
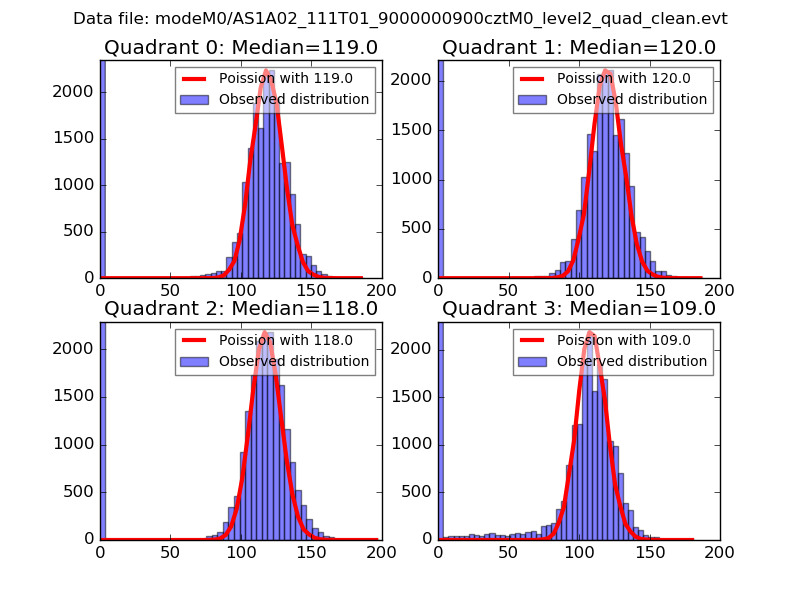 |
 |
| Quadrant-wise count rates Data is divided into 100 sec bins |
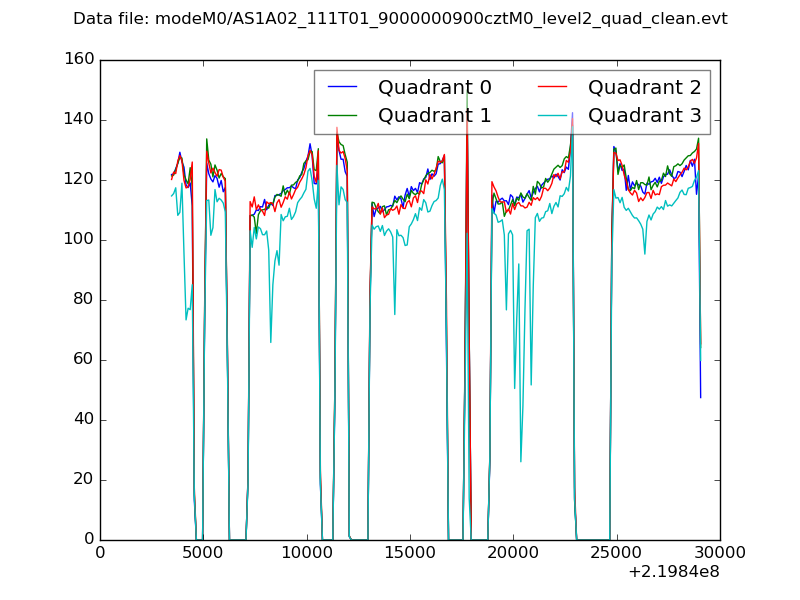 |
|
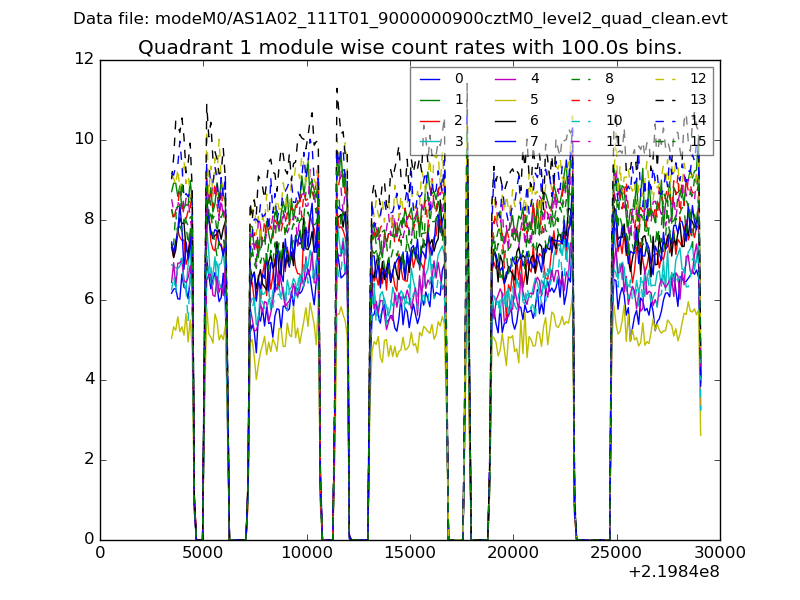
| Module-wise count rates for Quadrant A Data is divided into 100 sec bins |
 |
 |
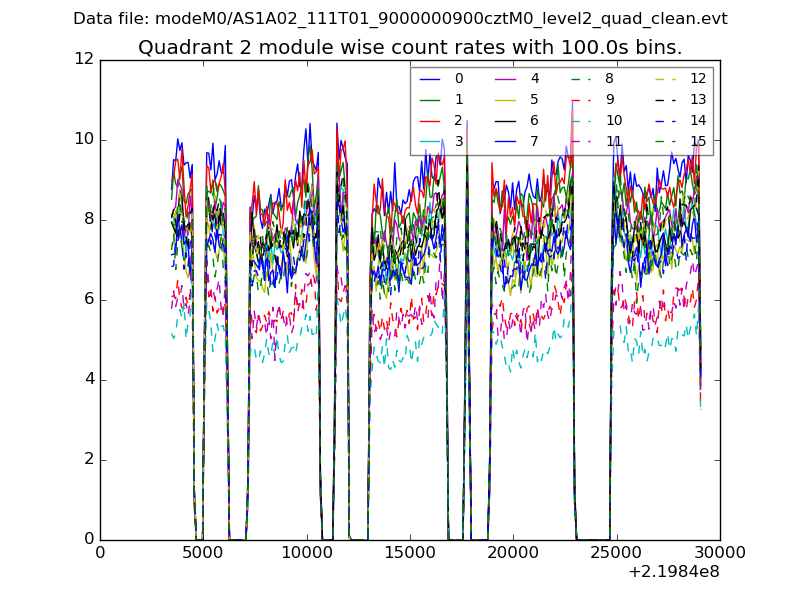
| Module-wise count rates for Quadrant B Data is divided into 100 sec bins |
 |
 |
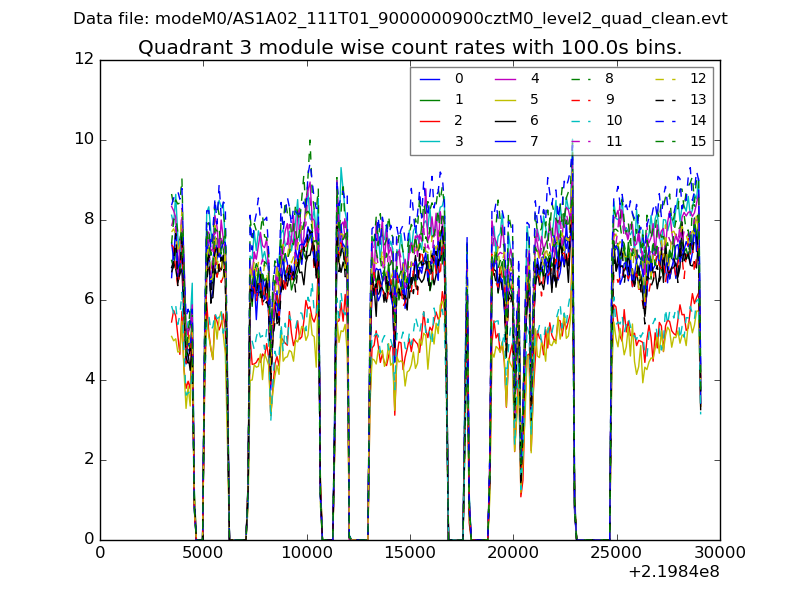
| Module-wise count rates for Quadrant C Data is divided into 100 sec bins |
 |
 |
| Module-wise count rates for Quadrant D Data is divided into 100 sec bins |
 |
 |
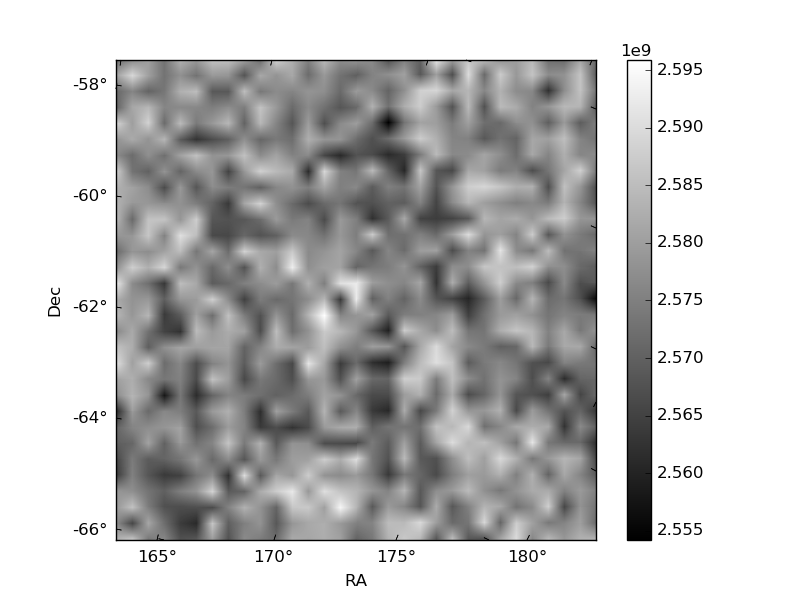
| Parameter | Plot |
|---|---|
| CZT HV Monitor | 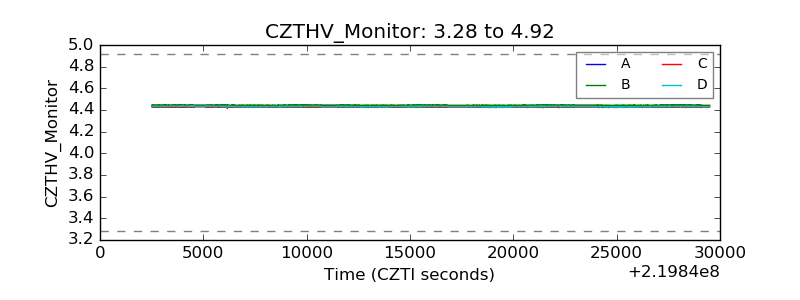 |
| D_VDD | 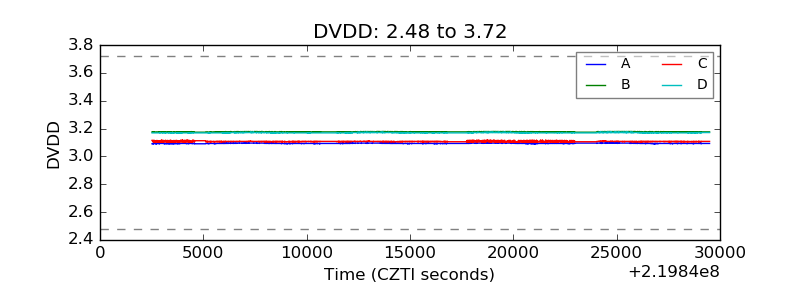 |
| Temperature 1 | 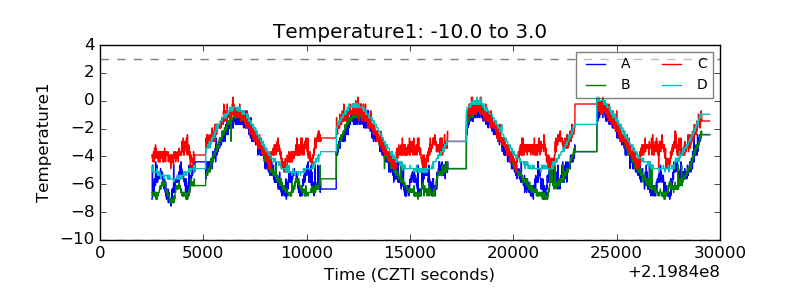 |
| Veto HV Monitor | 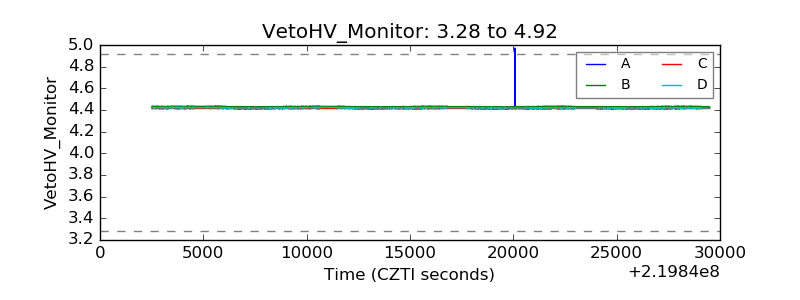 |
| Veto LLD | 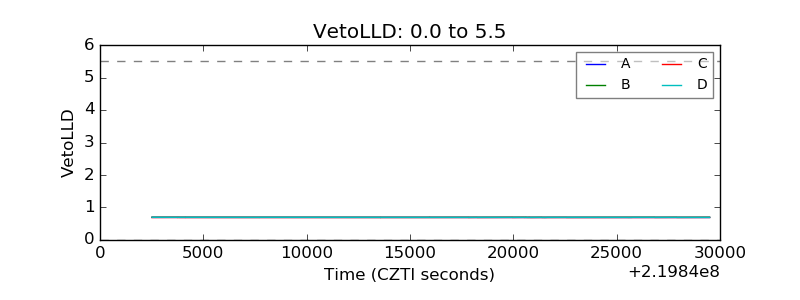 |
| Alpha Counter | 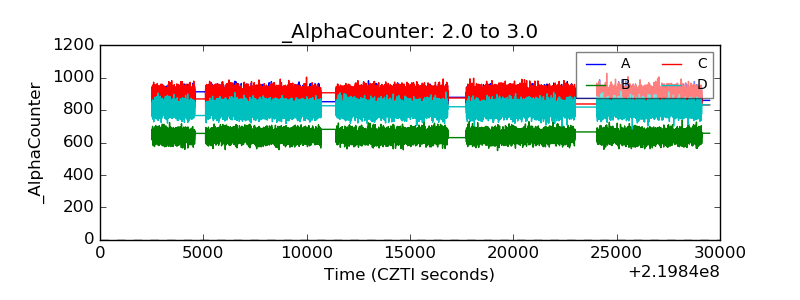 |
| _CPM_Rate | 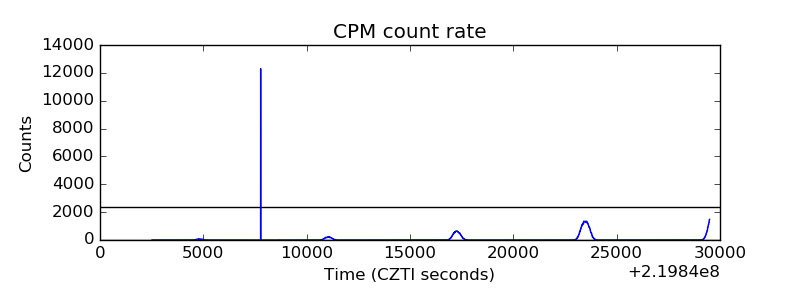 |
| CZT Counter | 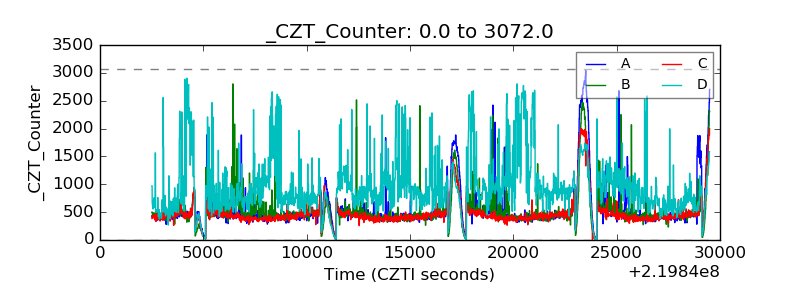 |
| +2.5 Volts monitor | 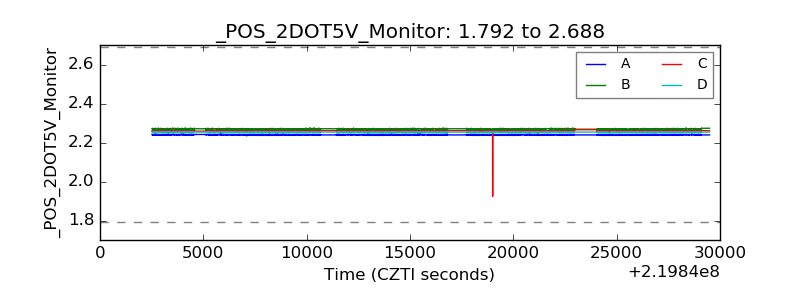 |
| +5 Volts monitor | 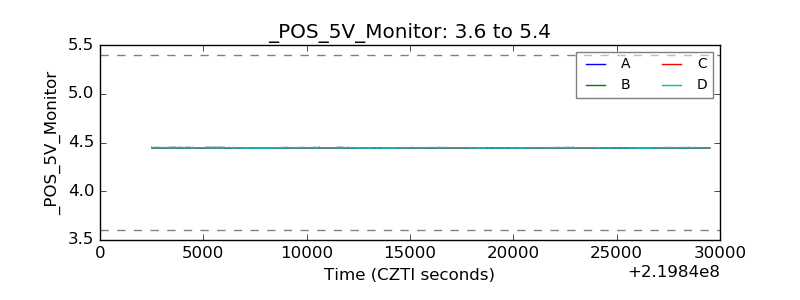 |
| _ROLL_ROT | 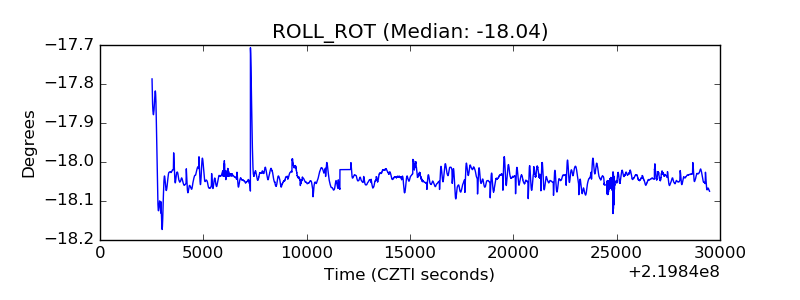 |
| _Roll_DEC | 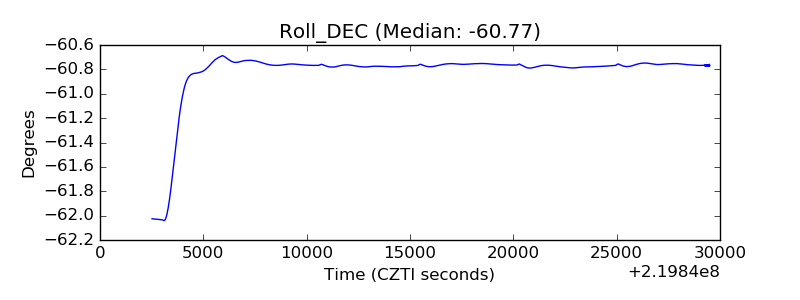 |
| _Roll_RA | 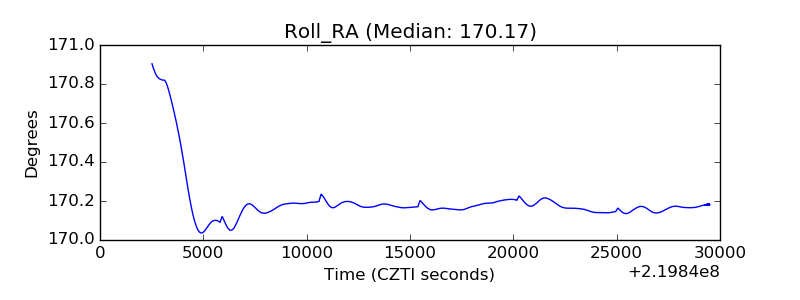 |
| Veto Counter | 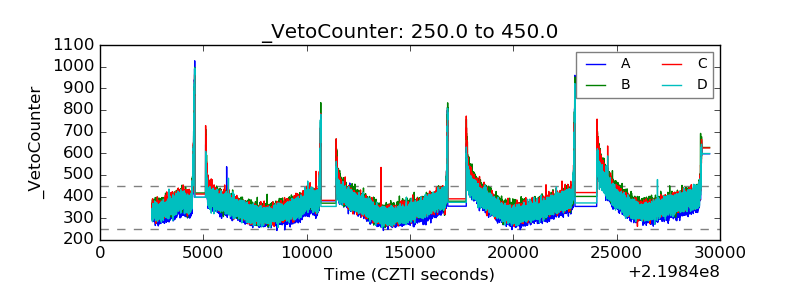 |