| Param | Original file | Final file |
|---|---|---|
| Filename | modeM0/AS1A02_111T01_9000000900_06638cztM0_level2.evt | modeM0/AS1A02_111T01_9000000900_06638cztM0_level2_quad_clean.evt |
| Size (bytes) | 1,200,816,000 | 205,914,240 |
| Size | 1.1 GB | 196.4 MB |
| Events in quadrant A | 6,923,481 | 1,337,797 |
| Events in quadrant B | 7,710,956 | 1,349,328 |
| Events in quadrant C | 6,388,026 | 1,338,770 |
| Events in quadrant D | 14,364,675 | 1,208,137 |
| Mode M0 | |||
|---|---|---|---|
| Quadrant | BADHDUFLAG | Total packets | Discarded packets |
| A | 0 | 30721 | 4 |
| B | 0 | 32639 | 3 |
| C | 0 | 29558 | 3 |
| D | 0 | 53008 | 3 |
| Mode M9 | |||
|---|---|---|---|
| Quadrant | BADHDUFLAG | Total packets | Discarded packets |
| A | 0 | 23 | 0 |
| B | 0 | 23 | 0 |
| C | 0 | 23 | 0 |
| D | 0 | 23 | 0 |
| Mode SS | |||
|---|---|---|---|
| Quadrant | BADHDUFLAG | Total packets | Discarded packets |
| A | 0 | 294 | 0 |
| B | 0 | 294 | 0 |
| C | 0 | 294 | 0 |
| D | 0 | 294 | 0 |
| Quadrant | Total seconds | Saturated seconds | Saturation percentage |
|---|---|---|---|
| A | 14521 | 272 | 1.873149% |
| B | 14521 | 382 | 2.630673% |
| C | 14521 | 156 | 1.074306% |
| D | 14521 | 1365 | 9.400179% |
Noise dominated data is calculated using 1-second bins in cleaned event files. If a bin has >2000 counts, and if more than 50% of those come from <1% of pixels, then it is considered to be noise-dominated and hence unusable.
| Quadrant | # 1 sec bins | Bins with >0 counts | Bins with >2000 counts | High rate bins dominated by noise | Noise dominated (total time) | Noise dominated (detector-on time) | Marked lightcurve |
|---|---|---|---|---|---|---|---|
| A | 16691 | 14523 | 31 | 31 | 0.19% | 0.21% | 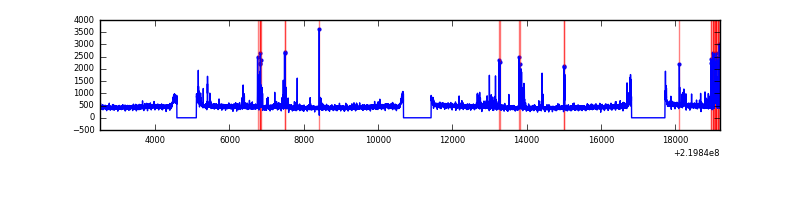 |
| B | 16691 | 14524 | 89 | 89 | 0.53% | 0.61% | 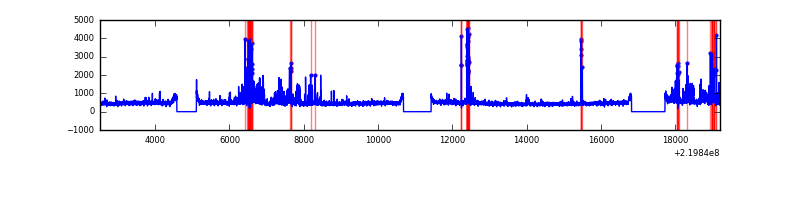 |
| C | 16691 | 14524 | 0 | 0 | 0.00% | 0.00% | 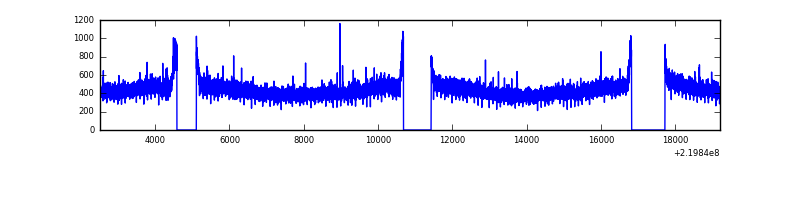 |
| D | 16691 | 14524 | 959 | 959 | 5.75% | 6.60% | 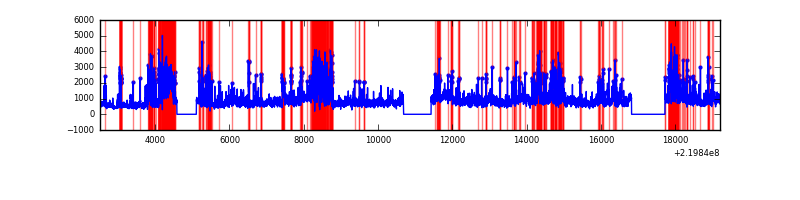 |
Top three noisy pixels from each quadrant. If the there are fewer than three noisy pixels in the level2.evt file, extra rows are filled as -1
| Pixel properties | Quadrant properties | ||||||
|---|---|---|---|---|---|---|---|
| Quadrant | DetID | PixID | Counts | Sigma | Mean | Median | Sigma |
| A | 15 | 239 | 342194 | 1001.4 | 1669 | 1630 | 340.1 |
| A | 13 | 248 | 109895 | 318.34 | 1669 | 1630 | 340.1 |
| A | 8 | 15 | 35420 | 99.36 | 1669 | 1630 | 340.1 |
| B | 4 | 48 | 337414 | 1054.29 | 1680 | 1638 | 318.5 |
| B | 0 | 219 | 313645 | 979.66 | 1680 | 1638 | 318.5 |
| B | 4 | 170 | 183344 | 570.53 | 1680 | 1638 | 318.5 |
| C | 13 | 61 | 13022 | 30.26 | 1631 | 1637 | 376.2 |
| C | 8 | 128 | 11073 | 25.08 | 1631 | 1637 | 376.2 |
| C | 12 | 4 | 7049 | 14.38 | 1631 | 1637 | 376.2 |
| D | 8 | 195 | 4522453 | 11694.9 | 1575 | 1523 | 386.6 |
| D | 2 | 33 | 2834991 | 7329.71 | 1575 | 1523 | 386.6 |
| D | 2 | 63 | 336593 | 866.77 | 1575 | 1523 | 386.6 |
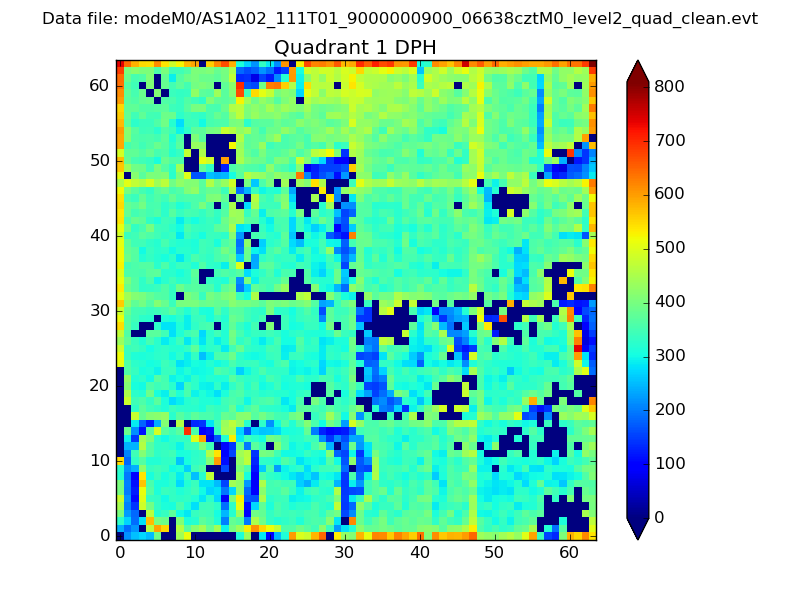
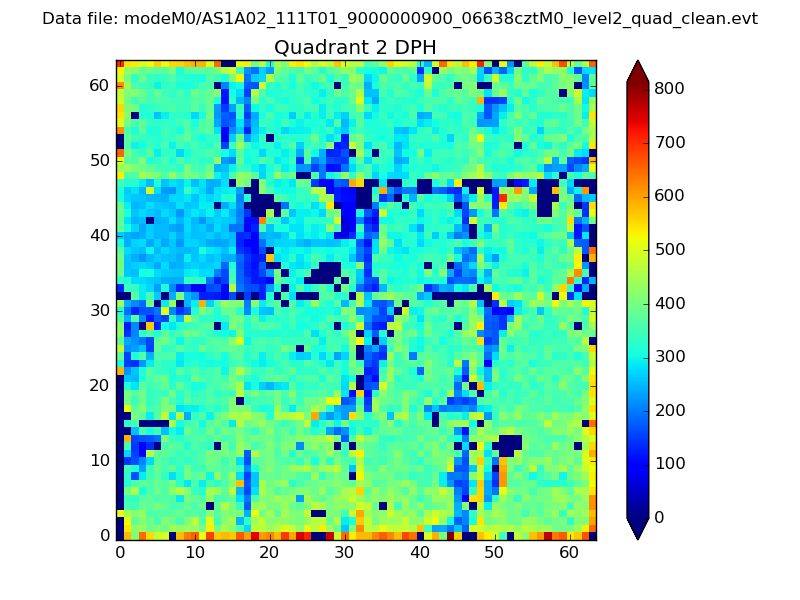
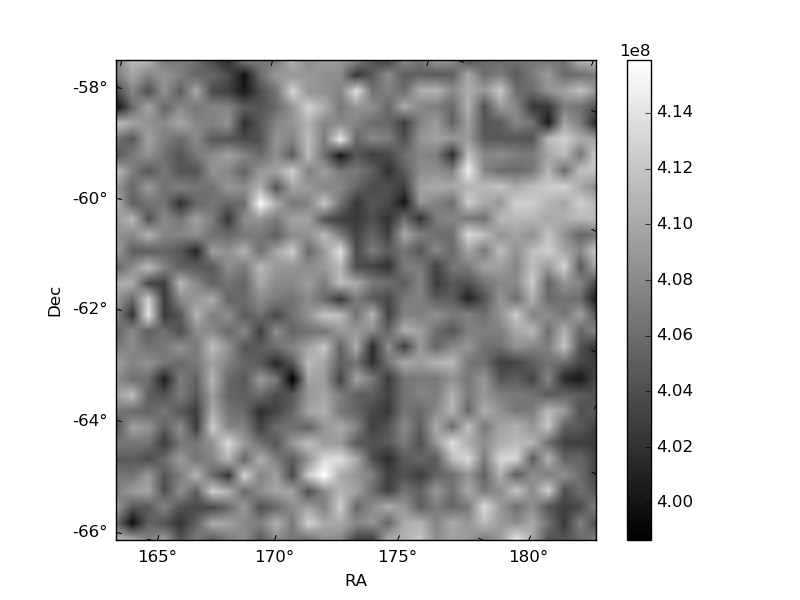
Histogram calculated using DETX and DETY for each event in the final _common_clean file
| Quadrant A |  |
 |
Quadrant B |
|---|---|---|---|
| Quadrant D |  |
 |
Quadrant C |
| Plot type | Count rate plots | Images |
|---|---|---|
| Comparison with Poisson distribution Blue bars denote a histogram of data divided into 1 sec bins. Red curve is a Poisson curve with rate = median count rate of data. |
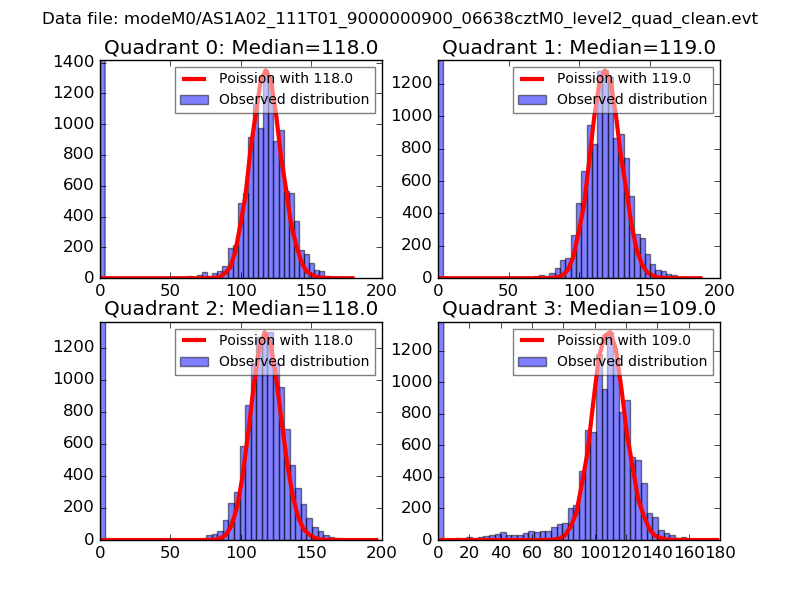 |
 |
| Quadrant-wise count rates Data is divided into 100 sec bins |
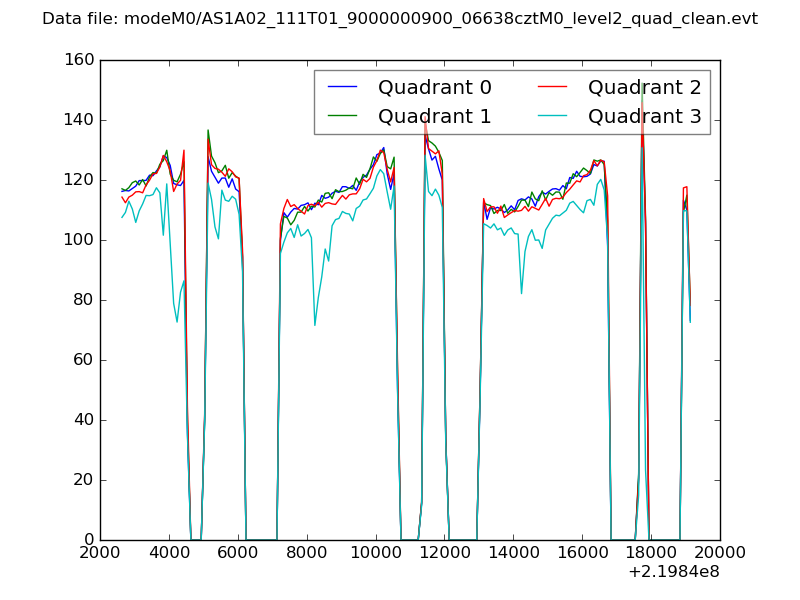 |
|
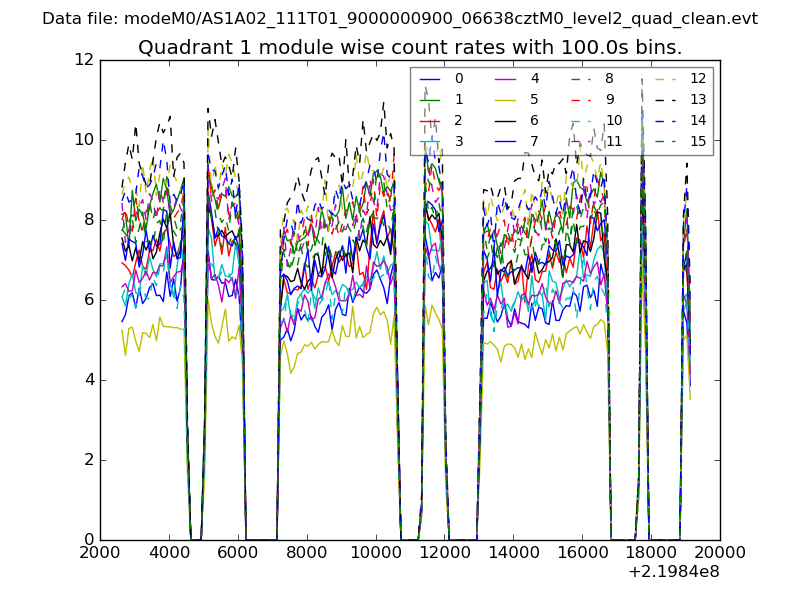
| Module-wise count rates for Quadrant A Data is divided into 100 sec bins |
 |
 |
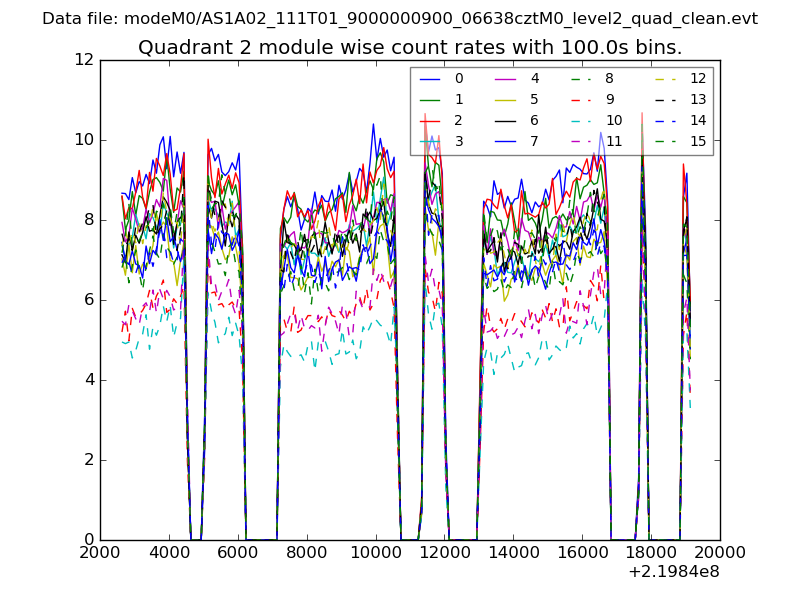
| Module-wise count rates for Quadrant B Data is divided into 100 sec bins |
 |
 |
| Module-wise count rates for Quadrant C Data is divided into 100 sec bins |
 |
 |
| Module-wise count rates for Quadrant D Data is divided into 100 sec bins |
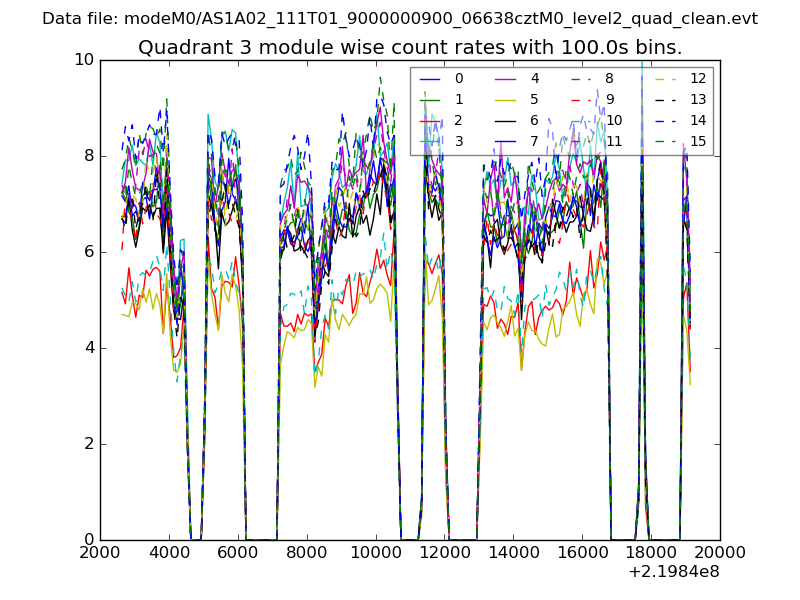 |
 |
| Parameter | Plot |
|---|---|
| CZT HV Monitor | 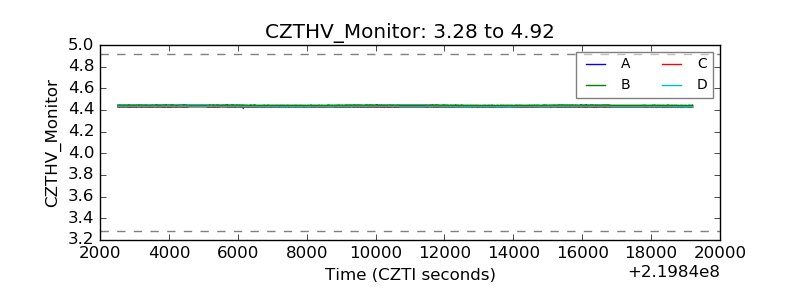 |
| D_VDD | 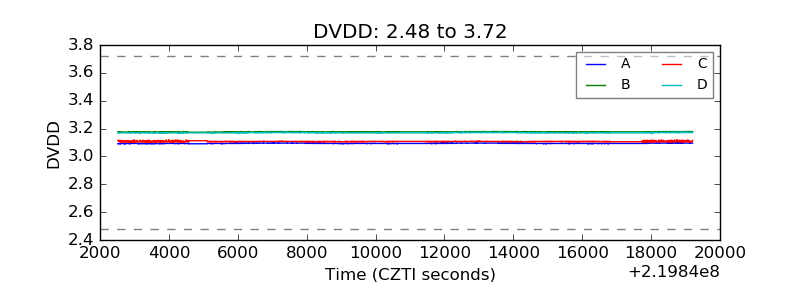 |
| Temperature 1 | 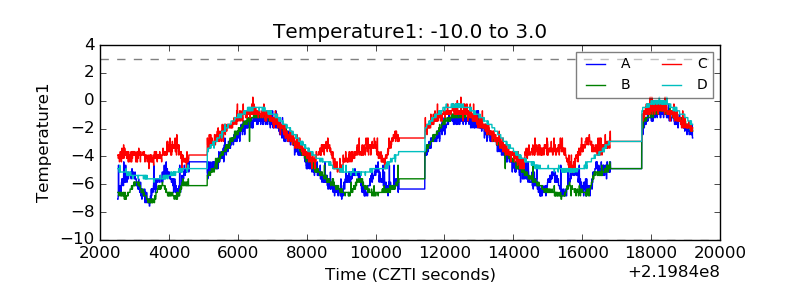 |
| Veto HV Monitor | 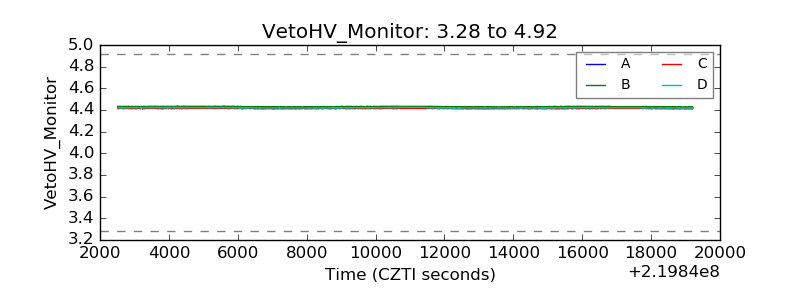 |
| Veto LLD | 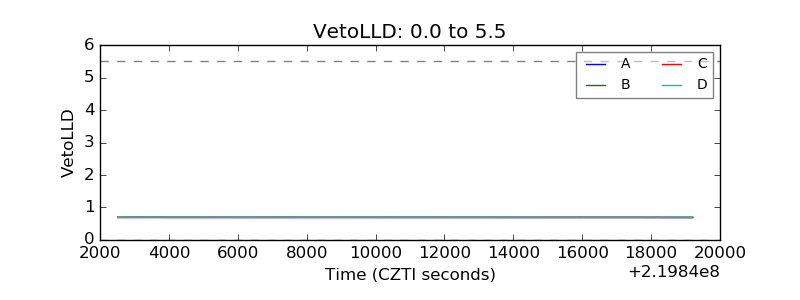 |
| Alpha Counter | 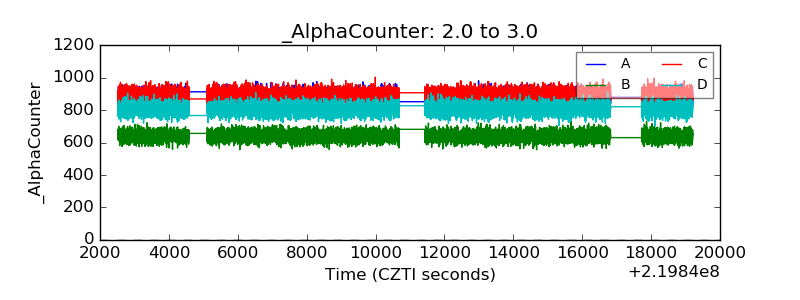 |
| _CPM_Rate | 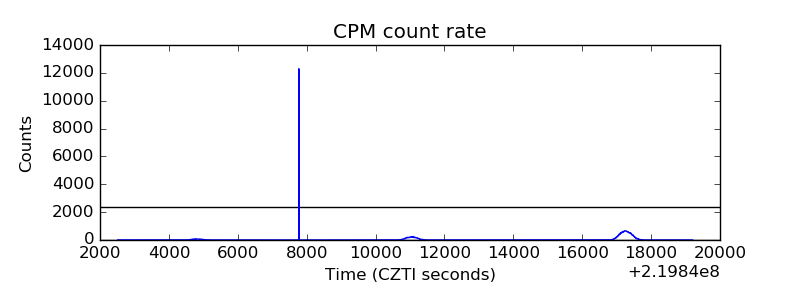 |
| CZT Counter | 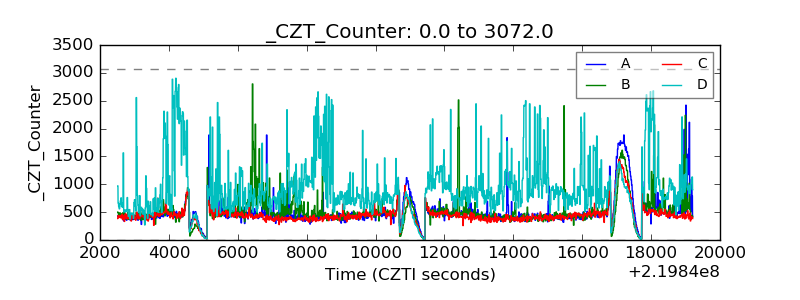 |
| +2.5 Volts monitor |  |
| +5 Volts monitor | 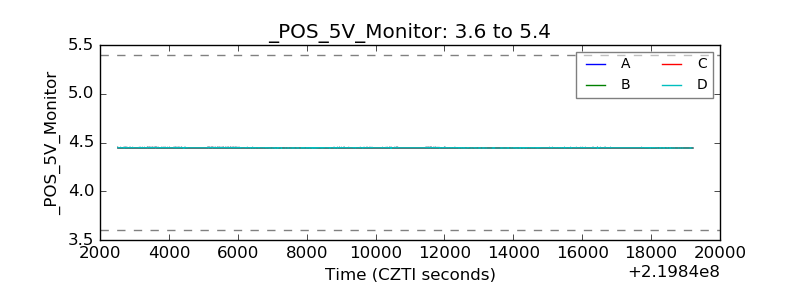 |
| _ROLL_ROT | 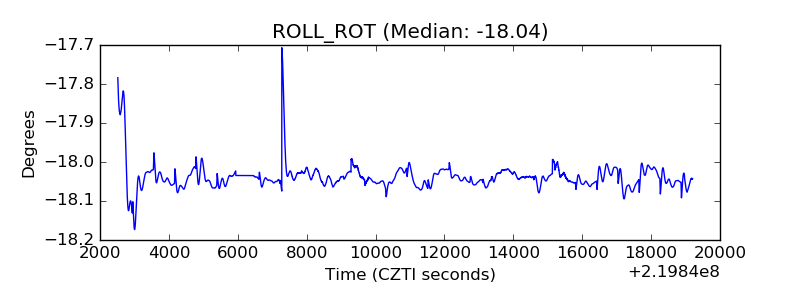 |
| _Roll_DEC | 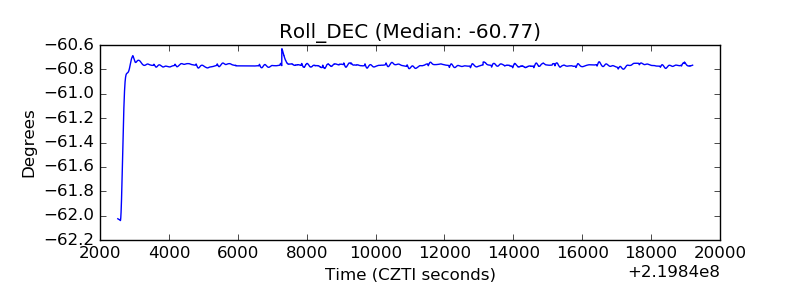 |
| _Roll_RA | 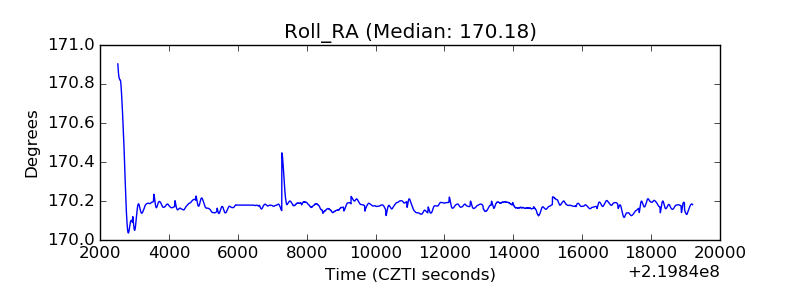 |
| Veto Counter | 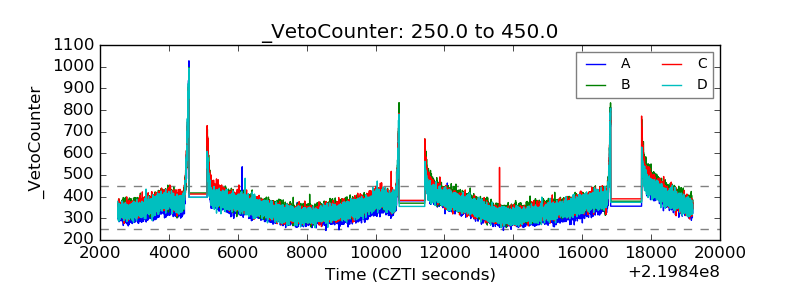 |