| Param | Original file | Final file |
|---|---|---|
| Filename | modeM0/AS1A02_111T01_9000000900_06640cztM0_level2.evt | modeM0/AS1A02_111T01_9000000900_06640cztM0_level2_quad_clean.evt |
| Size (bytes) | 1,661,060,160 | 283,622,400 |
| Size | 1.5 GB | 270.5 MB |
| Events in quadrant A | 9,380,347 | 1,862,935 |
| Events in quadrant B | 10,431,652 | 1,869,776 |
| Events in quadrant C | 8,635,107 | 1,855,668 |
| Events in quadrant D | 20,534,787 | 1,649,133 |
| Mode M0 | |||
|---|---|---|---|
| Quadrant | BADHDUFLAG | Total packets | Discarded packets |
| A | 0 | 41752 | 5 |
| B | 0 | 44293 | 4 |
| C | 0 | 39980 | 4 |
| D | 0 | 74939 | 4 |
| Mode M9 | |||
|---|---|---|---|
| Quadrant | BADHDUFLAG | Total packets | Discarded packets |
| A | 0 | 34 | 0 |
| B | 0 | 34 | 0 |
| C | 0 | 34 | 0 |
| D | 0 | 34 | 0 |
| Mode SS | |||
|---|---|---|---|
| Quadrant | BADHDUFLAG | Total packets | Discarded packets |
| A | 0 | 396 | 0 |
| B | 0 | 396 | 0 |
| C | 0 | 396 | 0 |
| D | 0 | 396 | 0 |
| Quadrant | Total seconds | Saturated seconds | Saturation percentage |
|---|---|---|---|
| A | 19648 | 349 | 1.776262% |
| B | 19648 | 491 | 2.498982% |
| C | 19648 | 197 | 1.002647% |
| D | 19648 | 2078 | 10.576140% |
Noise dominated data is calculated using 1-second bins in cleaned event files. If a bin has >2000 counts, and if more than 50% of those come from <1% of pixels, then it is considered to be noise-dominated and hence unusable.
| Quadrant | # 1 sec bins | Bins with >0 counts | Bins with >2000 counts | High rate bins dominated by noise | Noise dominated (total time) | Noise dominated (detector-on time) | Marked lightcurve |
|---|---|---|---|---|---|---|---|
| A | 22873 | 19651 | 45 | 45 | 0.20% | 0.23% | 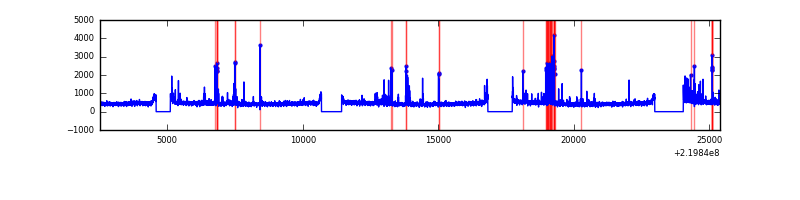 |
| B | 22873 | 19652 | 123 | 123 | 0.54% | 0.63% | 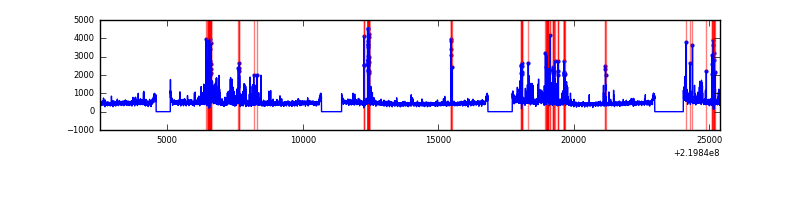 |
| C | 22873 | 19652 | 0 | 0 | 0.00% | 0.00% | 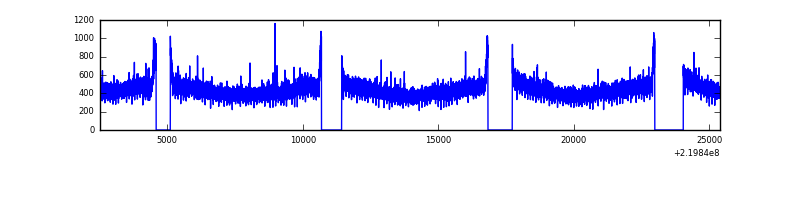 |
| D | 22873 | 19652 | 1526 | 1526 | 6.67% | 7.77% | 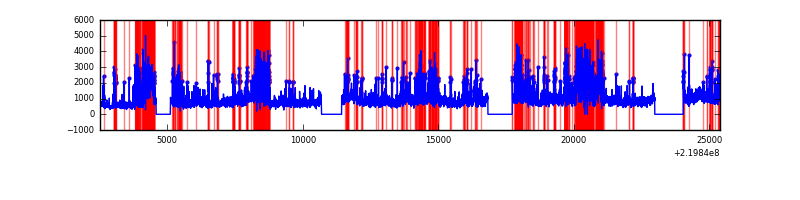 |
Top three noisy pixels from each quadrant. If the there are fewer than three noisy pixels in the level2.evt file, extra rows are filled as -1
| Pixel properties | Quadrant properties | ||||||
|---|---|---|---|---|---|---|---|
| Quadrant | DetID | PixID | Counts | Sigma | Mean | Median | Sigma |
| A | 15 | 239 | 412949 | 900.02 | 2257 | 2203 | 456.4 |
| A | 13 | 248 | 198620 | 430.39 | 2257 | 2203 | 456.4 |
| A | 8 | 15 | 48988 | 102.51 | 2257 | 2203 | 456.4 |
| B | 0 | 219 | 473278 | 1101.87 | 2274 | 2220 | 427.5 |
| B | 4 | 48 | 355297 | 825.9 | 2274 | 2220 | 427.5 |
| B | 0 | 228 | 317018 | 736.36 | 2274 | 2220 | 427.5 |
| C | 8 | 128 | 18922 | 32.95 | 2204 | 2213 | 507.1 |
| C | 13 | 61 | 17579 | 30.3 | 2204 | 2213 | 507.1 |
| C | 8 | 112 | 10439 | 16.22 | 2204 | 2213 | 507.1 |
| D | 8 | 195 | 6866486 | 13387.92 | 2108 | 2041 | 512.7 |
| D | 2 | 33 | 3992656 | 7783.01 | 2108 | 2041 | 512.7 |
| D | 2 | 63 | 336992 | 653.26 | 2108 | 2041 | 512.7 |
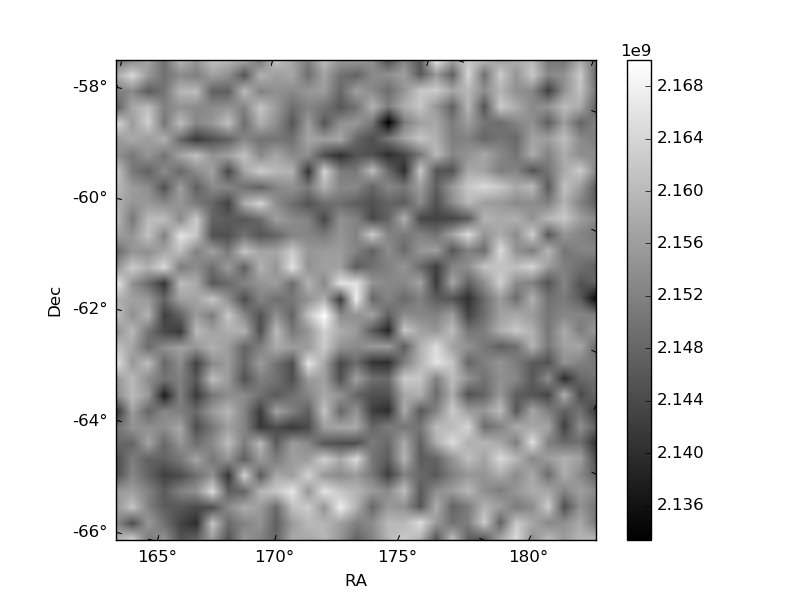
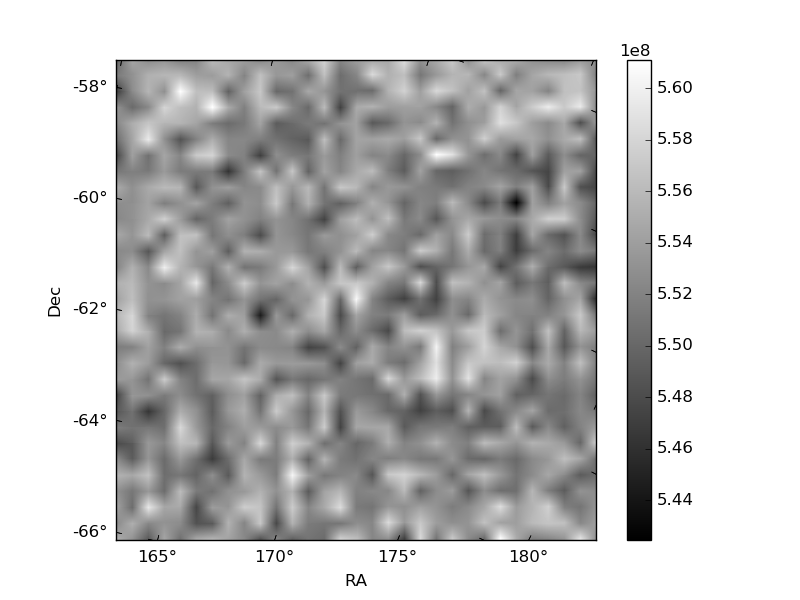
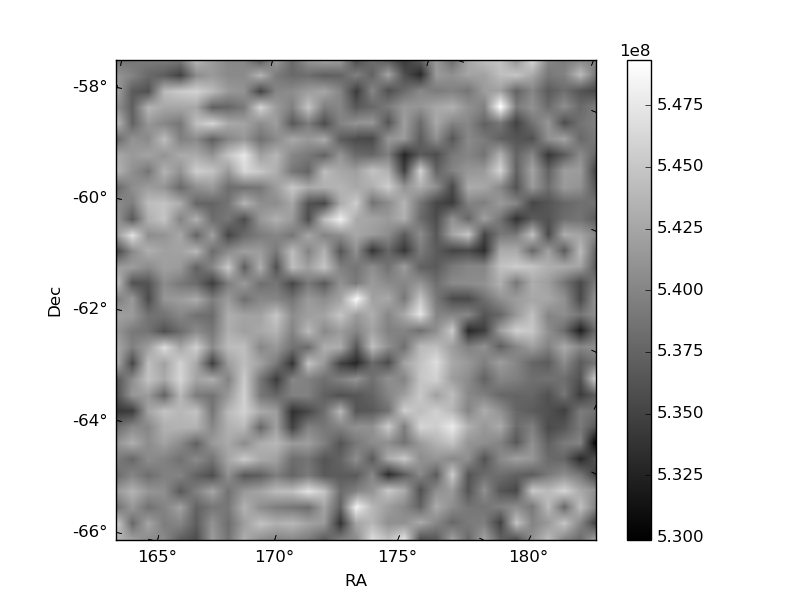
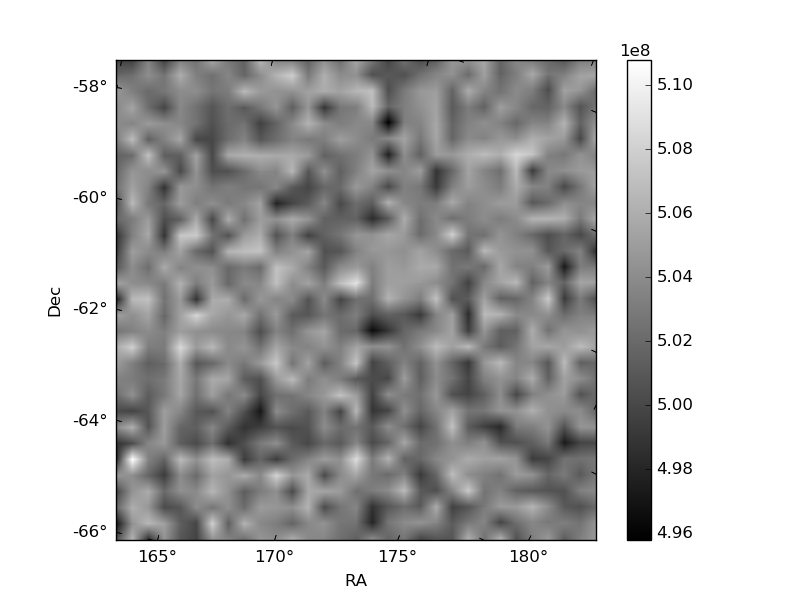
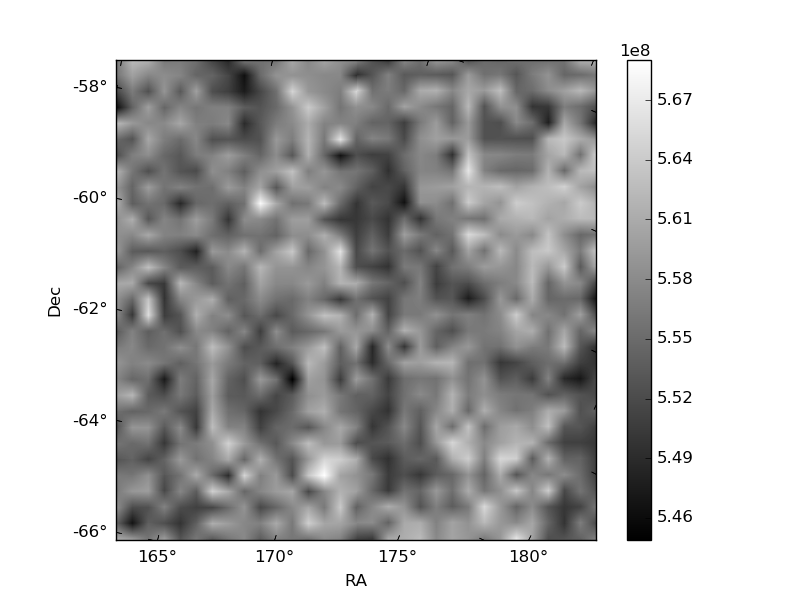
Histogram calculated using DETX and DETY for each event in the final _common_clean file
| Quadrant A | 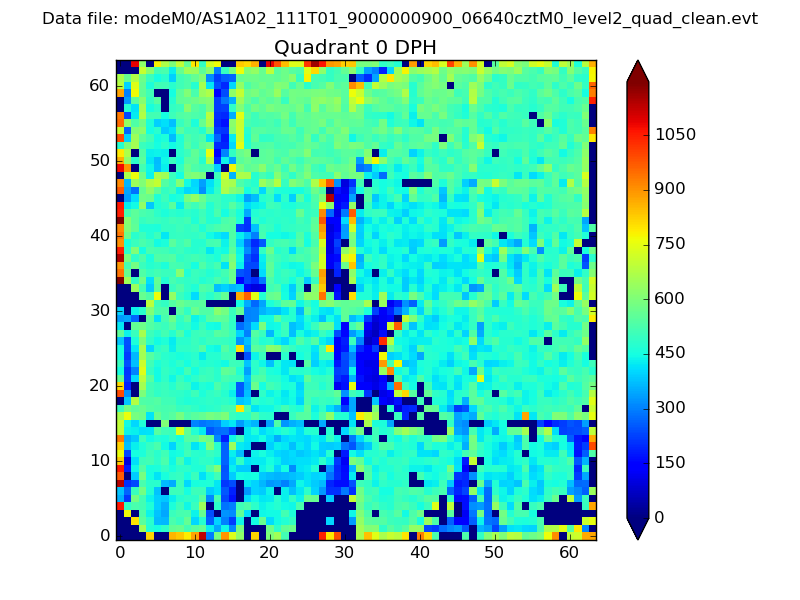 |
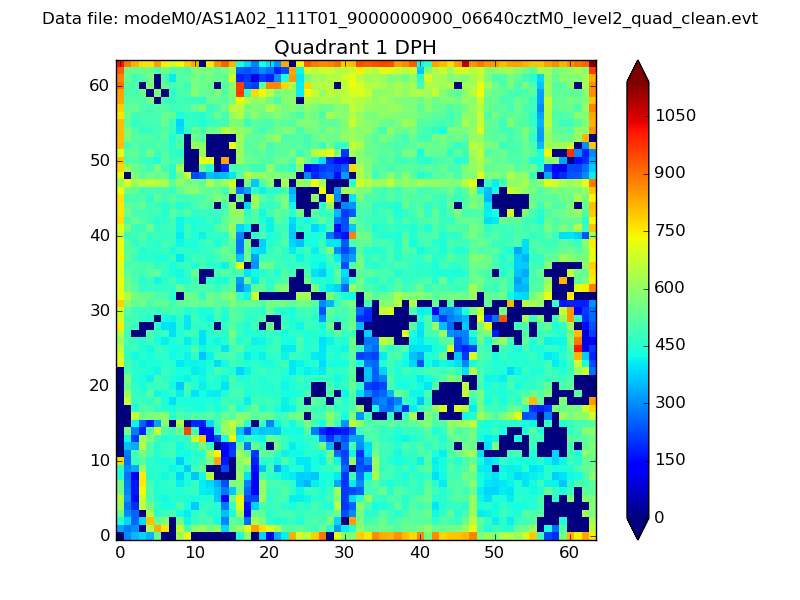 |
Quadrant B |
|---|---|---|---|
| Quadrant D | 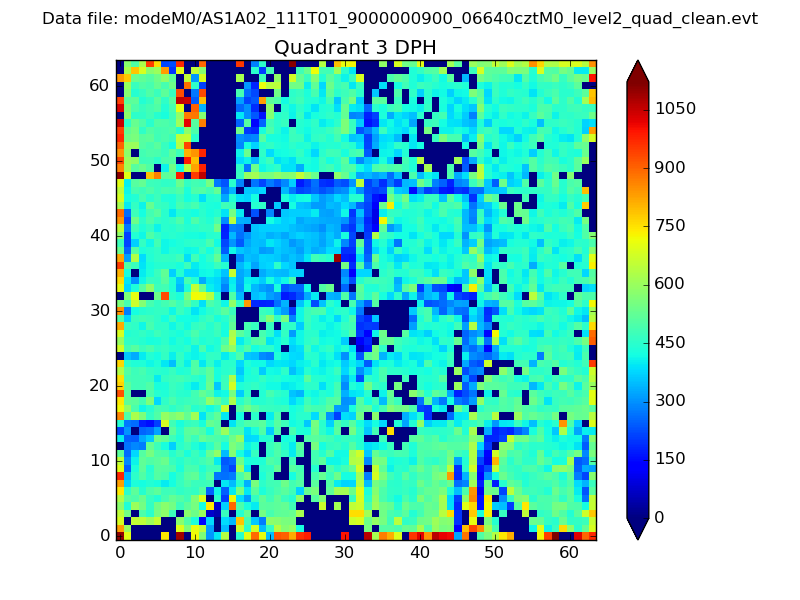 |
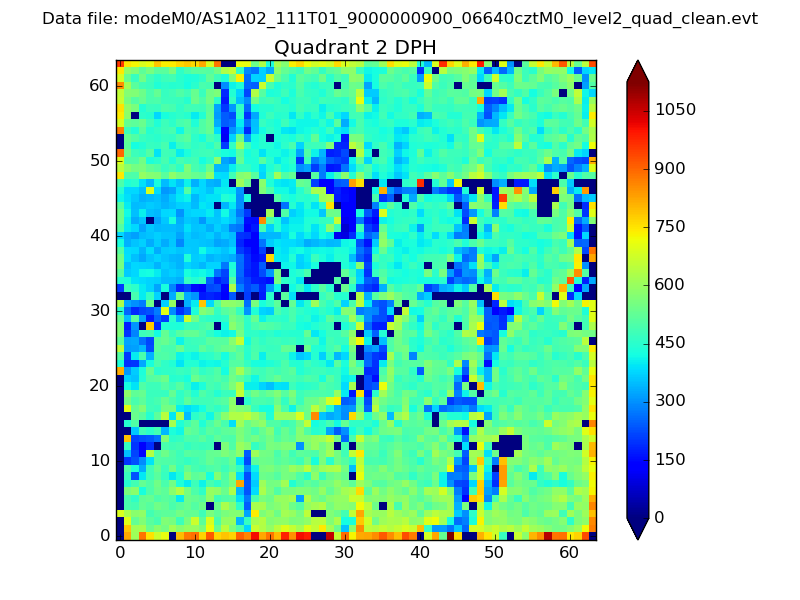 |
Quadrant C |
| Plot type | Count rate plots | Images |
|---|---|---|
| Comparison with Poisson distribution Blue bars denote a histogram of data divided into 1 sec bins. Red curve is a Poisson curve with rate = median count rate of data. |
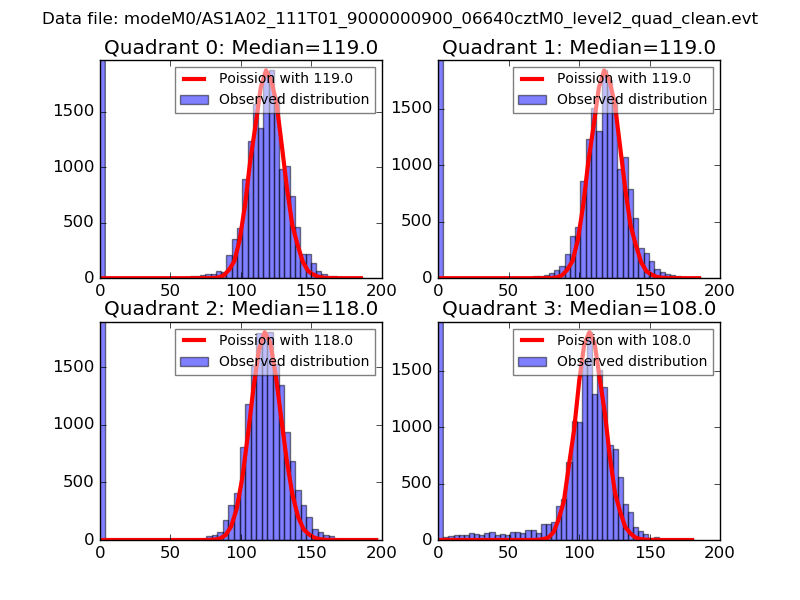 |
 |
| Quadrant-wise count rates Data is divided into 100 sec bins |
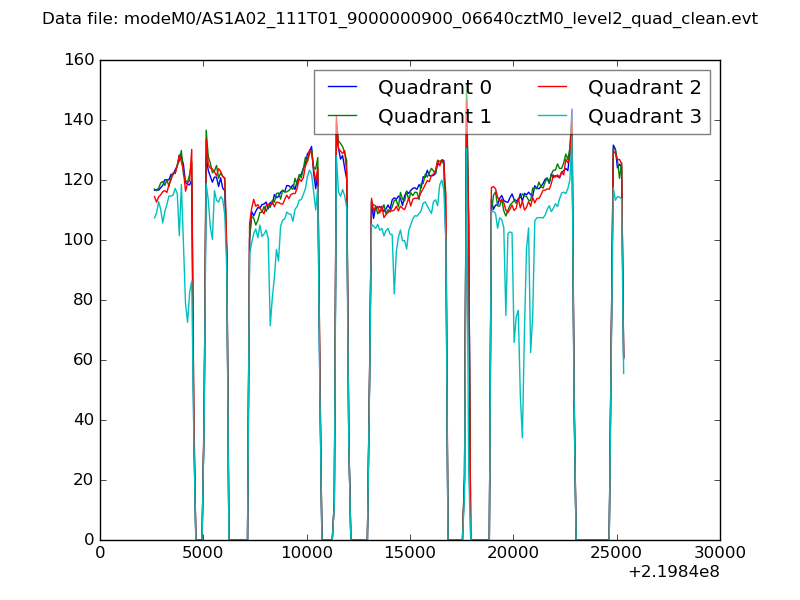 |
|
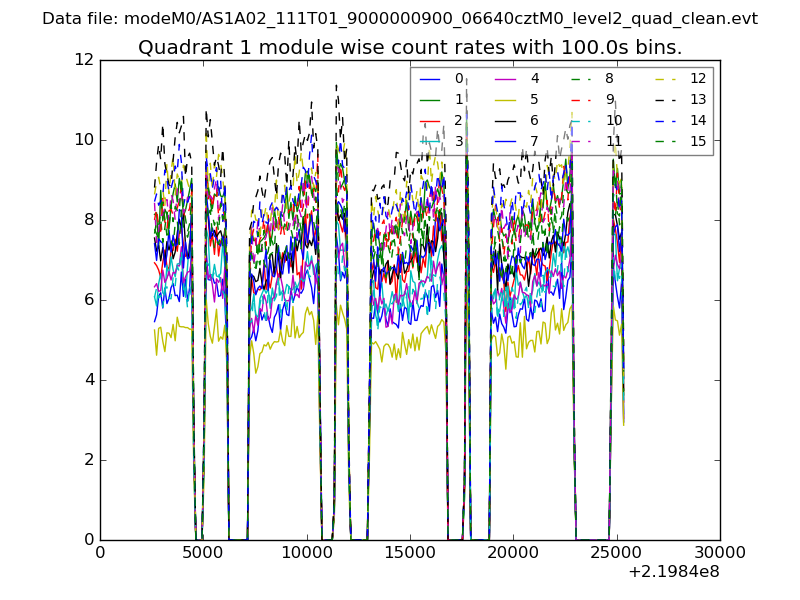
| Module-wise count rates for Quadrant A Data is divided into 100 sec bins |
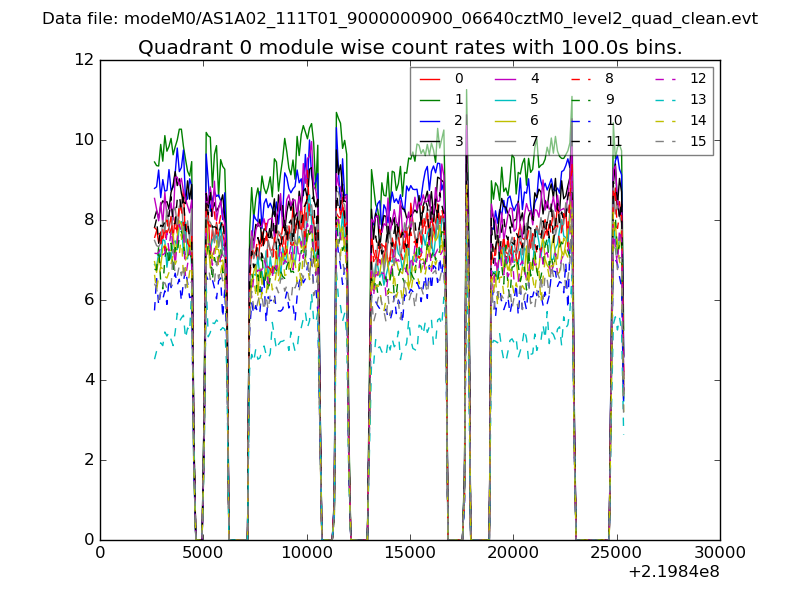 |
 |
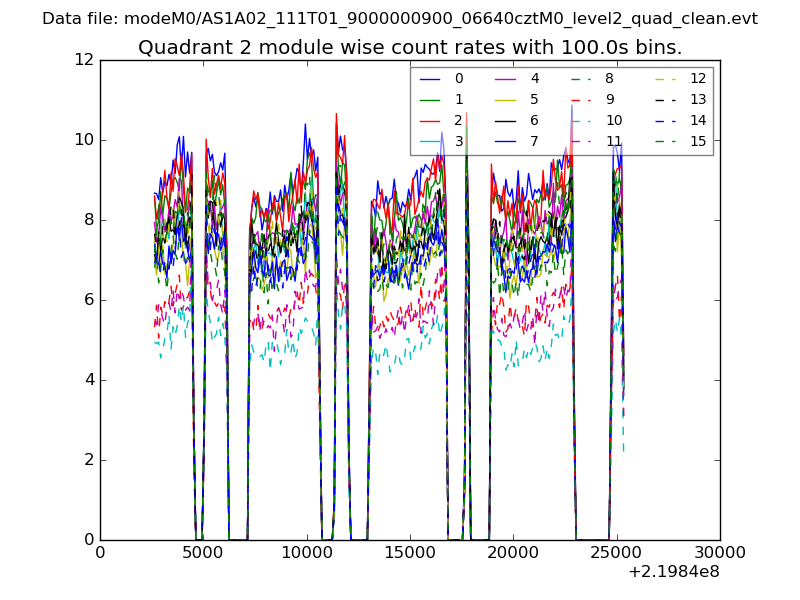
| Module-wise count rates for Quadrant B Data is divided into 100 sec bins |
 |
 |
| Module-wise count rates for Quadrant C Data is divided into 100 sec bins |
 |
 |
| Module-wise count rates for Quadrant D Data is divided into 100 sec bins |
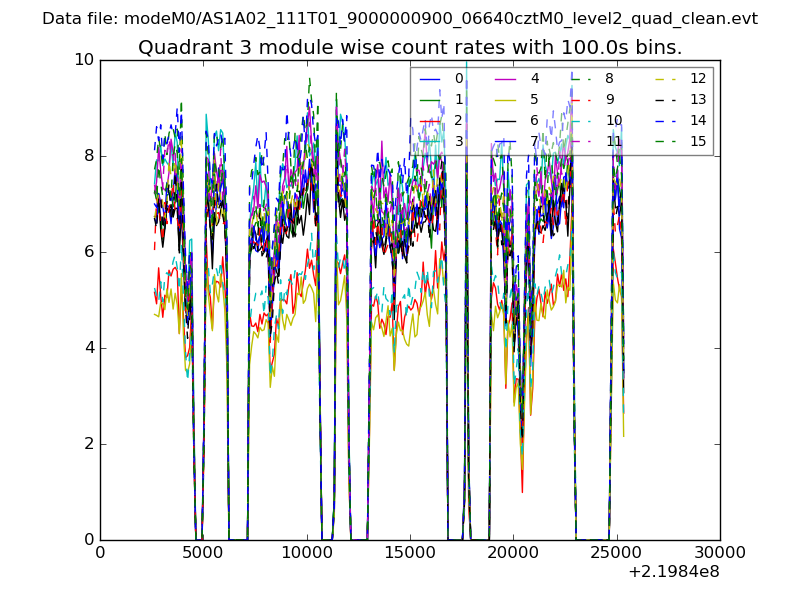 |
 |
| Parameter | Plot |
|---|---|
| CZT HV Monitor | 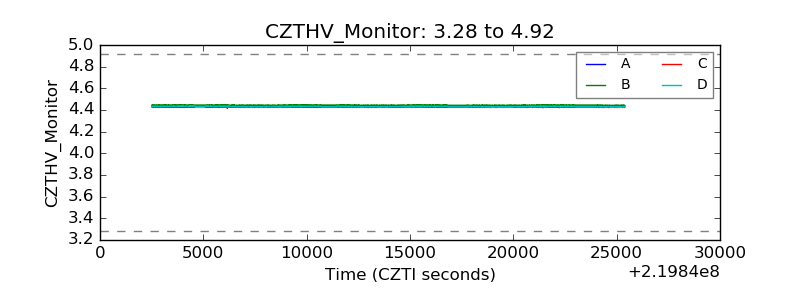 |
| D_VDD | 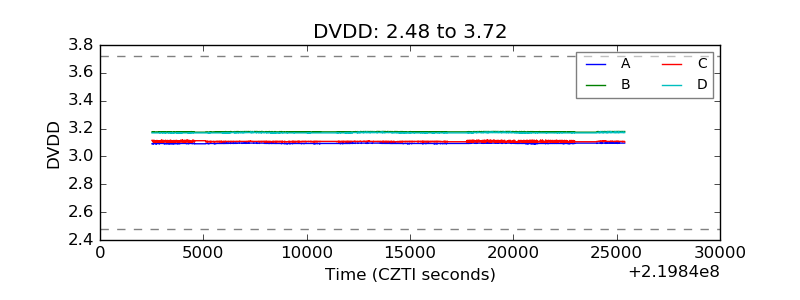 |
| Temperature 1 | 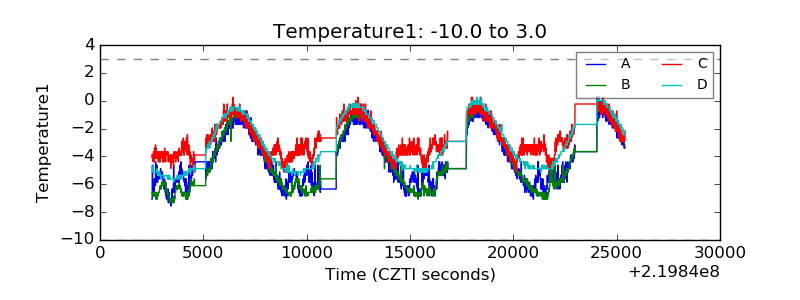 |
| Veto HV Monitor | 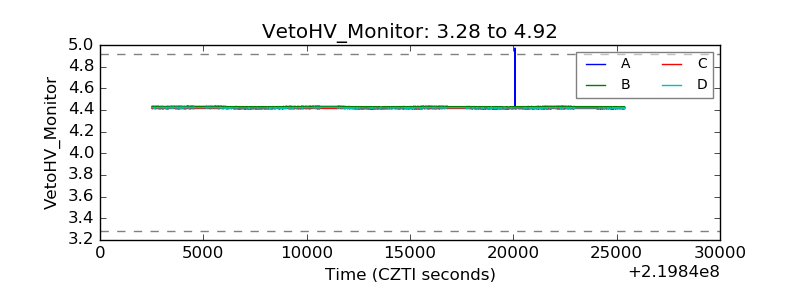 |
| Veto LLD | 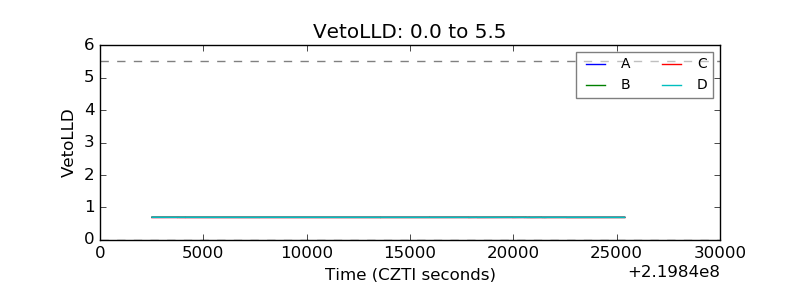 |
| Alpha Counter | 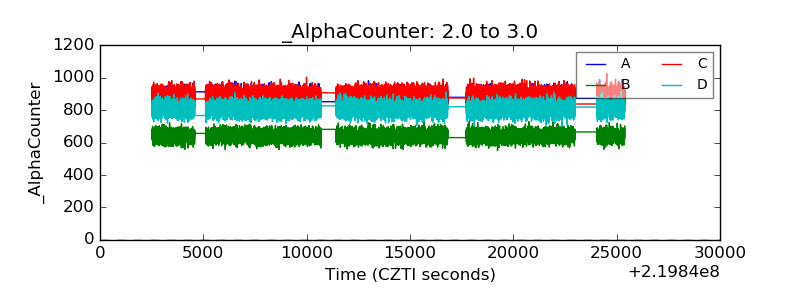 |
| _CPM_Rate | 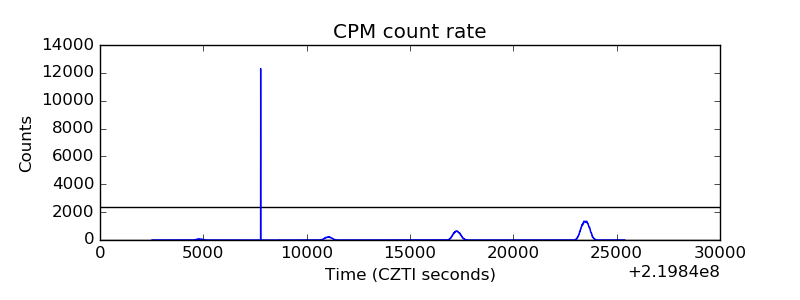 |
| CZT Counter | 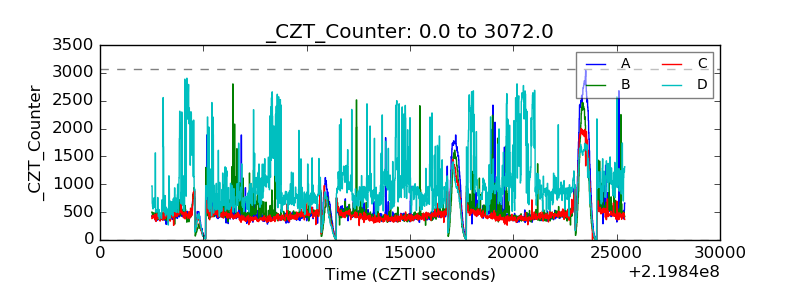 |
| +2.5 Volts monitor |  |
| +5 Volts monitor |  |
| _ROLL_ROT | 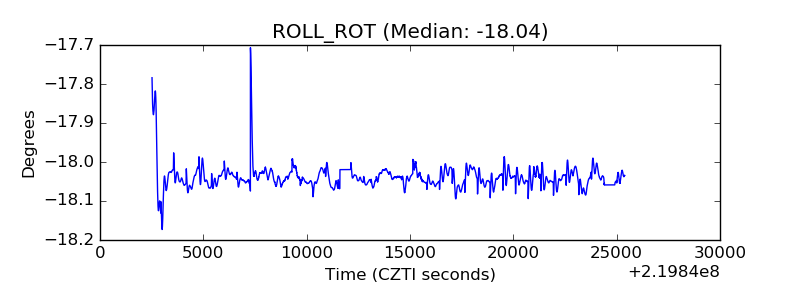 |
| _Roll_DEC | 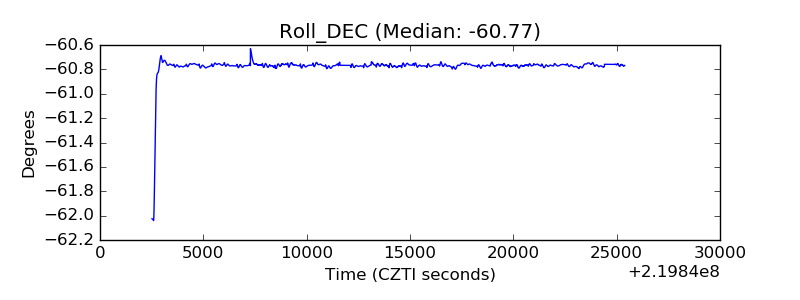 |
| _Roll_RA | 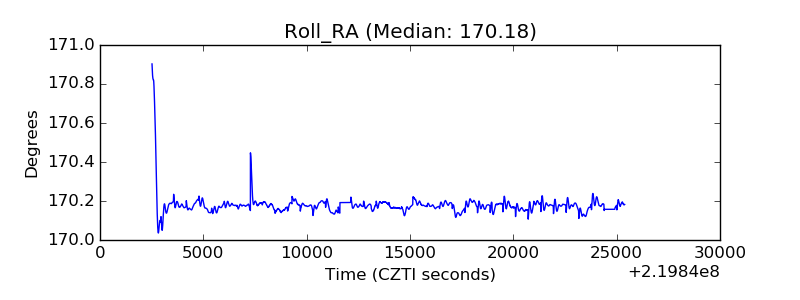 |
| Veto Counter | 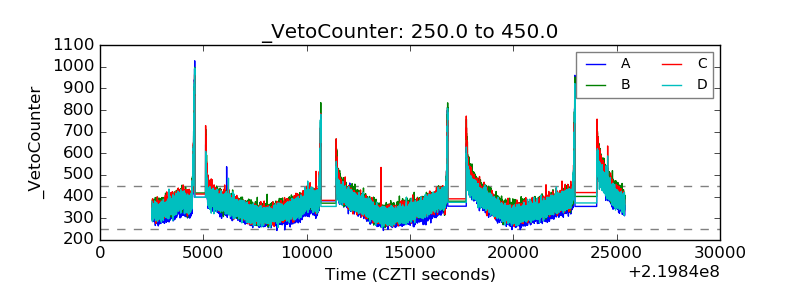 |