| Param | Original file | Final file |
|---|---|---|
| Filename | modeM0/AS1A02_111T01_9000000900_06641cztM0_level2.evt | modeM0/AS1A02_111T01_9000000900_06641cztM0_level2_quad_clean.evt |
| Size (bytes) | 355,029,120 | 78,842,880 |
| Size | 338.6 MB | 75.2 MB |
| Events in quadrant A | 2,409,918 | 524,868 |
| Events in quadrant B | 2,212,821 | 533,165 |
| Events in quadrant C | 1,949,494 | 521,908 |
| Events in quadrant D | 3,868,829 | 486,374 |
| Mode M0 | |||
|---|---|---|---|
| Quadrant | BADHDUFLAG | Total packets | Discarded packets |
| A | 0 | 10438 | 0 |
| B | 0 | 9734 | 0 |
| C | 0 | 9201 | 0 |
| D | 0 | 14789 | 0 |
| Mode M9 | |||
|---|---|---|---|
| Quadrant | BADHDUFLAG | Total packets | Discarded packets |
| A | 0 | 4 | 0 |
| B | 0 | 4 | 0 |
| C | 0 | 4 | 0 |
| D | 0 | 4 | 0 |
| Mode SS | |||
|---|---|---|---|
| Quadrant | BADHDUFLAG | Total packets | Discarded packets |
| A | 0 | 94 | 0 |
| B | 0 | 94 | 0 |
| C | 0 | 94 | 0 |
| D | 0 | 94 | 0 |
| Quadrant | Total seconds | Saturated seconds | Saturation percentage |
|---|---|---|---|
| A | 4567 | 115 | 2.518064% |
| B | 4567 | 54 | 1.182395% |
| C | 4567 | 17 | 0.372236% |
| D | 4567 | 100 | 2.189621% |
Noise dominated data is calculated using 1-second bins in cleaned event files. If a bin has >2000 counts, and if more than 50% of those come from <1% of pixels, then it is considered to be noise-dominated and hence unusable.
| Quadrant | # 1 sec bins | Bins with >0 counts | Bins with >2000 counts | High rate bins dominated by noise | Noise dominated (total time) | Noise dominated (detector-on time) | Marked lightcurve |
|---|---|---|---|---|---|---|---|
| A | 4567 | 4567 | 25 | 25 | 0.55% | 0.55% | 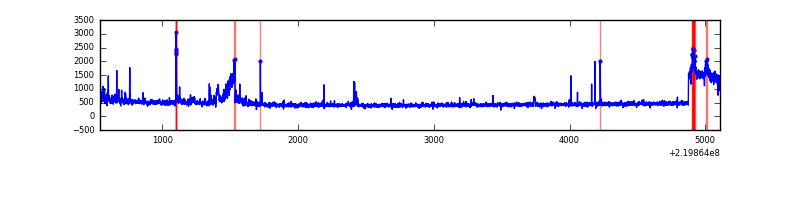 |
| B | 4567 | 4567 | 18 | 18 | 0.39% | 0.39% | 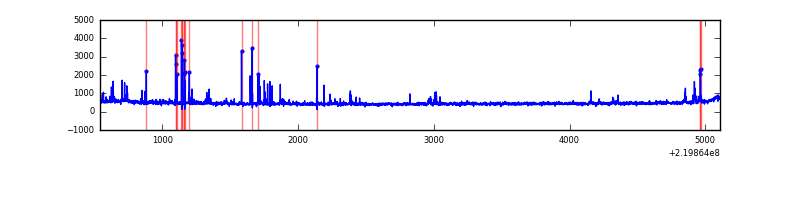 |
| C | 4567 | 4567 | 0 | 0 | 0.00% | 0.00% | 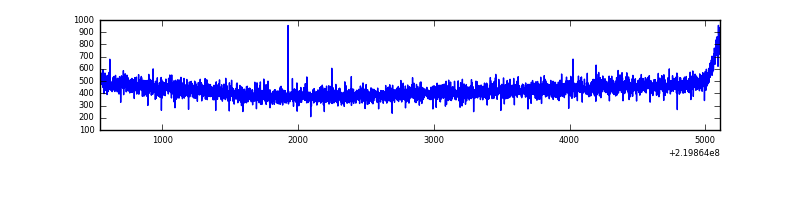 |
| D | 4567 | 4567 | 75 | 75 | 1.64% | 1.64% | 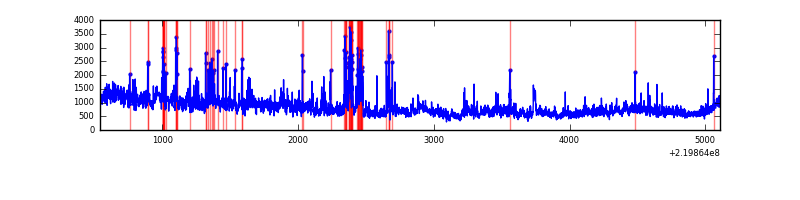 |
Top three noisy pixels from each quadrant. If the there are fewer than three noisy pixels in the level2.evt file, extra rows are filled as -1
| Pixel properties | Quadrant properties | ||||||
|---|---|---|---|---|---|---|---|
| Quadrant | DetID | PixID | Counts | Sigma | Mean | Median | Sigma |
| A | 15 | 239 | 333465 | 3209.17 | 509 | 496 | 103.8 |
| A | 13 | 248 | 52686 | 503.01 | 509 | 496 | 103.8 |
| A | 8 | 15 | 44196 | 421.18 | 509 | 496 | 103.8 |
| B | 0 | 219 | 126059 | 1289.05 | 517 | 506 | 97.4 |
| B | 4 | 48 | 29582 | 298.52 | 517 | 506 | 97.4 |
| B | 4 | 81 | 12302 | 121.11 | 517 | 506 | 97.4 |
| C | 13 | 61 | 3961 | 30.01 | 499 | 502 | 115.3 |
| C | 9 | 247 | 2265 | 15.29 | 499 | 502 | 115.3 |
| C | 3 | 202 | 1224 | 6.26 | 499 | 502 | 115.3 |
| D | 8 | 195 | 1542314 | 12746.1 | 492 | 477 | 121.0 |
| D | 2 | 33 | 174893 | 1441.87 | 492 | 477 | 121.0 |
| D | 2 | 152 | 69223 | 568.31 | 492 | 477 | 121.0 |
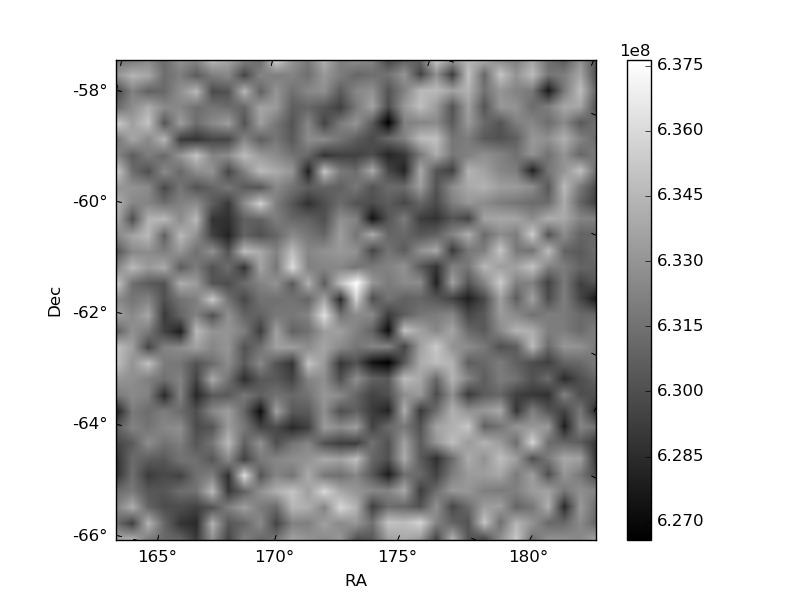
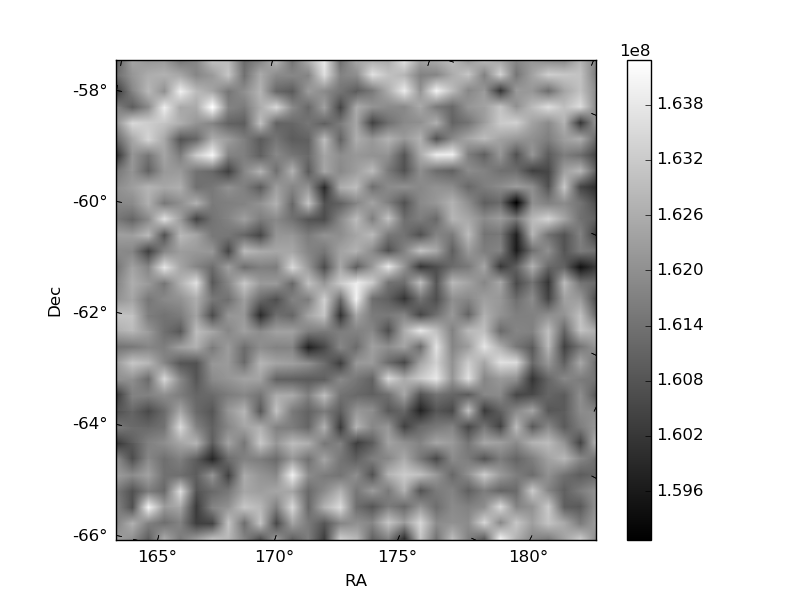
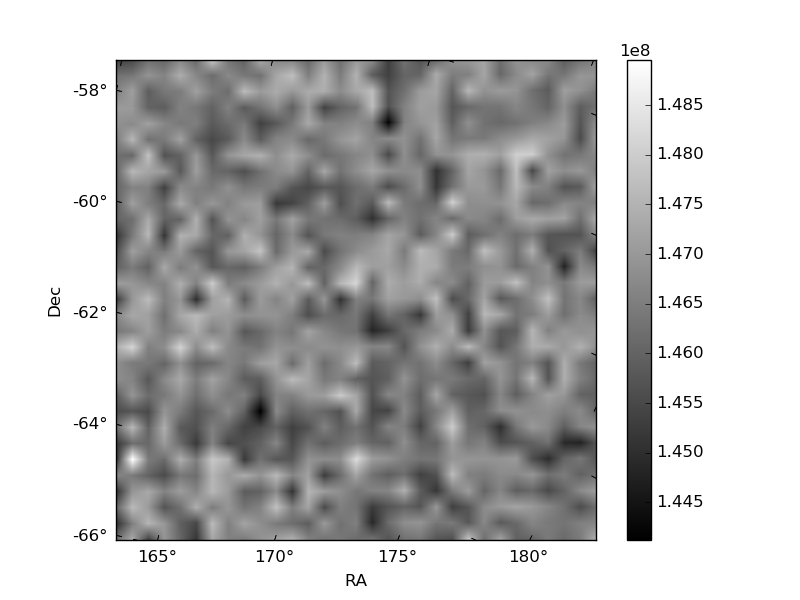
Histogram calculated using DETX and DETY for each event in the final _common_clean file
| Quadrant A | 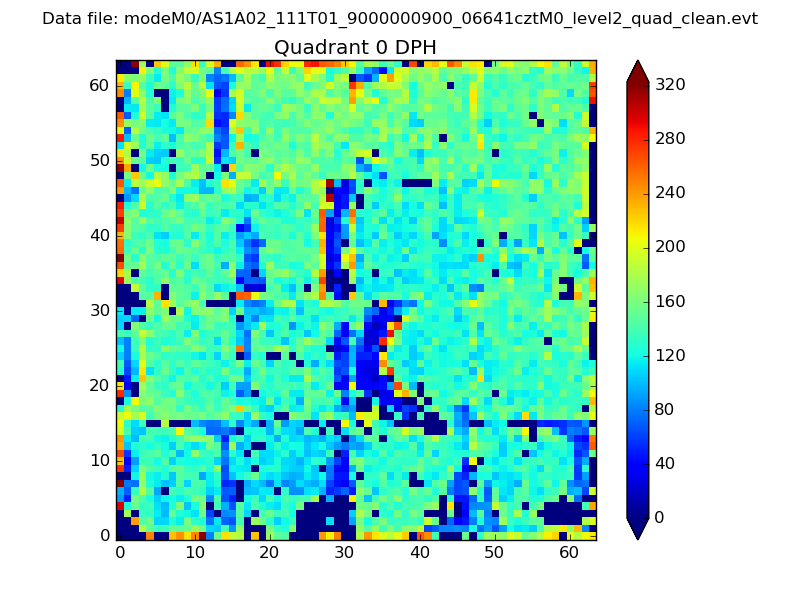 |
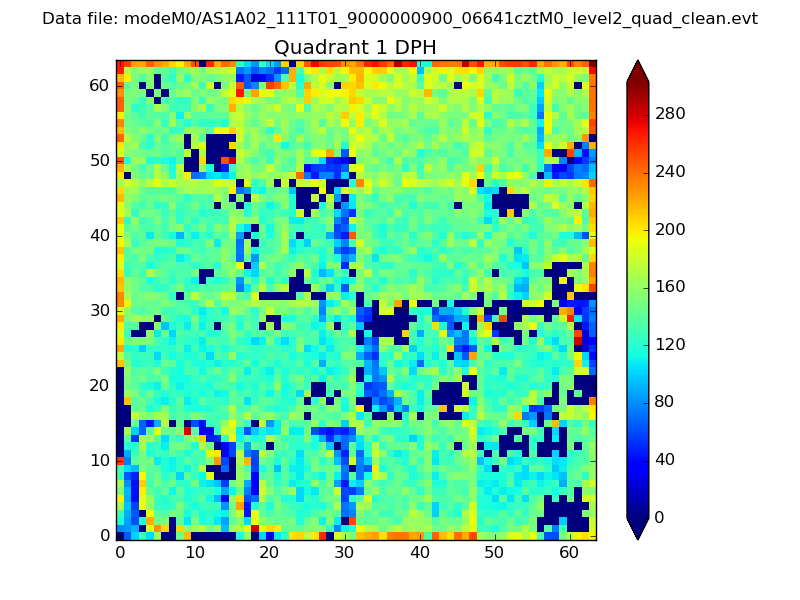 |
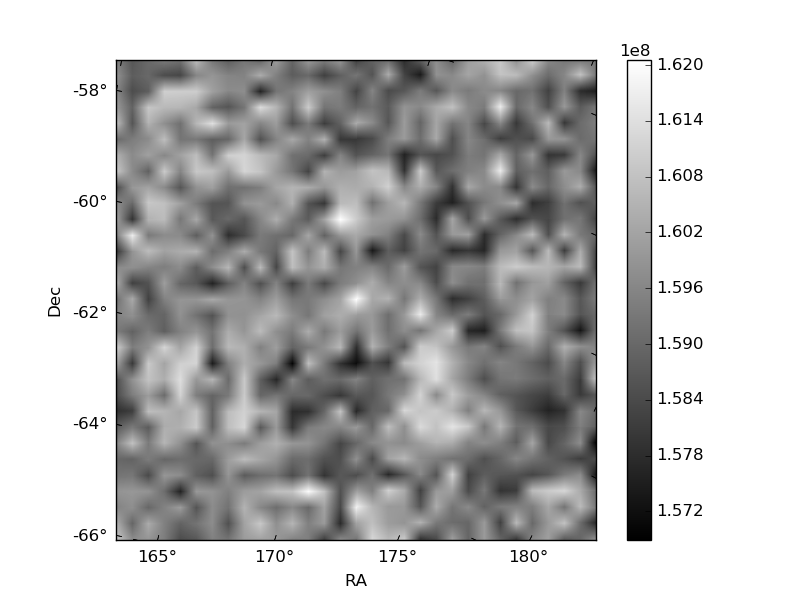
Quadrant B |
|---|---|---|---|
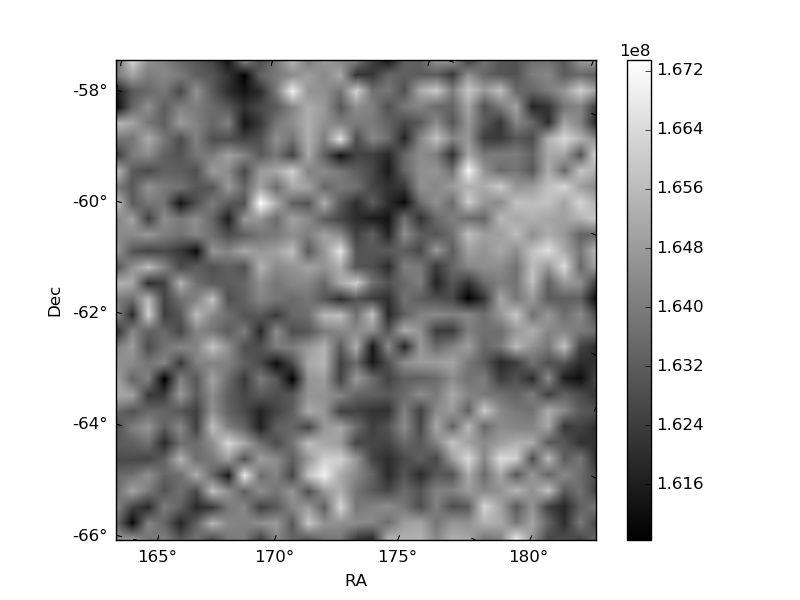
| Quadrant D | 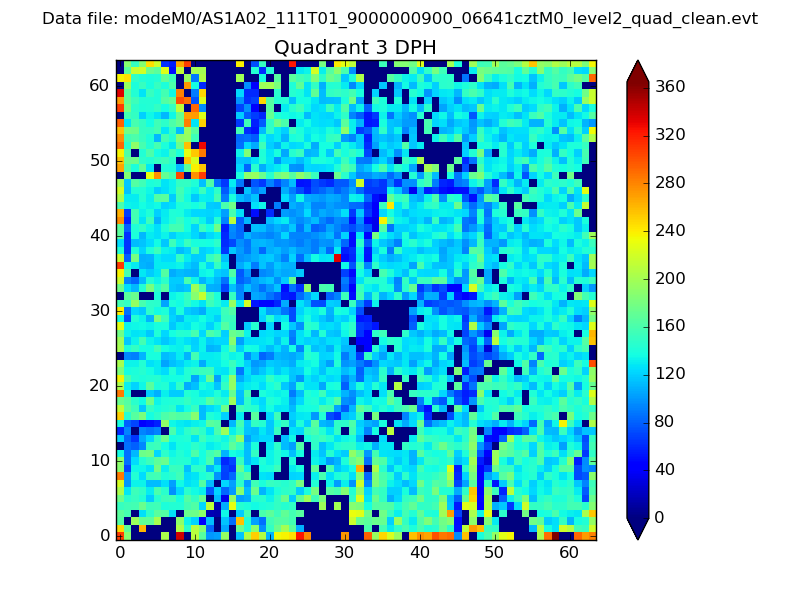 |
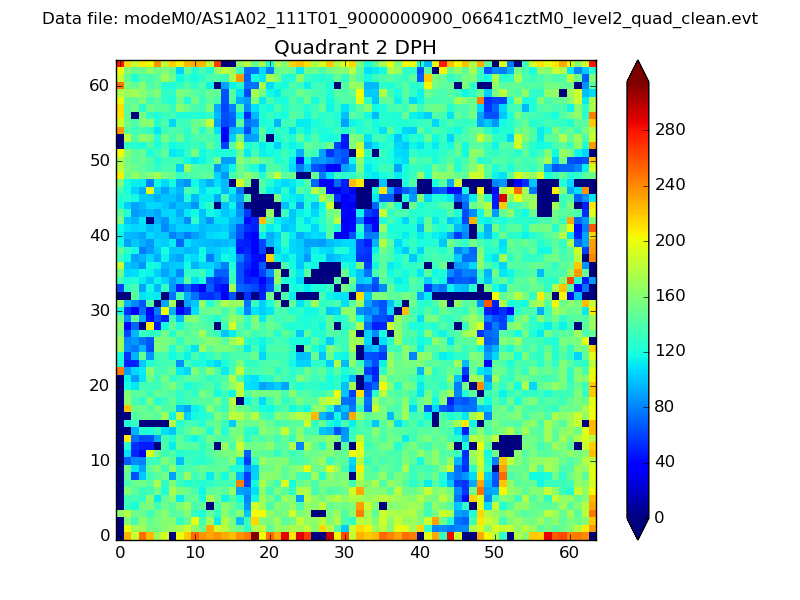 |
Quadrant C |
| Plot type | Count rate plots | Images |
|---|---|---|
| Comparison with Poisson distribution Blue bars denote a histogram of data divided into 1 sec bins. Red curve is a Poisson curve with rate = median count rate of data. |
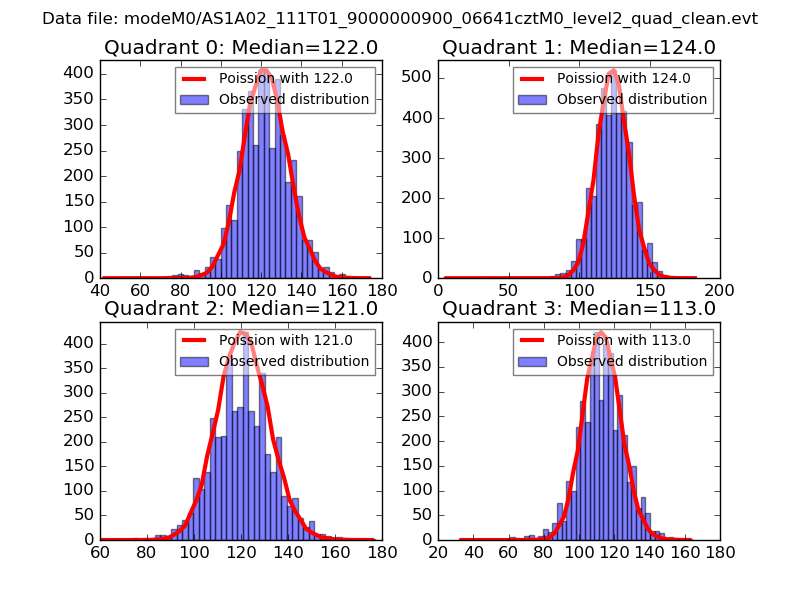 |
 |
| Quadrant-wise count rates Data is divided into 100 sec bins |
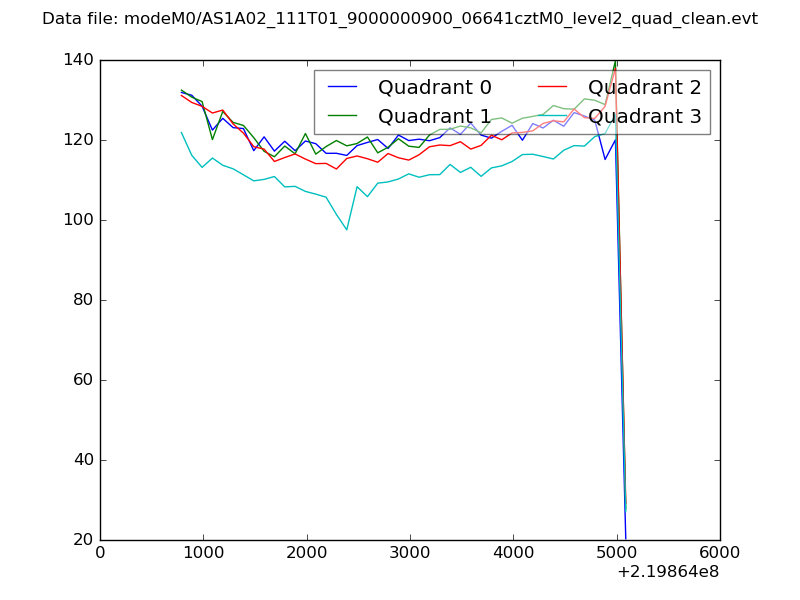 |
|
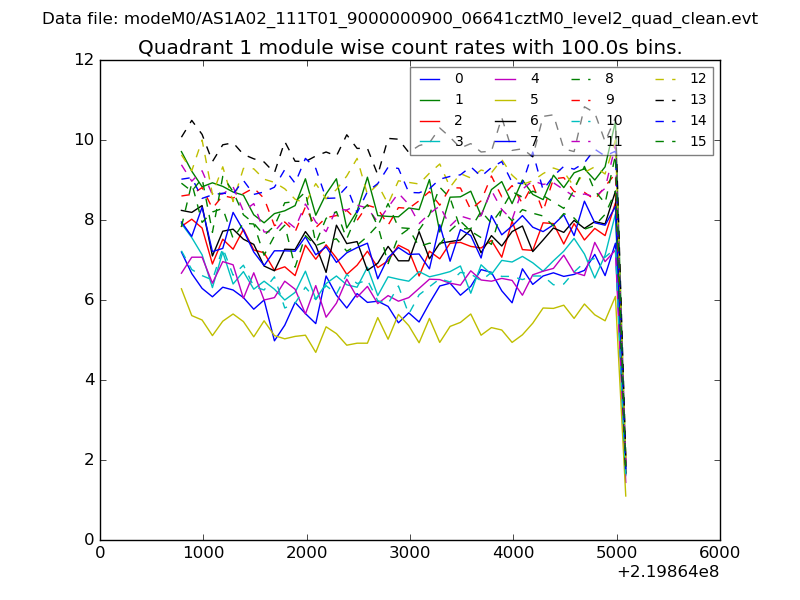
| Module-wise count rates for Quadrant A Data is divided into 100 sec bins |
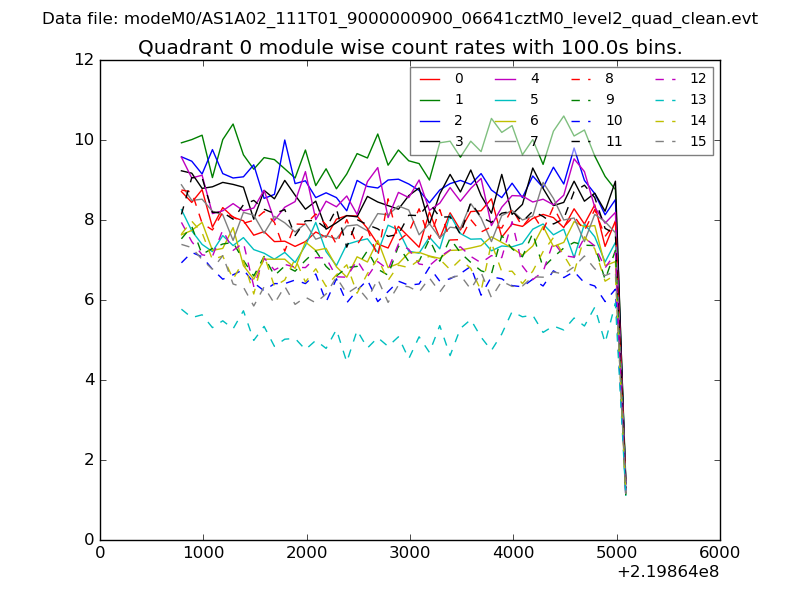 |
 |
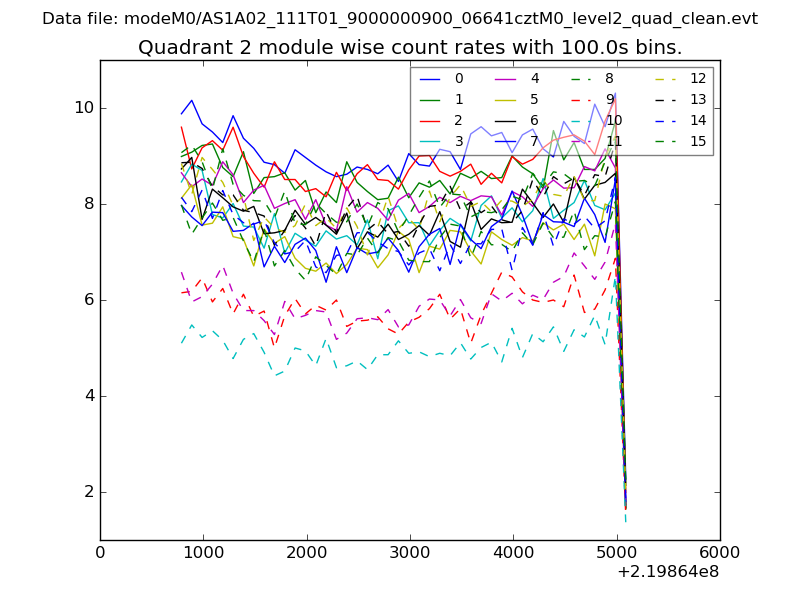
| Module-wise count rates for Quadrant B Data is divided into 100 sec bins |
 |
 |
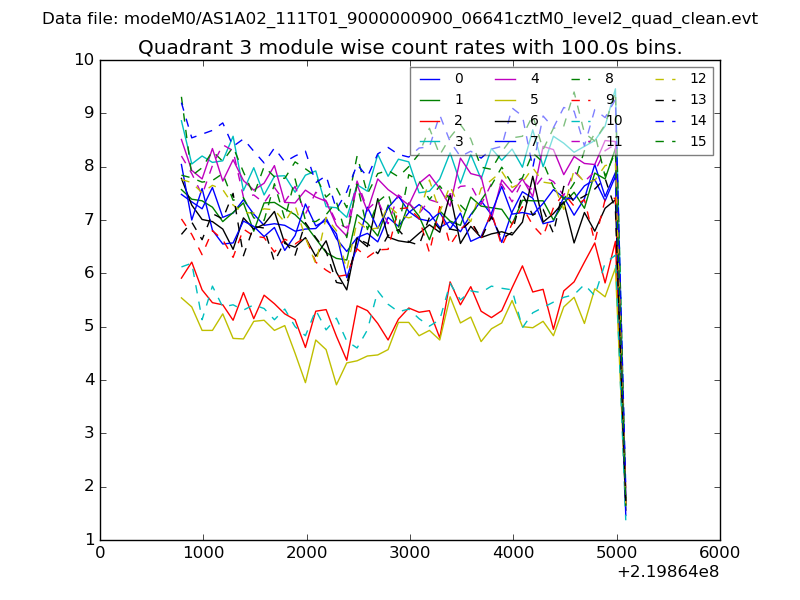
| Module-wise count rates for Quadrant C Data is divided into 100 sec bins |
 |
 |
| Module-wise count rates for Quadrant D Data is divided into 100 sec bins |
 |
 |
| Parameter | Plot |
|---|---|
| CZT HV Monitor | 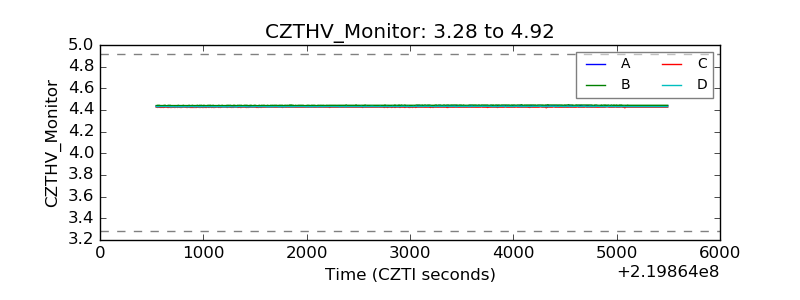 |
| D_VDD | 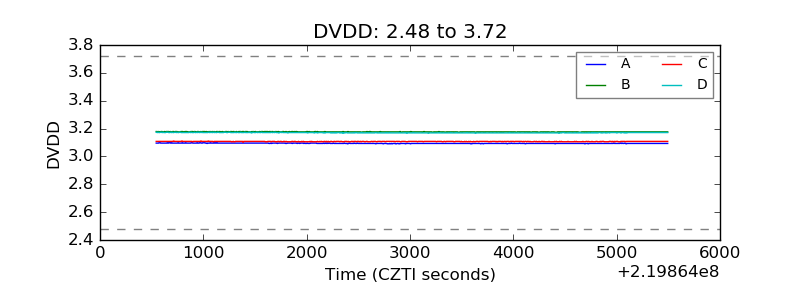 |
| Temperature 1 | 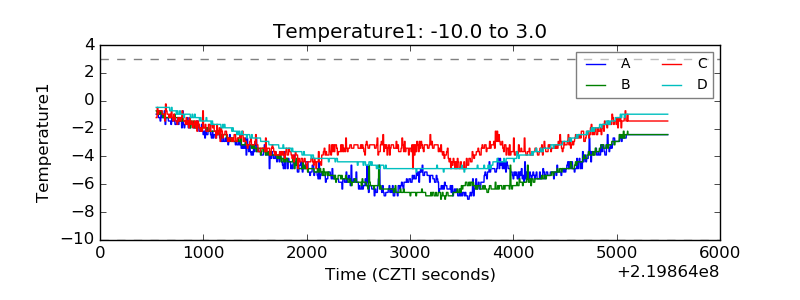 |
| Veto HV Monitor | 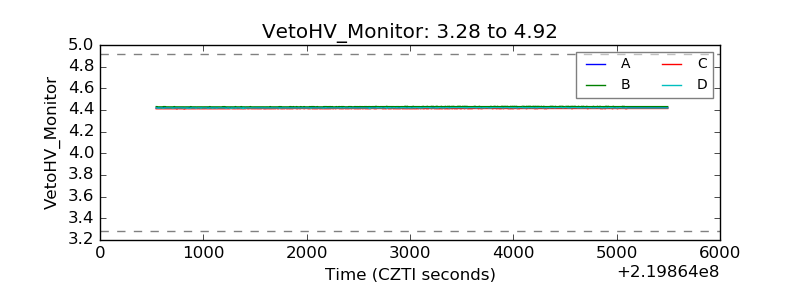 |
| Veto LLD | 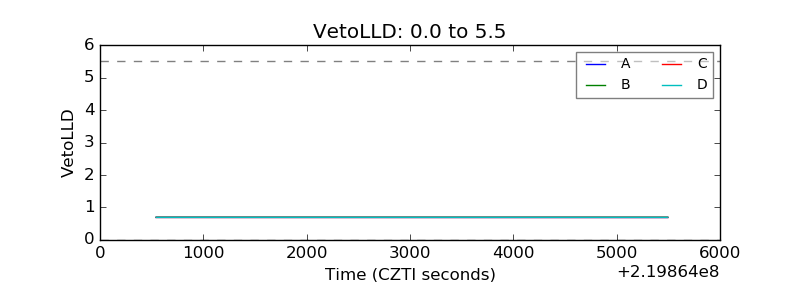 |
| Alpha Counter | 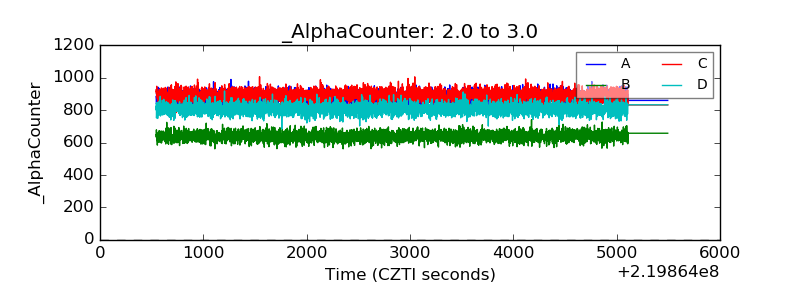 |
| _CPM_Rate | 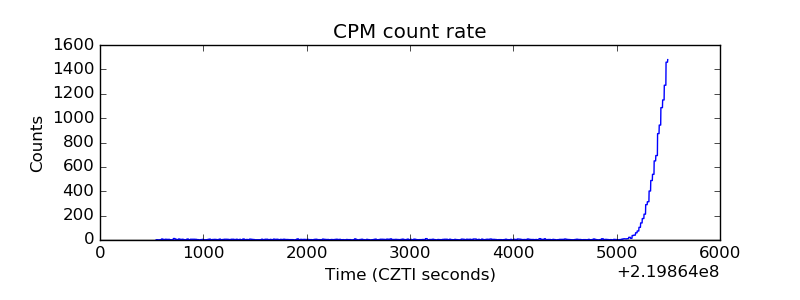 |
| CZT Counter | 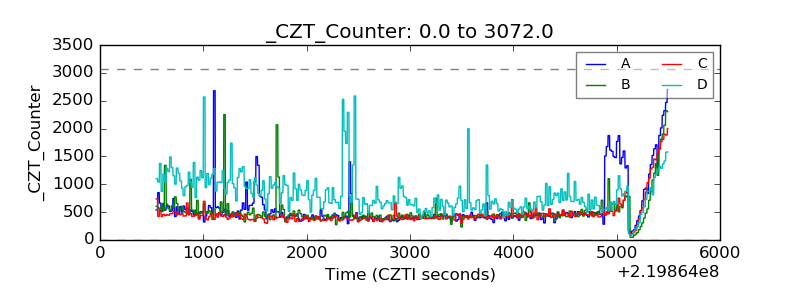 |
| +2.5 Volts monitor |  |
| +5 Volts monitor |  |
| _ROLL_ROT | 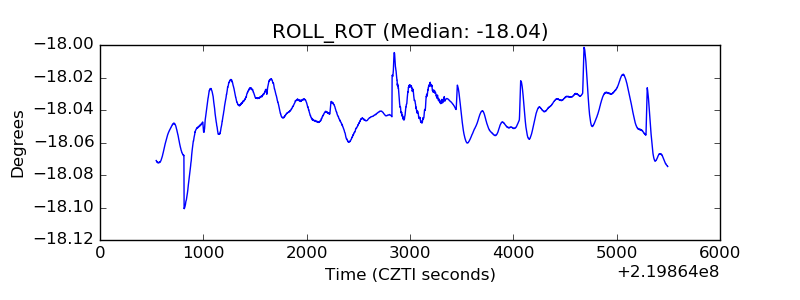 |
| _Roll_DEC | 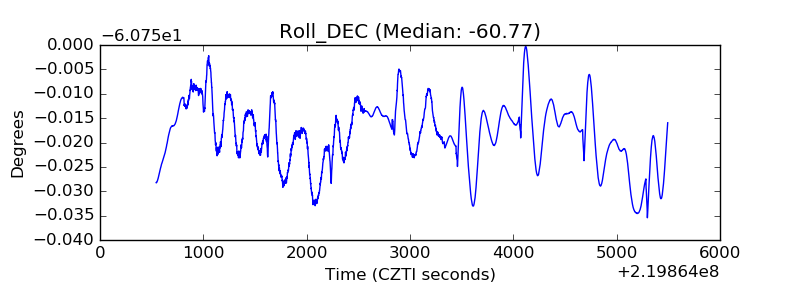 |
| _Roll_RA | 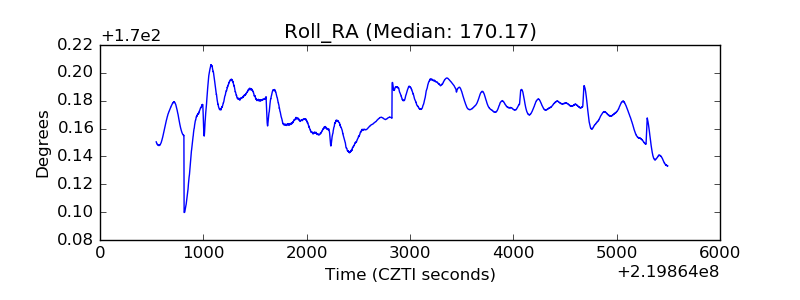 |
| Veto Counter | 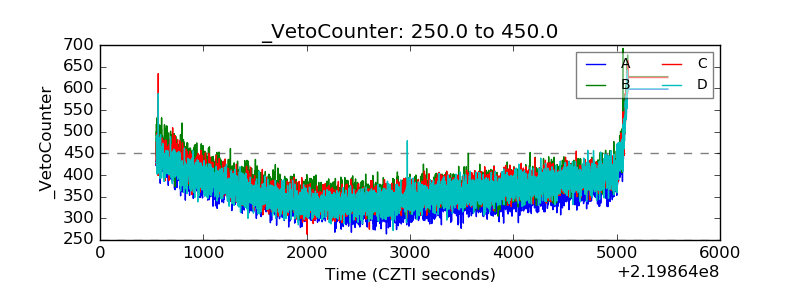 |