| Param | Original file | Final file |
|---|---|---|
| Filename | modeM0/AS1A02_189T01_9000000902cztM0_level2.fits | modeM0/AS1A02_189T01_9000000902cztM0_level2_quad_clean.evt |
| Size (bytes) | 340,263,360 | 375,814,080 |
| Size | 324.5 MB | 358.4 MB |
| Events in quadrant A | 2,041,132 | 2,296,361 |
| Events in quadrant B | 1,984,102 | 2,310,110 |
| Events in quadrant C | 2,037,538 | 2,231,289 |
| Events in quadrant D | 1,660,300 | 1,963,795 |
| Mode M9 | |||
|---|---|---|---|
| Quadrant | BADHDUFLAG | Total packets | Discarded packets |
| A | 0 | 63 | 0 |
| B | 0 | 63 | 0 |
| C | 0 | 63 | 0 |
| D | 0 | 63 | 0 |
| Mode M0 | |||
|---|---|---|---|
| Quadrant | BADHDUFLAG | Total packets | Discarded packets |
| A | 0 | 85498 | 0 |
| B | 0 | 85952 | 0 |
| C | 0 | 77020 | 0 |
| D | 0 | 114003 | 0 |
| Mode SS | |||
|---|---|---|---|
| Quadrant | BADHDUFLAG | Total packets | Discarded packets |
| A | 0 | 768 | 0 |
| B | 0 | 768 | 0 |
| C | 0 | 762 | 0 |
| D | 0 | 764 | 0 |
| Quadrant | Total seconds | Saturated seconds | Saturation percentage |
|---|---|---|---|
| A | 37575 | 698 | 1.857618% |
| B | 37573 | 1263 | 3.361456% |
| C | 37588 | 256 | 0.681068% |
| D | 37523 | 2944 | 7.845855% |
Noise dominated data is calculated using 1-second bins in cleaned event files. If a bin has >2000 counts, and if more than 50% of those come from <1% of pixels, then it is considered to be noise-dominated and hence unusable.
| Quadrant | # 1 sec bins | Bins with >0 counts | Bins with >2000 counts | High rate bins dominated by noise | Noise dominated (total time) | Noise dominated (detector-on time) | Marked lightcurve |
|---|---|---|---|---|---|---|---|
| A | 44123 | 37697 | 0 | 0 | 0.00% | 0.00% |  |
| B | 44123 | 37682 | 0 | 0 | 0.00% | 0.00% |  |
| C | 44123 | 37711 | 0 | 0 | 0.00% | 0.00% | 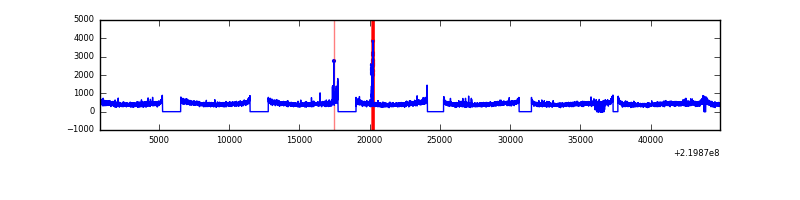 |
| D | 44123 | 37626 | 0 | 0 | 0.00% | 0.00% | 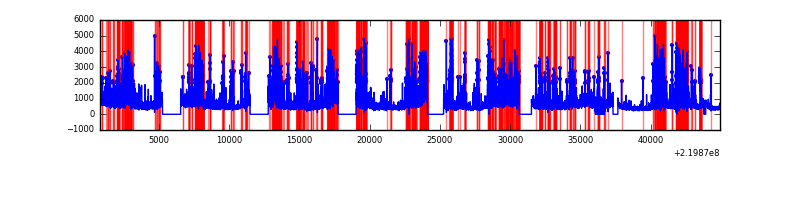 |
Top three noisy pixels from each quadrant. If the there are fewer than three noisy pixels in the level2.evt file, extra rows are filled as -1
| Pixel properties | Quadrant properties | ||||||
|---|---|---|---|---|---|---|---|
| Quadrant | DetID | PixID | Counts | Sigma | Mean | Median | Sigma |
| A | 0 | 29 | 2132 | 11.84 | 532 | 499 | 137.9 |
| A | 7 | 110 | 1765 | 9.18 | 532 | 499 | 137.9 |
| A | 0 | 30 | 1608 | 8.04 | 532 | 499 | 137.9 |
| B | 2 | 9 | 1768 | 11.98 | 524 | 500 | 105.9 |
| B | 5 | 128 | 1381 | 8.32 | 524 | 500 | 105.9 |
| B | 12 | 226 | 1369 | 8.21 | 524 | 500 | 105.9 |
| C | 1 | 80 | 1451 | 6.67 | 538 | 503 | 142.2 |
| C | 1 | 81 | 1443 | 6.61 | 538 | 503 | 142.2 |
| C | 3 | 158 | 1405 | 6.35 | 538 | 503 | 142.2 |
| D | 3 | 14 | 1281 | 6.79 | 472 | 431 | 125.2 |
| D | 11 | 82 | 1268 | 6.69 | 472 | 431 | 125.2 |
| D | 6 | 231 | 1208 | 6.21 | 472 | 431 | 125.2 |
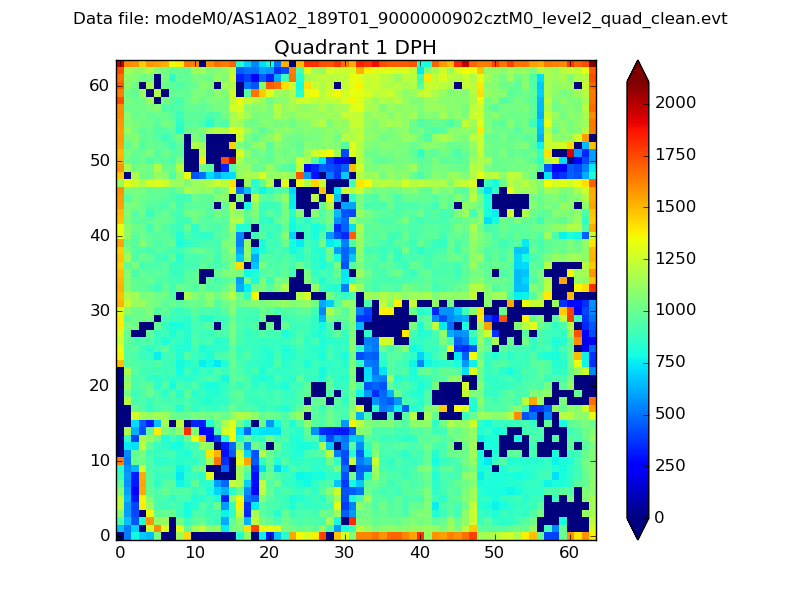
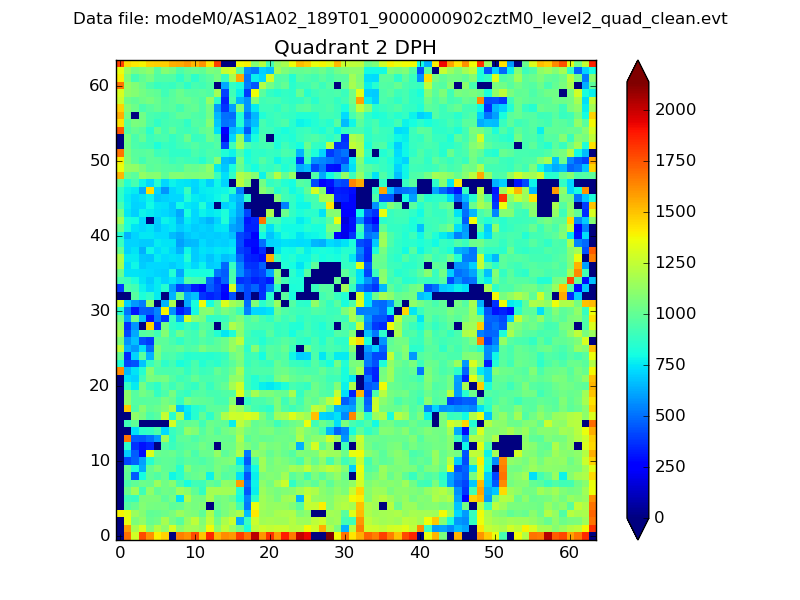
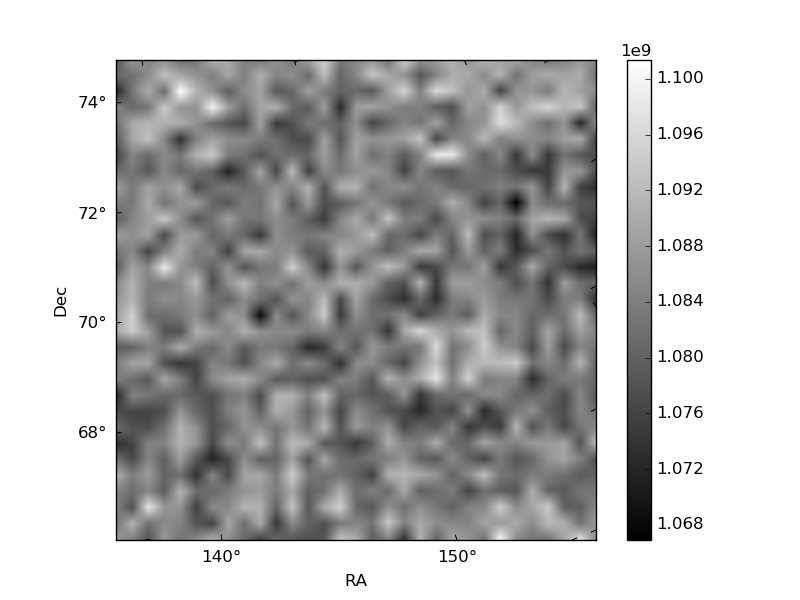
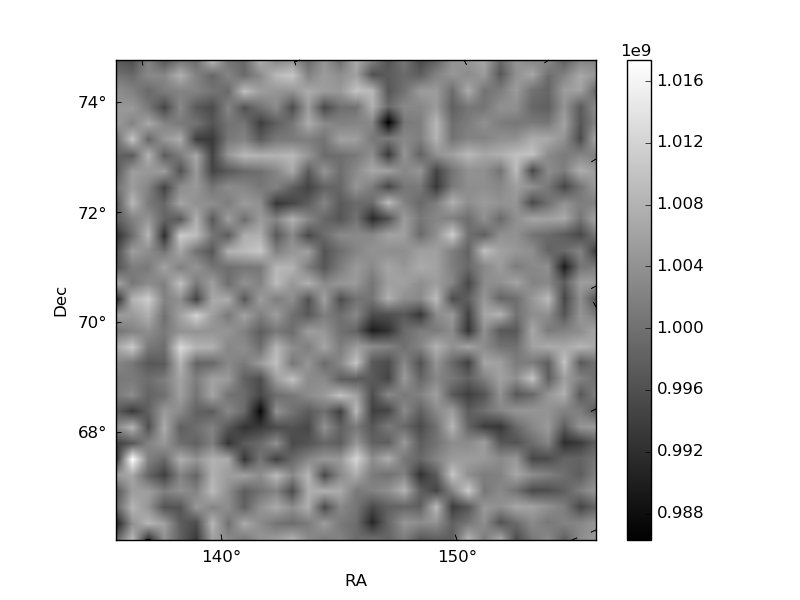
Histogram calculated using DETX and DETY for each event in the final _common_clean file
| Quadrant A |  |
 |
Quadrant B |
|---|---|---|---|
| Quadrant D |  |
 |
Quadrant C |
| Plot type | Count rate plots | Images |
|---|---|---|
| Comparison with Poisson distribution Blue bars denote a histogram of data divided into 1 sec bins. Red curve is a Poisson curve with rate = median count rate of data. |
 |
 |
| Quadrant-wise count rates Data is divided into 100 sec bins |
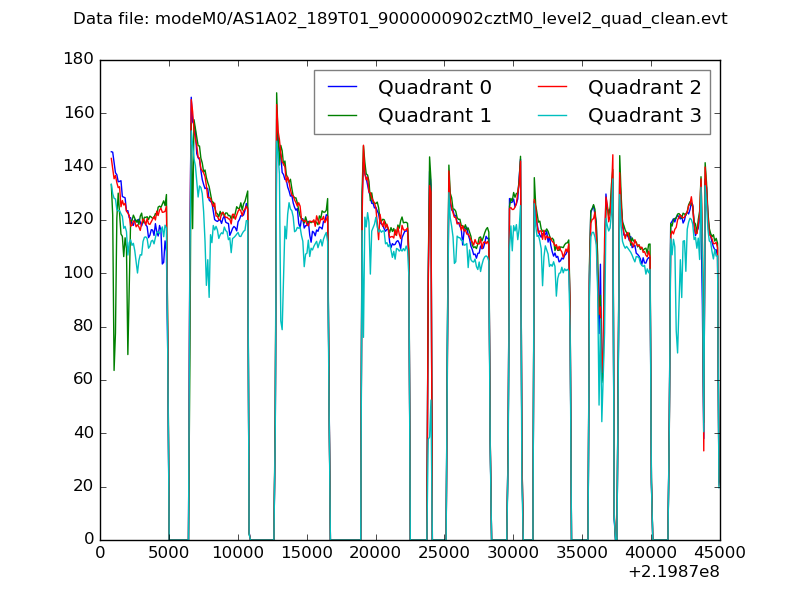 |
|
| Module-wise count rates for Quadrant A Data is divided into 100 sec bins |
 |
 |
| Module-wise count rates for Quadrant B Data is divided into 100 sec bins |
 |
 |
| Module-wise count rates for Quadrant C Data is divided into 100 sec bins |
 |
 |
| Module-wise count rates for Quadrant D Data is divided into 100 sec bins |
 |
 |
| Parameter | Plot |
|---|---|
| CZT HV Monitor |  |
| D_VDD | 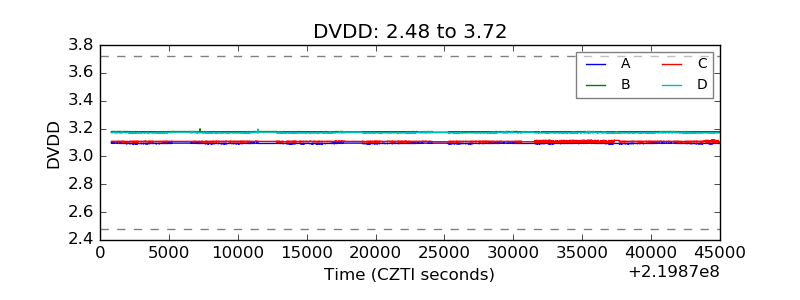 |
| Temperature 1 |  |
| Veto HV Monitor | 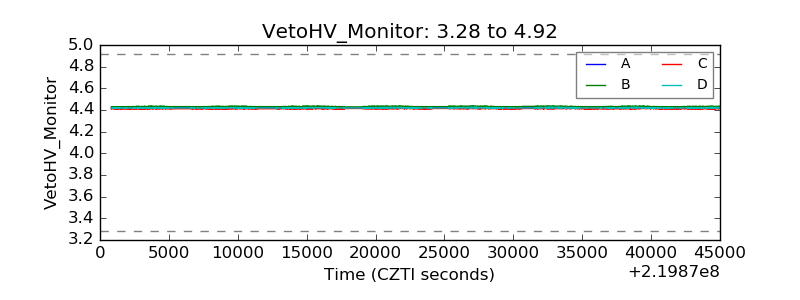 |
| Veto LLD |  |
| Alpha Counter |  |
| _CPM_Rate |  |
| CZT Counter |  |
| +2.5 Volts monitor |  |
| +5 Volts monitor |  |
| _ROLL_ROT |  |
| _Roll_DEC |  |
| _Roll_RA |  |
| Veto Counter |  |