| Param | Original file | Final file |
|---|---|---|
| Filename | modeM0/AS1A02_189T01_9000000902_06641cztM0_level2.evt | modeM0/AS1A02_189T01_9000000902_06641cztM0_level2_quad_clean.evt |
| Size (bytes) | 94,999,680 | 15,621,120 |
| Size | 90.6 MB | 14.9 MB |
| Events in quadrant A | 441,368 | 111,130 |
| Events in quadrant B | 1,252,475 | 88,545 |
| Events in quadrant C | 386,516 | 108,034 |
| Events in quadrant D | 739,509 | 101,450 |
| Mode M0 | |||
|---|---|---|---|
| Quadrant | BADHDUFLAG | Total packets | Discarded packets |
| A | 0 | 1776 | 1 |
| B | 0 | 4276 | 0 |
| C | 0 | 1615 | 0 |
| D | 0 | 2761 | 0 |
| Mode SS | |||
|---|---|---|---|
| Quadrant | BADHDUFLAG | Total packets | Discarded packets |
| A | 0 | 16 | 0 |
| B | 0 | 16 | 0 |
| C | 0 | 16 | 0 |
| D | 0 | 16 | 0 |
| Quadrant | Total seconds | Saturated seconds | Saturation percentage |
|---|---|---|---|
| A | 800 | 5 | 0.625000% |
| B | 800 | 335 | 41.875000% |
| C | 800 | 0 | 0.000000% |
| D | 800 | 12 | 1.500000% |
Noise dominated data is calculated using 1-second bins in cleaned event files. If a bin has >2000 counts, and if more than 50% of those come from <1% of pixels, then it is considered to be noise-dominated and hence unusable.
| Quadrant | # 1 sec bins | Bins with >0 counts | Bins with >2000 counts | High rate bins dominated by noise | Noise dominated (total time) | Noise dominated (detector-on time) | Marked lightcurve |
|---|---|---|---|---|---|---|---|
| A | 800 | 800 | 5 | 5 | 0.62% | 0.62% |  |
| B | 800 | 800 | 250 | 250 | 31.25% | 31.25% | 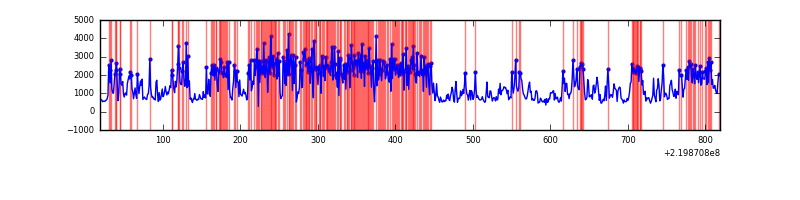 |
| C | 800 | 800 | 0 | 0 | 0.00% | 0.00% | 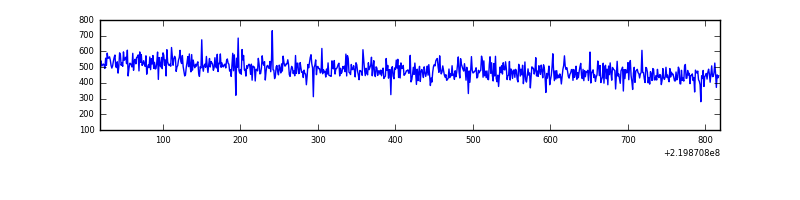 |
| D | 800 | 800 | 11 | 11 | 1.38% | 1.38% |  |
Top three noisy pixels from each quadrant. If the there are fewer than three noisy pixels in the level2.evt file, extra rows are filled as -1
| Pixel properties | Quadrant properties | ||||||
|---|---|---|---|---|---|---|---|
| Quadrant | DetID | PixID | Counts | Sigma | Mean | Median | Sigma |
| A | 8 | 15 | 42223 | 1907.41 | 99 | 96 | 22.1 |
| A | 13 | 248 | 9753 | 437.25 | 99 | 96 | 22.1 |
| A | 15 | 239 | 4151 | 183.6 | 99 | 96 | 22.1 |
| B | 0 | 228 | 895333 | 49878.23 | 84 | 82 | 17.9 |
| B | 4 | 170 | 18379 | 1019.4 | 84 | 82 | 17.9 |
| B | 4 | 81 | 3075 | 166.75 | 84 | 82 | 17.9 |
| C | 13 | 61 | 780 | 27.95 | 98 | 99 | 24.4 |
| C | 3 | 202 | 249 | 6.16 | 98 | 99 | 24.4 |
| C | 7 | 226 | 222 | 5.05 | 98 | 99 | 24.4 |
| D | 8 | 195 | 298141 | 11469.55 | 97 | 94 | 26.0 |
| D | 2 | 136 | 21546 | 825.52 | 97 | 94 | 26.0 |
| D | 12 | 221 | 13936 | 532.67 | 97 | 94 | 26.0 |
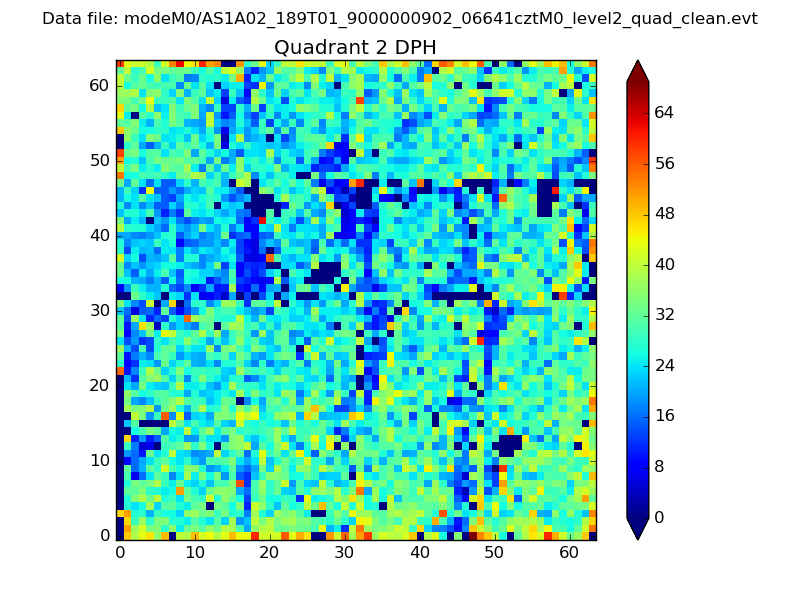
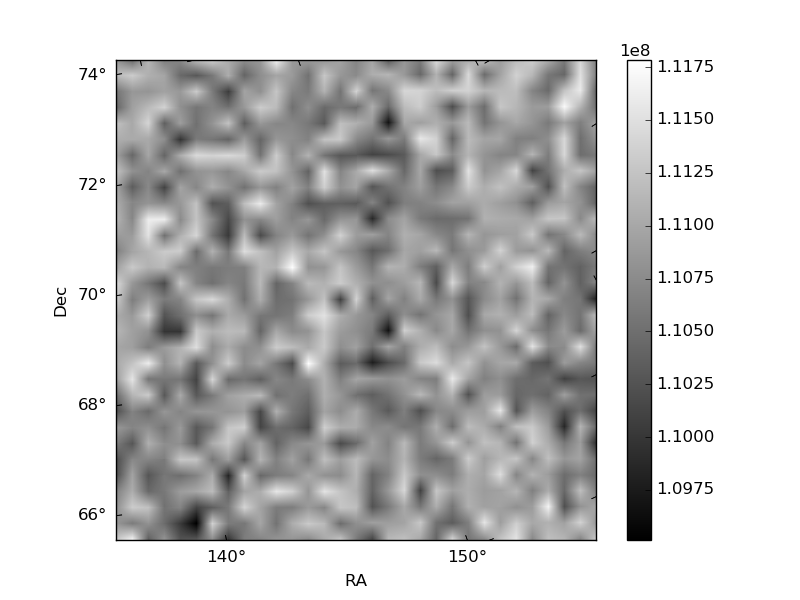
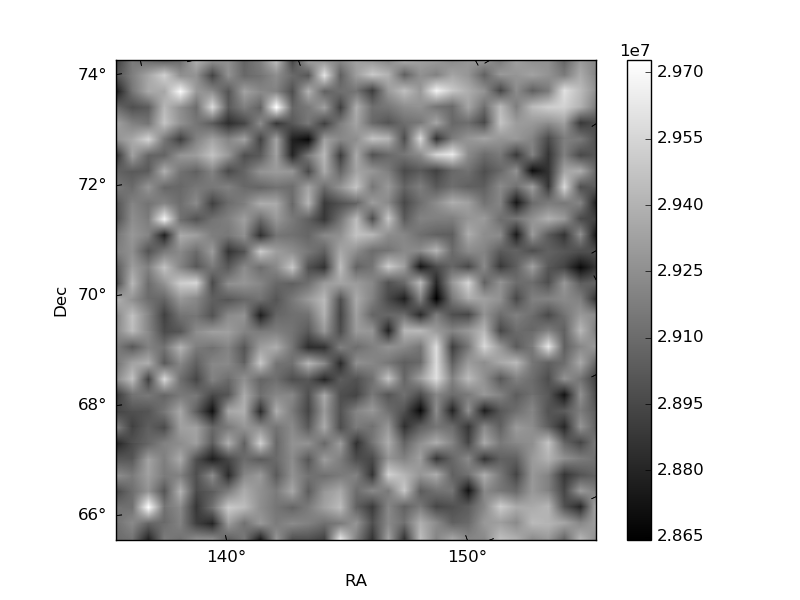
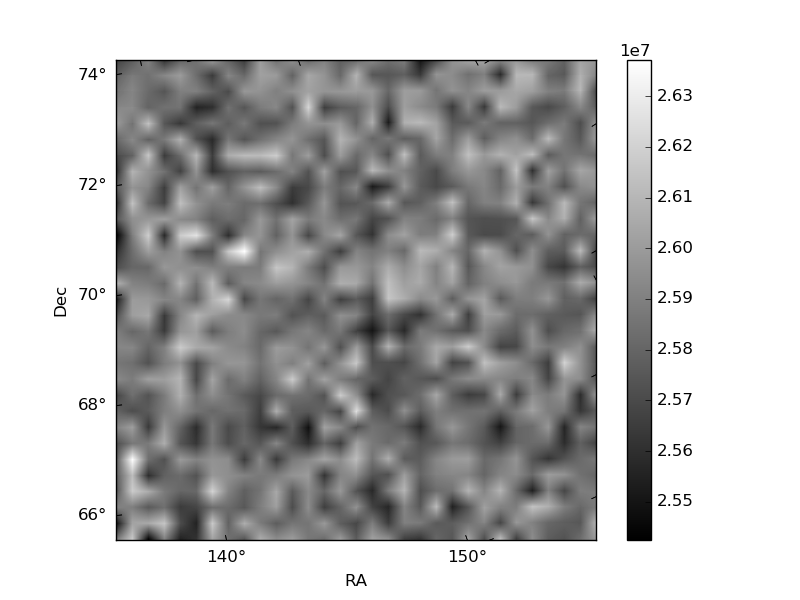
Histogram calculated using DETX and DETY for each event in the final _common_clean file
| Quadrant A |  |
 |
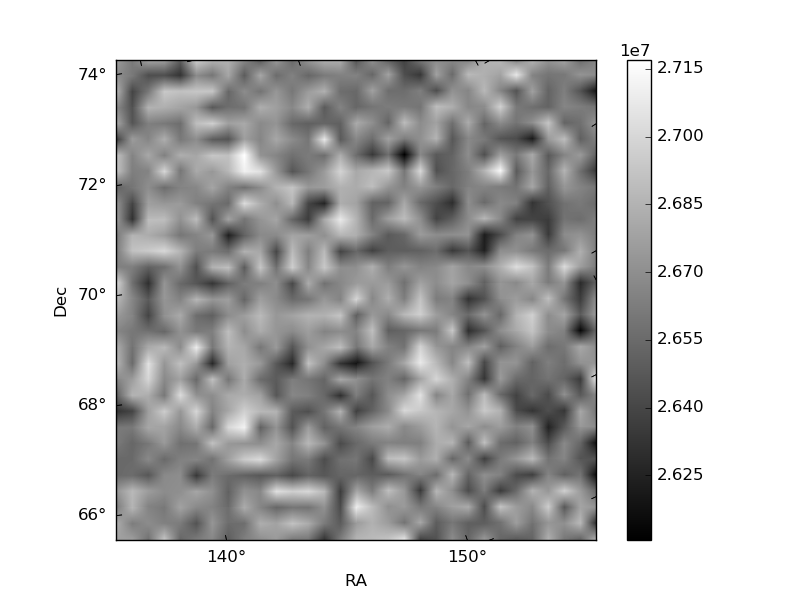
Quadrant B |
|---|---|---|---|
| Quadrant D | 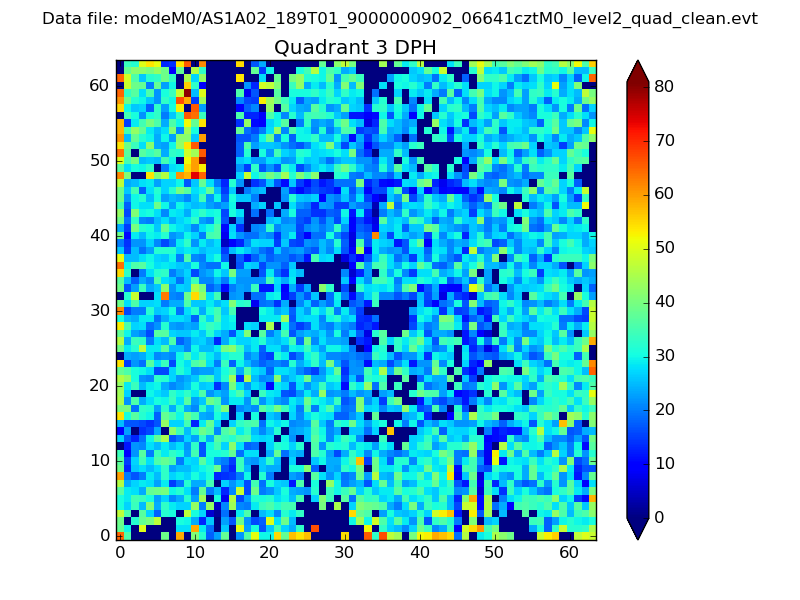 |
 |
Quadrant C |
| Plot type | Count rate plots | Images |
|---|---|---|
| Comparison with Poisson distribution Blue bars denote a histogram of data divided into 1 sec bins. Red curve is a Poisson curve with rate = median count rate of data. |
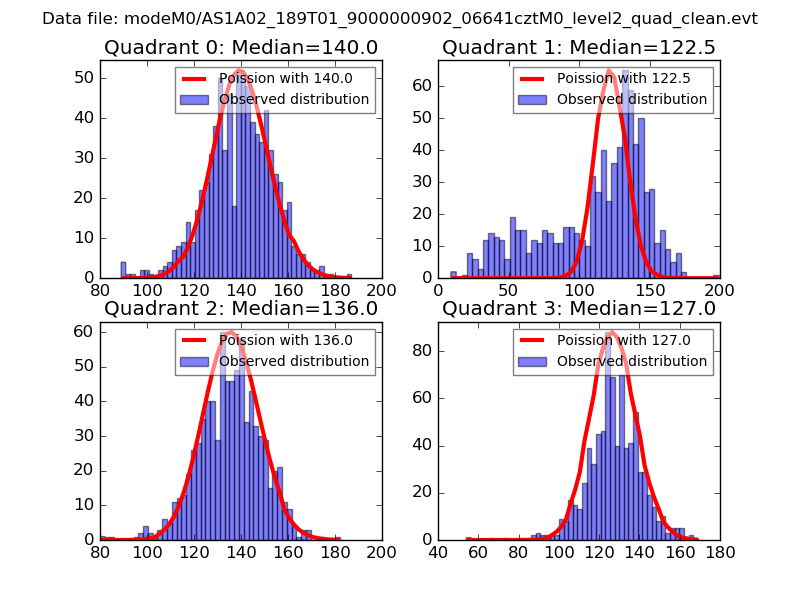 |
 |
| Quadrant-wise count rates Data is divided into 100 sec bins |
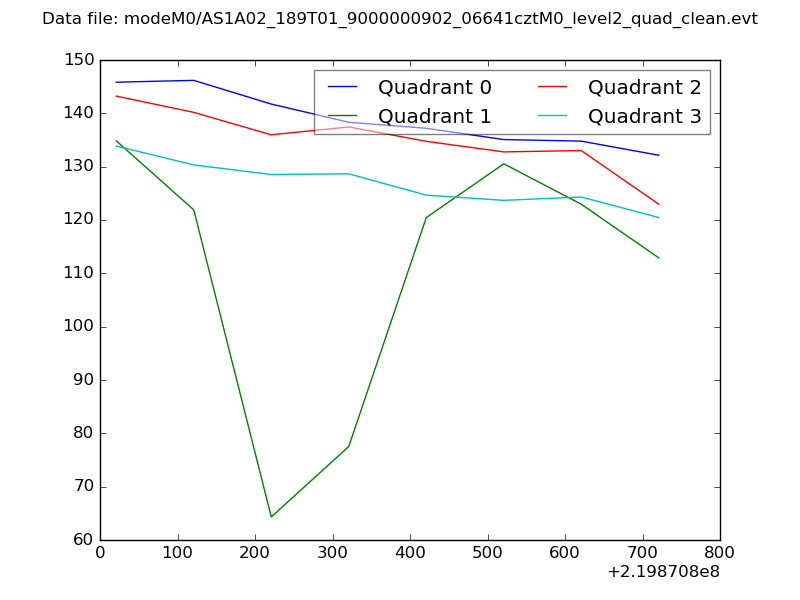 |
|
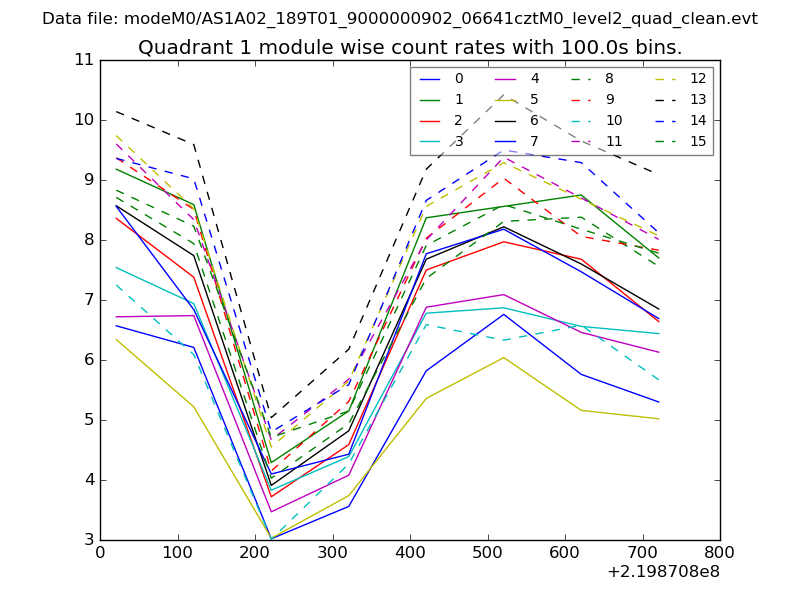
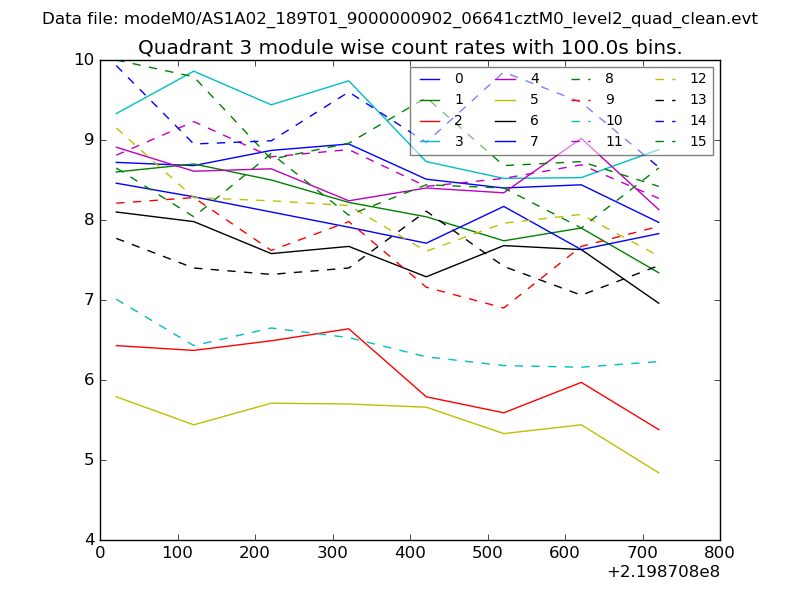
| Module-wise count rates for Quadrant A Data is divided into 100 sec bins |
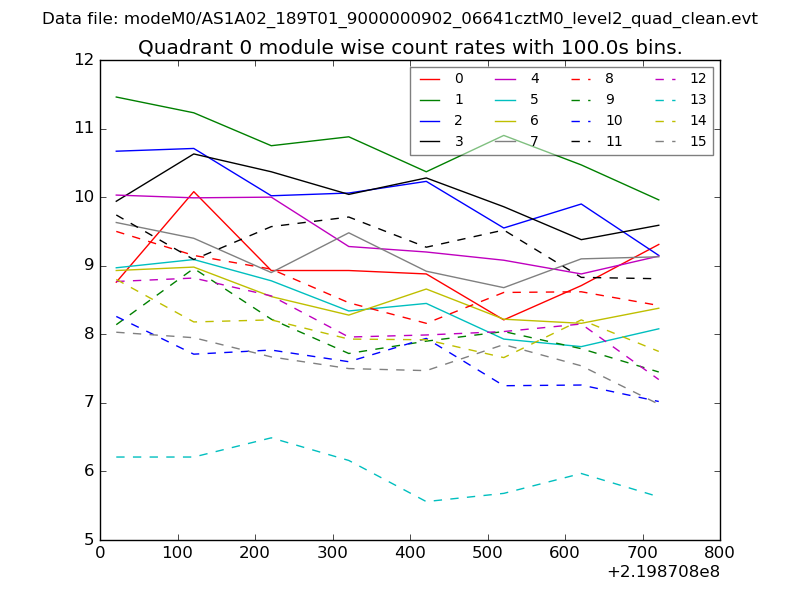 |
 |
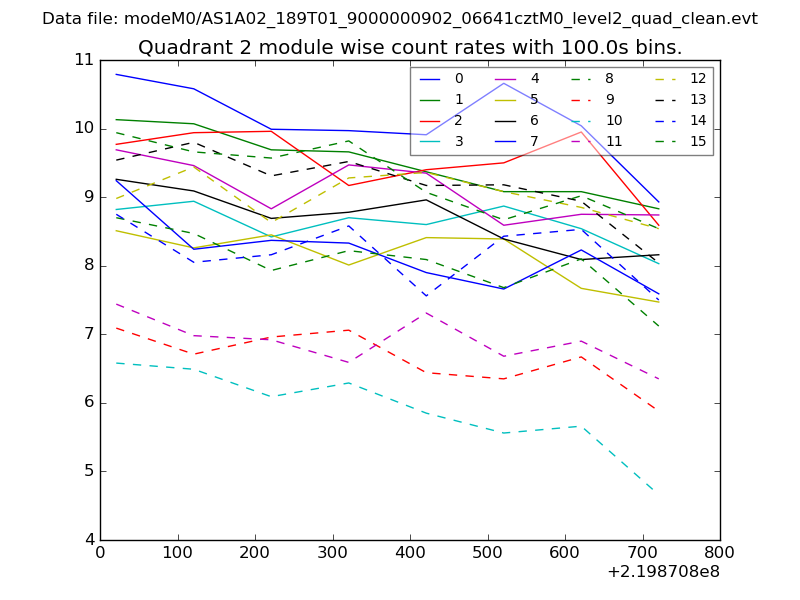
| Module-wise count rates for Quadrant B Data is divided into 100 sec bins |
 |
 |
| Module-wise count rates for Quadrant C Data is divided into 100 sec bins |
 |
 |
| Module-wise count rates for Quadrant D Data is divided into 100 sec bins |
 |
 |
| Parameter | Plot |
|---|---|
| CZT HV Monitor | 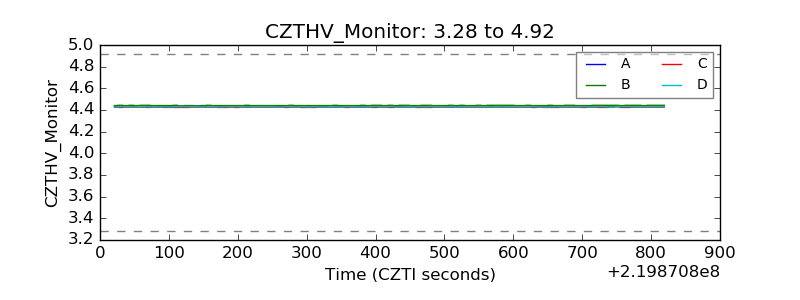 |
| D_VDD | 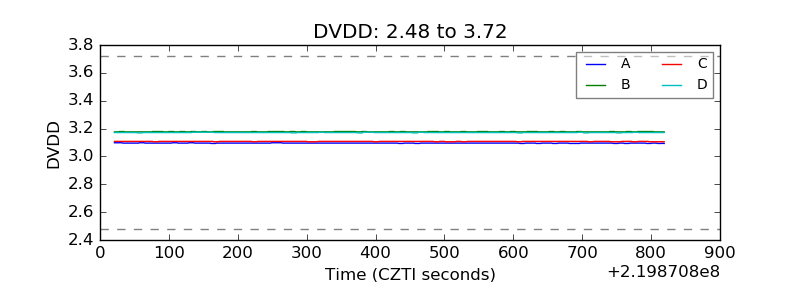 |
| Temperature 1 | 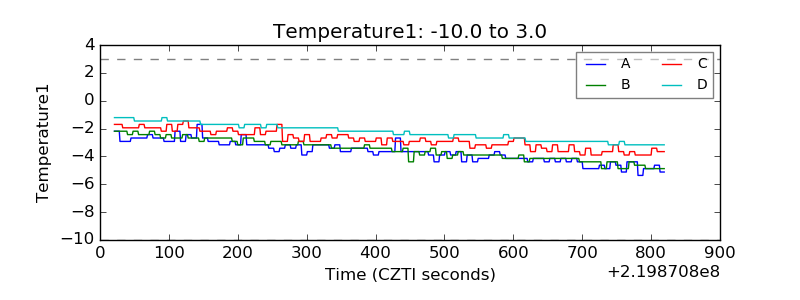 |
| Veto HV Monitor | 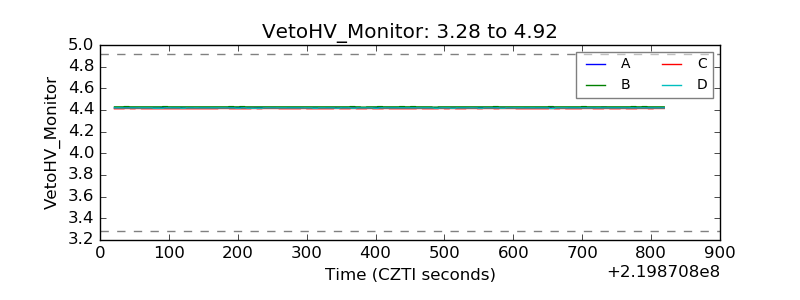 |
| Veto LLD | 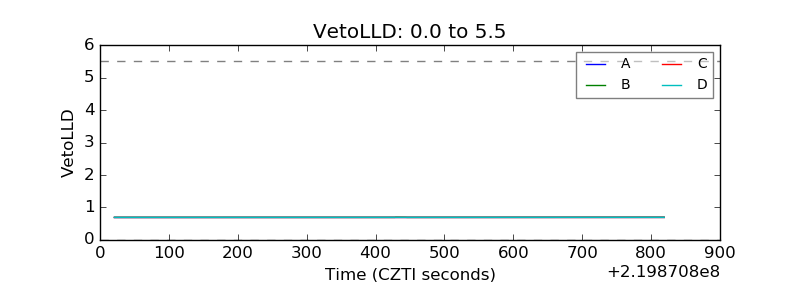 |
| Alpha Counter | 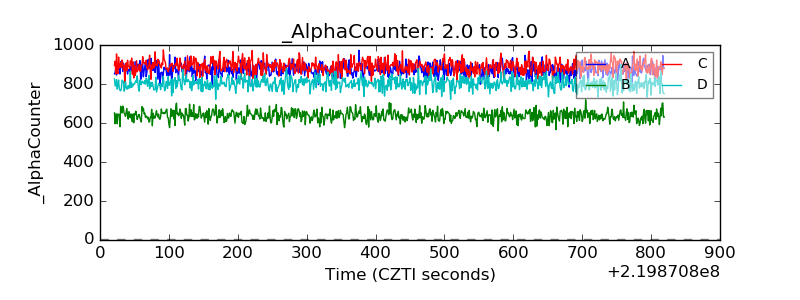 |
| _CPM_Rate | 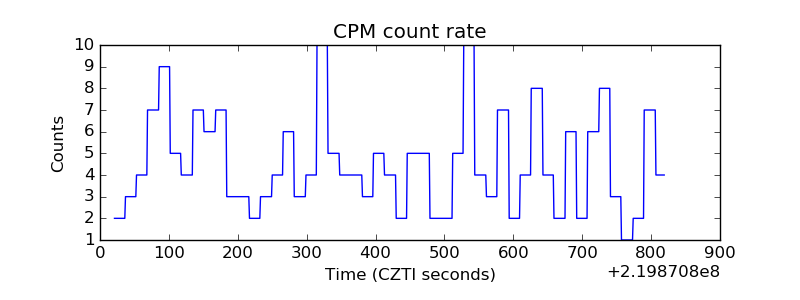 |
| CZT Counter | 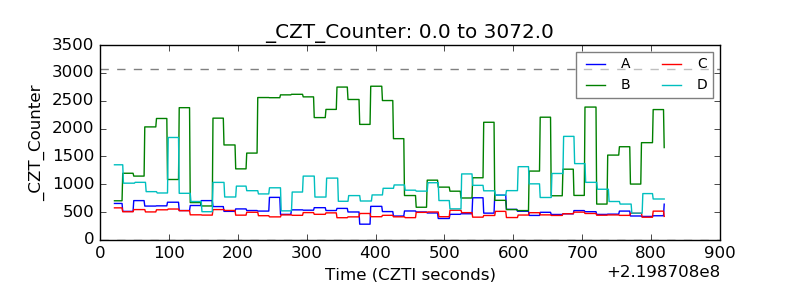 |
| +2.5 Volts monitor | 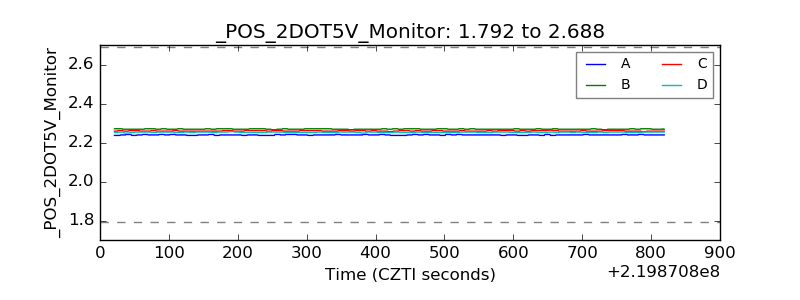 |
| +5 Volts monitor |  |
| _ROLL_ROT | 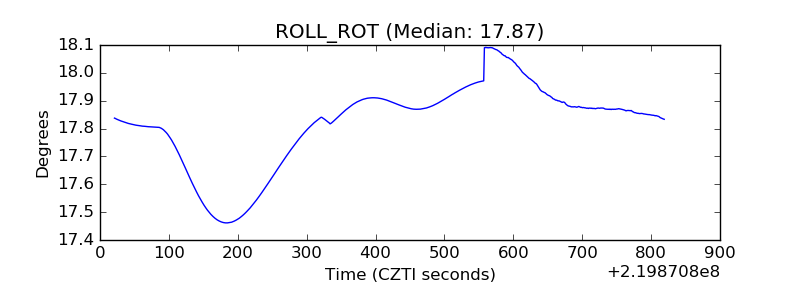 |
| _Roll_DEC | 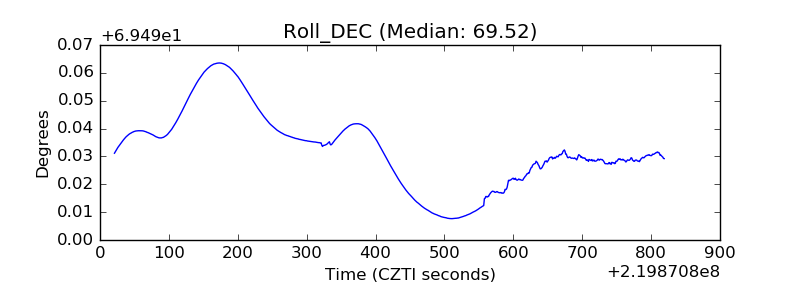 |
| _Roll_RA | 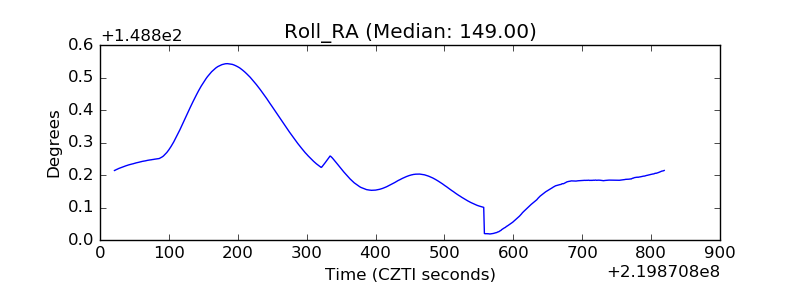 |
| Veto Counter | 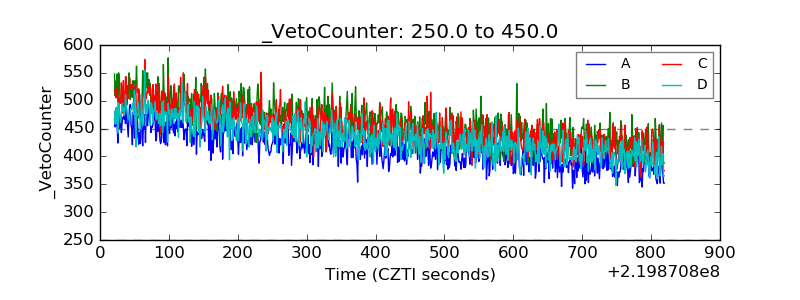 |