| Param | Original file | Final file |
|---|---|---|
| Filename | modeM0/AS1A02_189T01_9000000902_06642cztM0_level2.evt | modeM0/AS1A02_189T01_9000000902_06642cztM0_level2_quad_clean.evt |
| Size (bytes) | 539,573,760 | 102,605,760 |
| Size | 514.6 MB | 97.9 MB |
| Events in quadrant A | 4,001,431 | 690,964 |
| Events in quadrant B | 4,707,655 | 666,530 |
| Events in quadrant C | 2,543,637 | 701,918 |
| Events in quadrant D | 4,701,894 | 648,848 |
| Mode M9 | |||
|---|---|---|---|
| Quadrant | BADHDUFLAG | Total packets | Discarded packets |
| A | 0 | 13 | 0 |
| B | 0 | 13 | 0 |
| C | 0 | 13 | 0 |
| D | 0 | 13 | 0 |
| Mode M0 | |||
|---|---|---|---|
| Quadrant | BADHDUFLAG | Total packets | Discarded packets |
| A | 0 | 15925 | 2 |
| B | 0 | 17947 | 1 |
| C | 0 | 11665 | 1 |
| D | 0 | 17972 | 1 |
| Mode SS | |||
|---|---|---|---|
| Quadrant | BADHDUFLAG | Total packets | Discarded packets |
| A | 0 | 116 | 0 |
| B | 0 | 116 | 0 |
| C | 0 | 116 | 0 |
| D | 0 | 116 | 0 |
| Quadrant | Total seconds | Saturated seconds | Saturation percentage |
|---|---|---|---|
| A | 5704 | 269 | 4.715989% |
| B | 5704 | 790 | 13.849930% |
| C | 5704 | 23 | 0.403226% |
| D | 5704 | 265 | 4.645863% |
Noise dominated data is calculated using 1-second bins in cleaned event files. If a bin has >2000 counts, and if more than 50% of those come from <1% of pixels, then it is considered to be noise-dominated and hence unusable.
| Quadrant | # 1 sec bins | Bins with >0 counts | Bins with >2000 counts | High rate bins dominated by noise | Noise dominated (total time) | Noise dominated (detector-on time) | Marked lightcurve |
|---|---|---|---|---|---|---|---|
| A | 6999 | 5705 | 157 | 157 | 2.24% | 2.75% | 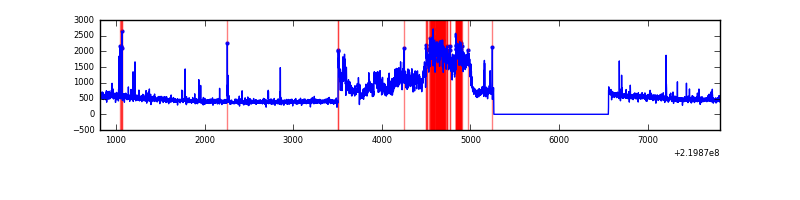 |
| B | 6999 | 5705 | 586 | 586 | 8.37% | 10.27% | 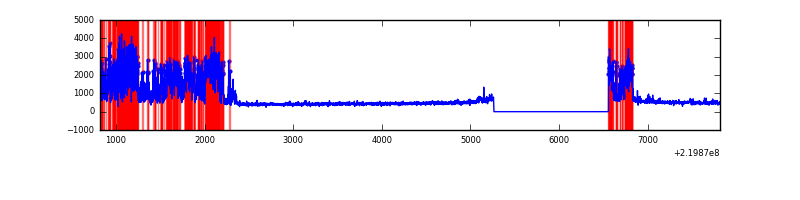 |
| C | 6999 | 5705 | 0 | 0 | 0.00% | 0.00% |  |
| D | 6999 | 5705 | 227 | 227 | 3.24% | 3.98% | 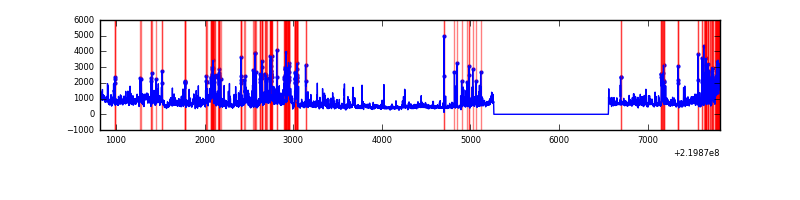 |
Top three noisy pixels from each quadrant. If the there are fewer than three noisy pixels in the level2.evt file, extra rows are filled as -1
| Pixel properties | Quadrant properties | ||||||
|---|---|---|---|---|---|---|---|
| Quadrant | DetID | PixID | Counts | Sigma | Mean | Median | Sigma |
| A | 15 | 239 | 1271026 | 9646.96 | 659 | 647 | 131.7 |
| A | 8 | 15 | 164888 | 1247.21 | 659 | 647 | 131.7 |
| A | 13 | 248 | 14188 | 102.83 | 659 | 647 | 131.7 |
| B | 0 | 228 | 2094529 | 17449.0 | 641 | 625 | 120.0 |
| B | 4 | 170 | 54956 | 452.75 | 641 | 625 | 120.0 |
| B | 0 | 214 | 22516 | 182.42 | 641 | 625 | 120.0 |
| C | 13 | 61 | 5228 | 30.48 | 652 | 655 | 150.0 |
| C | 3 | 202 | 1677 | 6.81 | 652 | 655 | 150.0 |
| C | -1 | -1 | -1 | -1.0 | 652 | 655 | 150.0 |
| D | 8 | 195 | 956963 | 6222.98 | 634 | 615 | 153.7 |
| D | 2 | 33 | 639849 | 4159.51 | 634 | 615 | 153.7 |
| D | 4 | 95 | 277106 | 1799.13 | 634 | 615 | 153.7 |
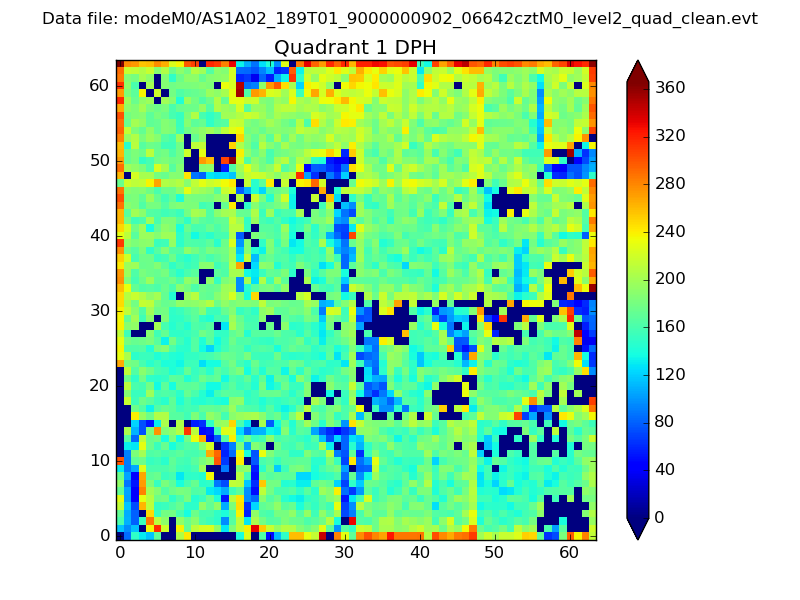
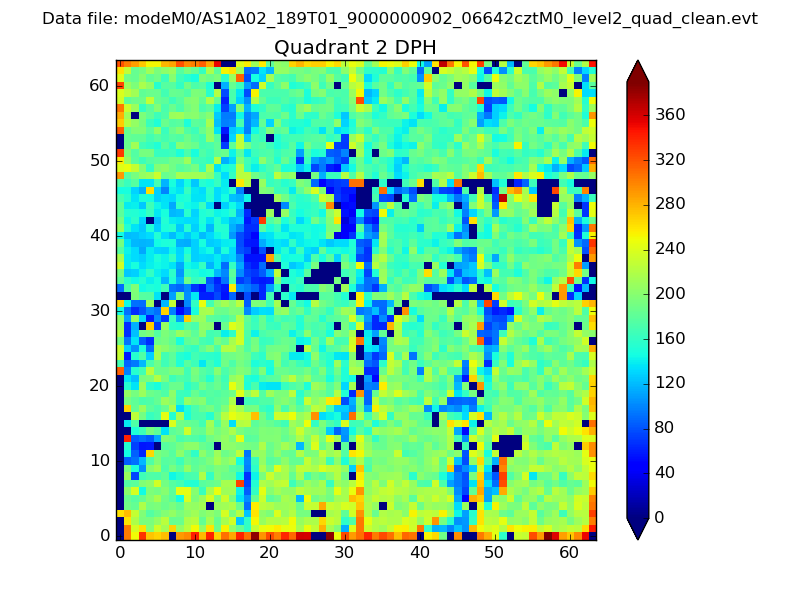
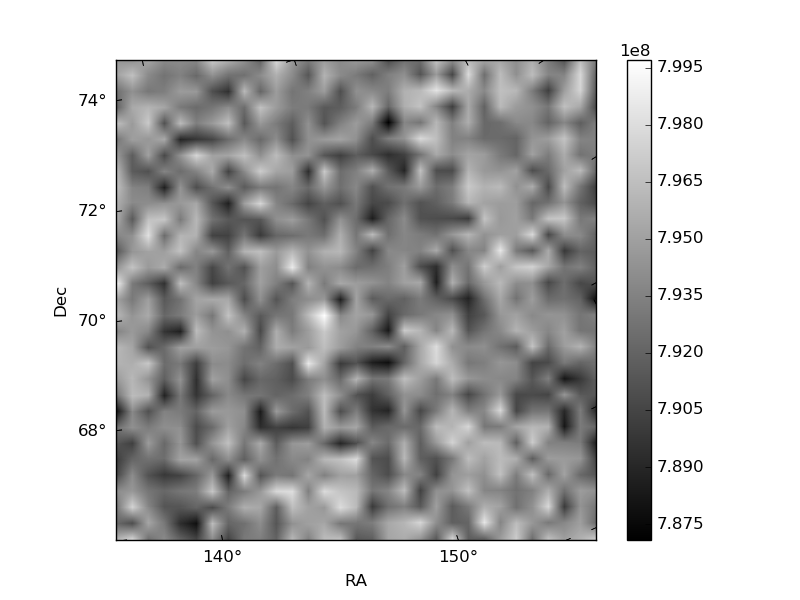
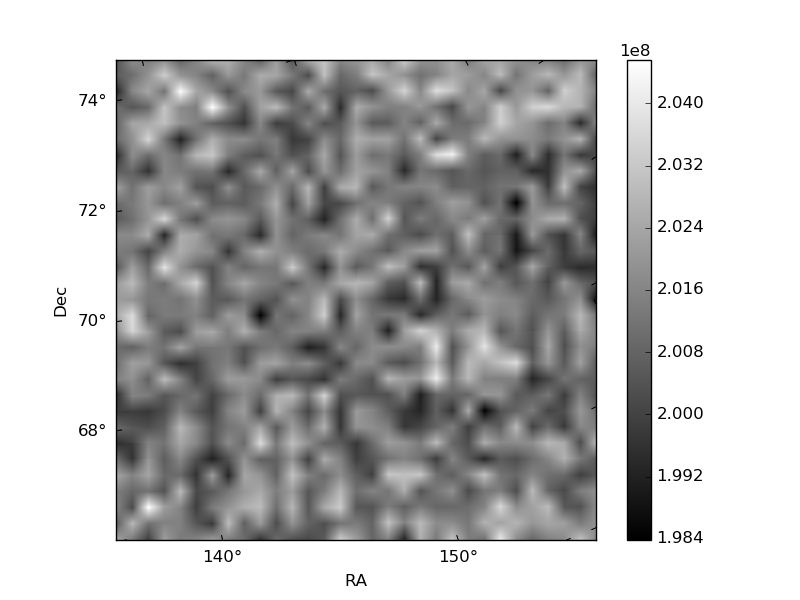
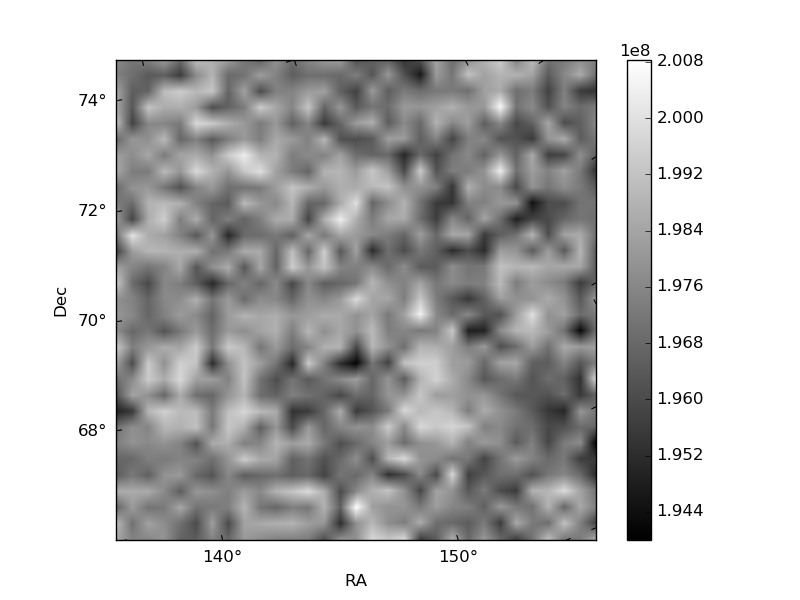
Histogram calculated using DETX and DETY for each event in the final _common_clean file
| Quadrant A | 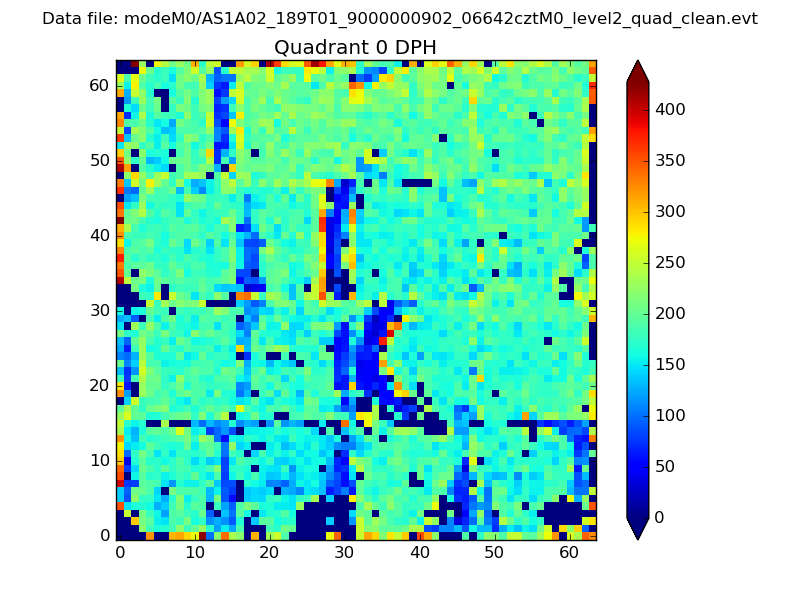 |
 |
Quadrant B |
|---|---|---|---|
| Quadrant D | 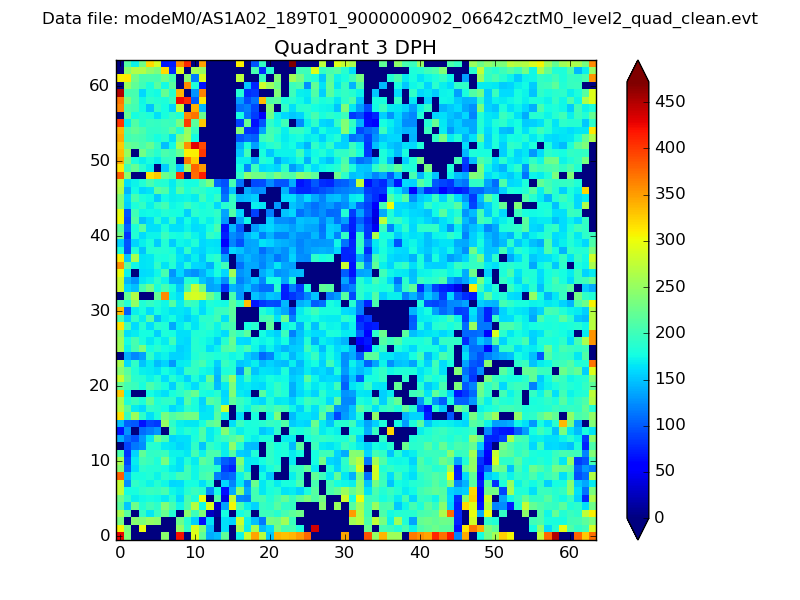 |
 |
Quadrant C |
| Plot type | Count rate plots | Images |
|---|---|---|
| Comparison with Poisson distribution Blue bars denote a histogram of data divided into 1 sec bins. Red curve is a Poisson curve with rate = median count rate of data. |
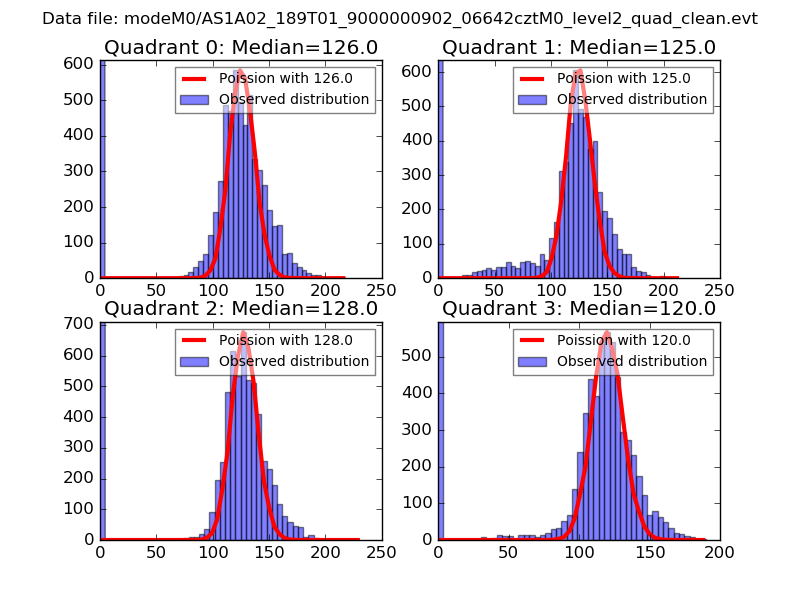 |
 |
| Quadrant-wise count rates Data is divided into 100 sec bins |
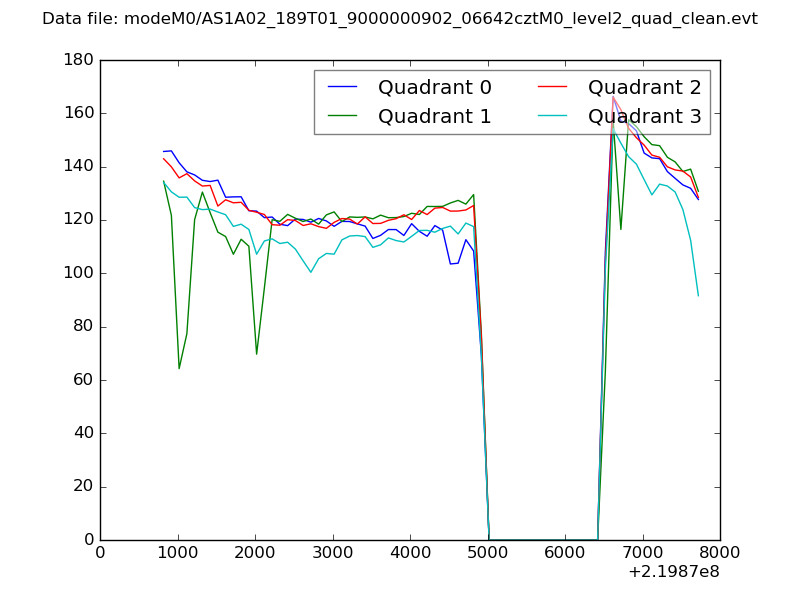 |
|
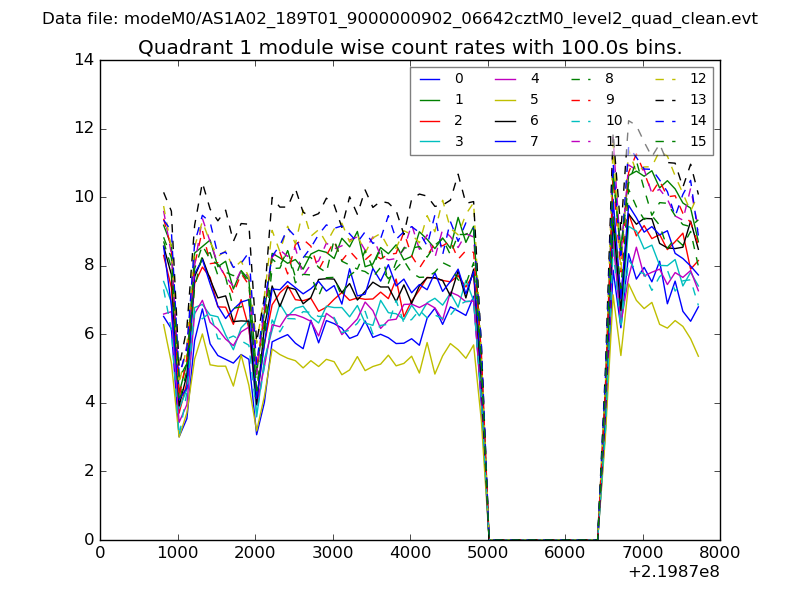
| Module-wise count rates for Quadrant A Data is divided into 100 sec bins |
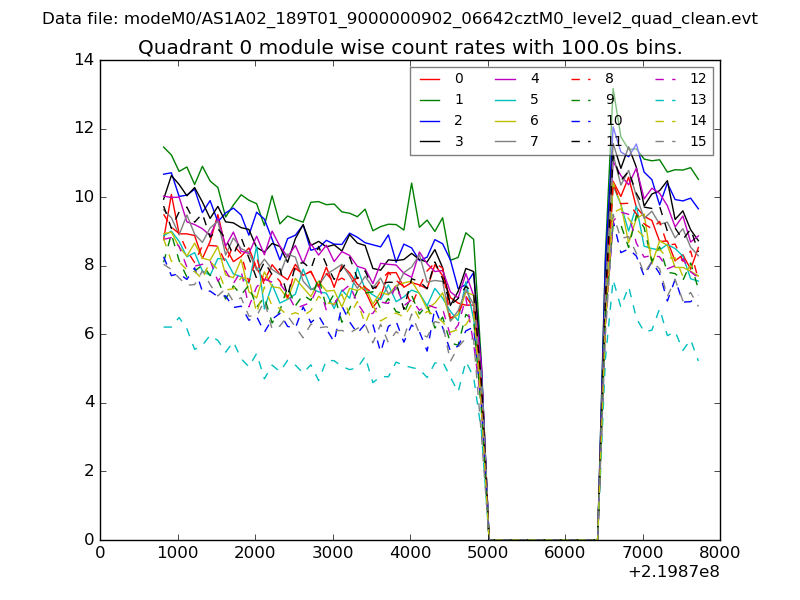 |
 |
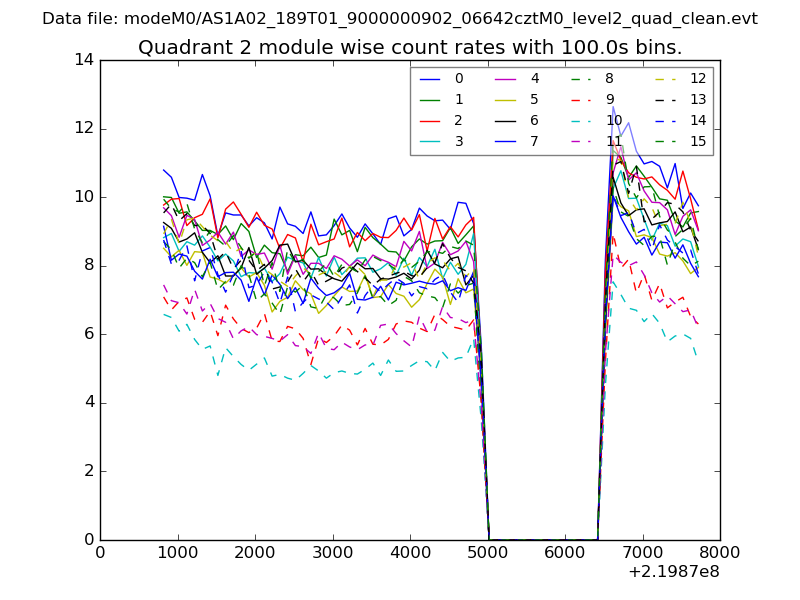
| Module-wise count rates for Quadrant B Data is divided into 100 sec bins |
 |
 |
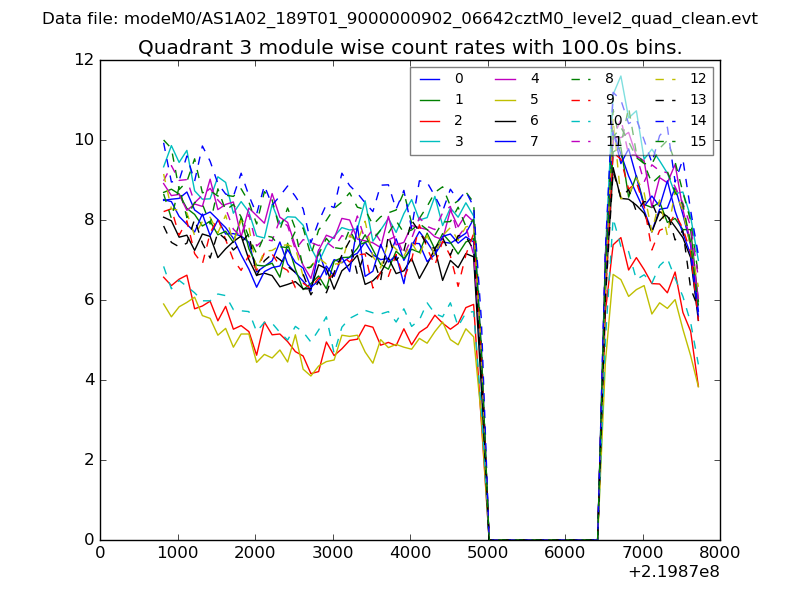
| Module-wise count rates for Quadrant C Data is divided into 100 sec bins |
 |
 |
| Module-wise count rates for Quadrant D Data is divided into 100 sec bins |
 |
 |
| Parameter | Plot |
|---|---|
| CZT HV Monitor | 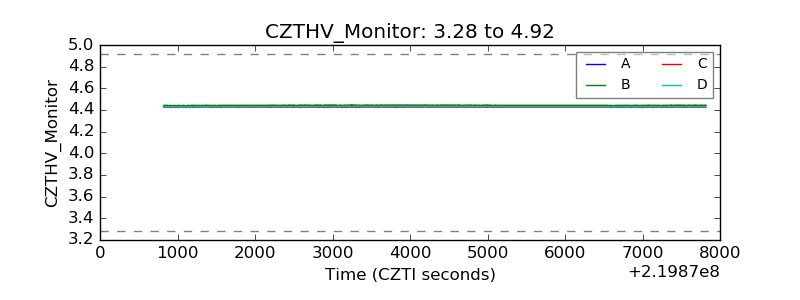 |
| D_VDD | 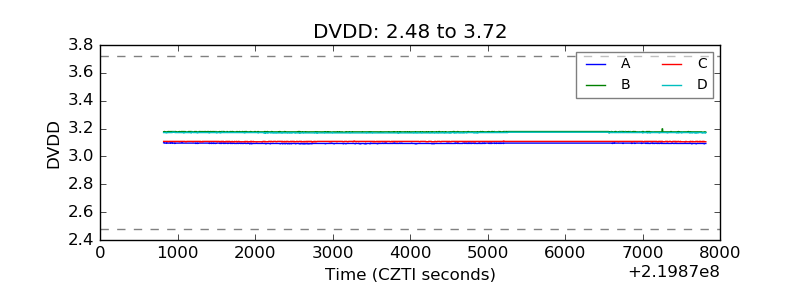 |
| Temperature 1 | 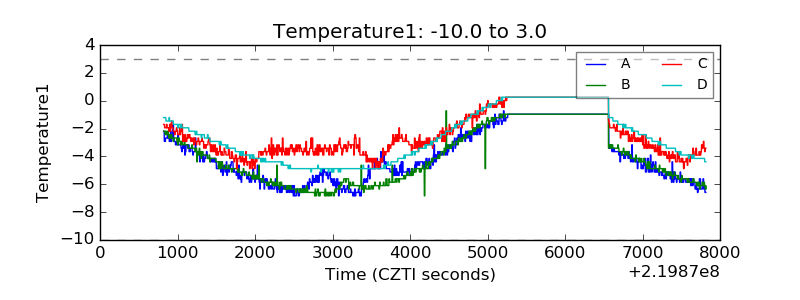 |
| Veto HV Monitor | 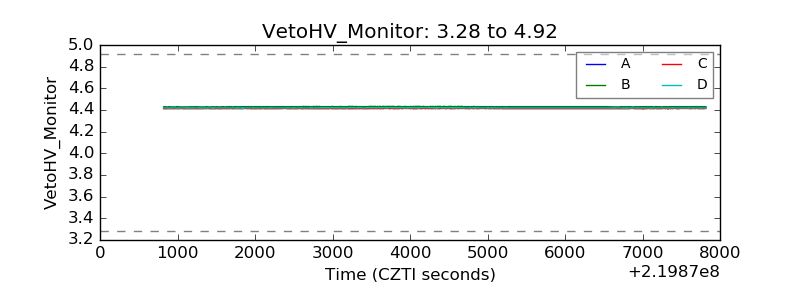 |
| Veto LLD | 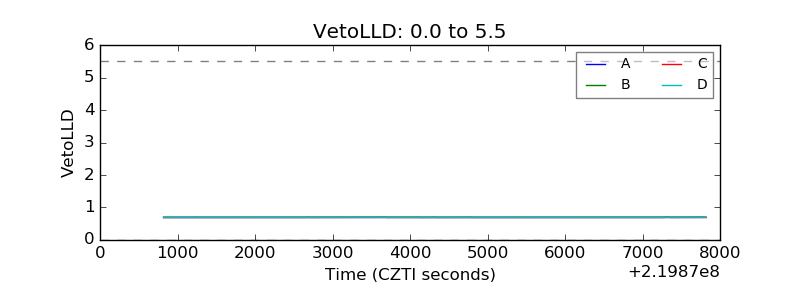 |
| Alpha Counter | 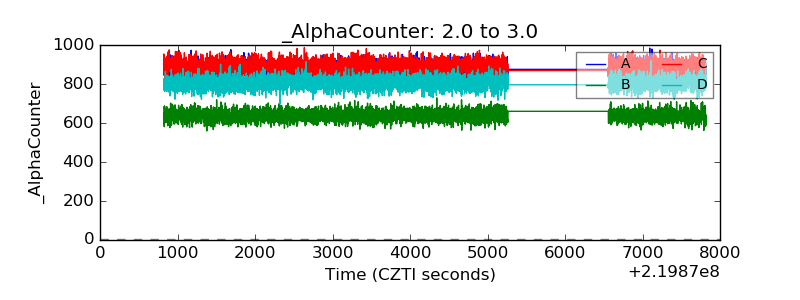 |
| _CPM_Rate | 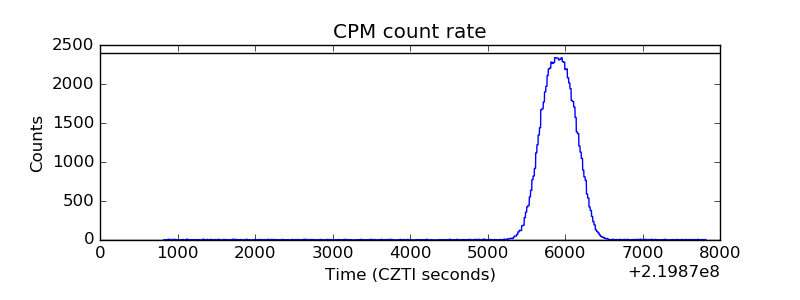 |
| CZT Counter | 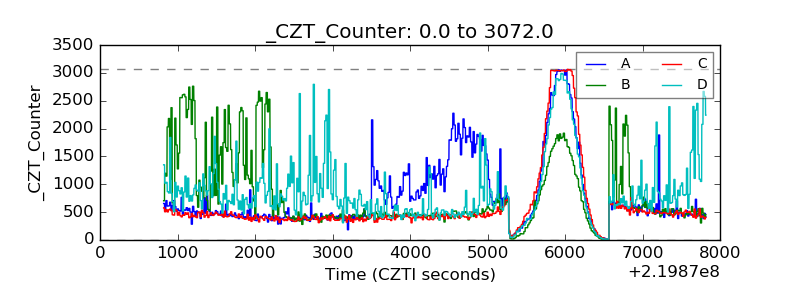 |
| +2.5 Volts monitor |  |
| +5 Volts monitor | 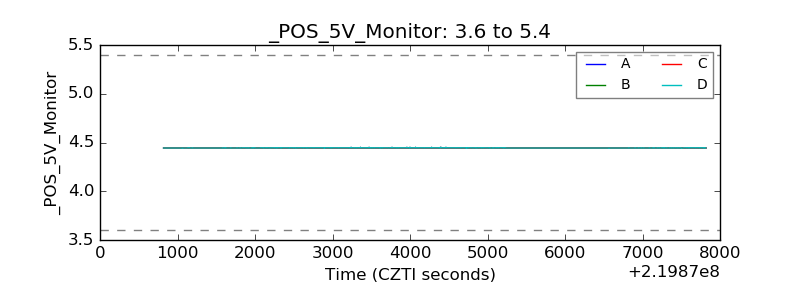 |
| _ROLL_ROT | 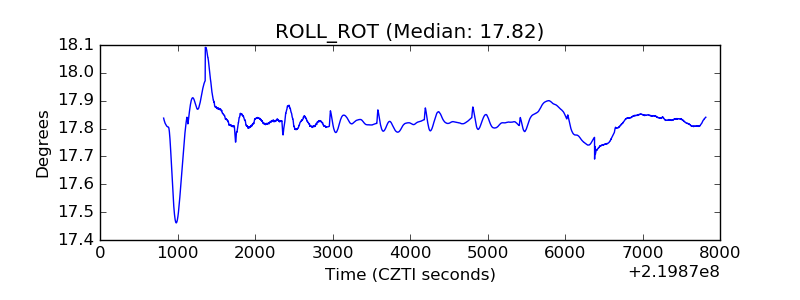 |
| _Roll_DEC | 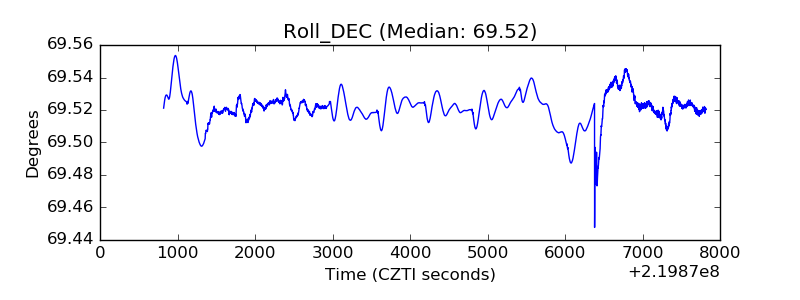 |
| _Roll_RA | 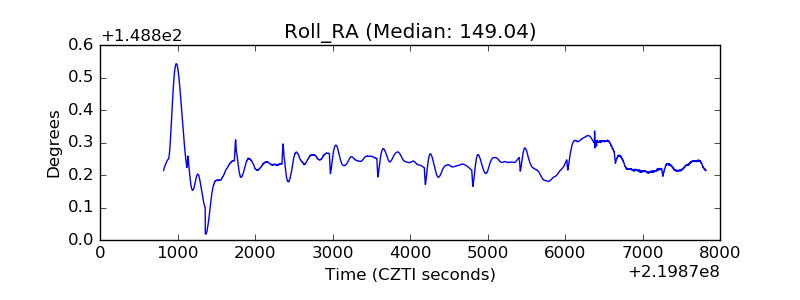 |
| Veto Counter | 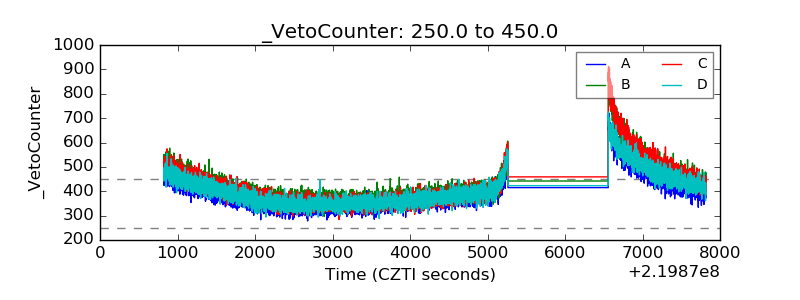 |