| Param | Original file | Final file |
|---|---|---|
| Filename | modeM0/AS1A02_189T01_9000000902_06643cztM0_level2.evt | modeM0/AS1A02_189T01_9000000902_06643cztM0_level2_quad_clean.evt |
| Size (bytes) | 499,864,320 | 106,824,960 |
| Size | 476.7 MB | 101.9 MB |
| Events in quadrant A | 3,164,707 | 711,359 |
| Events in quadrant B | 3,648,209 | 722,819 |
| Events in quadrant C | 2,779,517 | 724,925 |
| Events in quadrant D | 5,131,677 | 649,863 |
| Mode M9 | |||
|---|---|---|---|
| Quadrant | BADHDUFLAG | Total packets | Discarded packets |
| A | 0 | 16 | 0 |
| B | 0 | 16 | 0 |
| C | 0 | 16 | 0 |
| D | 0 | 17 | 0 |
| Mode M0 | |||
|---|---|---|---|
| Quadrant | BADHDUFLAG | Total packets | Discarded packets |
| A | 0 | 13350 | 3 |
| B | 0 | 15022 | 2 |
| C | 0 | 12594 | 2 |
| D | 0 | 19507 | 2 |
| Mode SS | |||
|---|---|---|---|
| Quadrant | BADHDUFLAG | Total packets | Discarded packets |
| A | 0 | 124 | 0 |
| B | 0 | 124 | 0 |
| C | 0 | 124 | 0 |
| D | 0 | 124 | 0 |
| Quadrant | Total seconds | Saturated seconds | Saturation percentage |
|---|---|---|---|
| A | 6104 | 53 | 0.868283% |
| B | 6104 | 327 | 5.357143% |
| C | 6104 | 50 | 0.819135% |
| D | 6104 | 558 | 9.141547% |
Noise dominated data is calculated using 1-second bins in cleaned event files. If a bin has >2000 counts, and if more than 50% of those come from <1% of pixels, then it is considered to be noise-dominated and hence unusable.
| Quadrant | # 1 sec bins | Bins with >0 counts | Bins with >2000 counts | High rate bins dominated by noise | Noise dominated (total time) | Noise dominated (detector-on time) | Marked lightcurve |
|---|---|---|---|---|---|---|---|
| A | 7404 | 6105 | 0 | 0 | 0.00% | 0.00% | 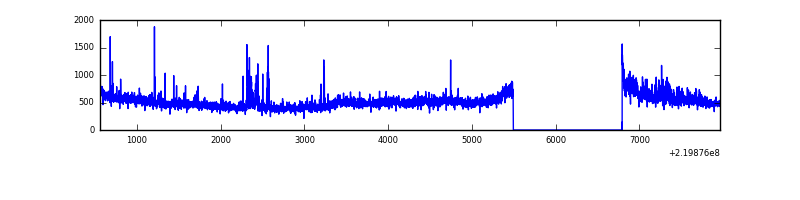 |
| B | 7404 | 6104 | 161 | 161 | 2.17% | 2.64% | 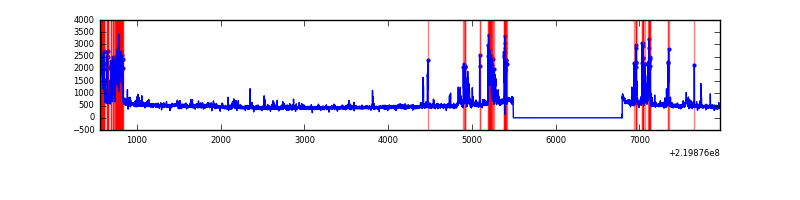 |
| C | 7404 | 6104 | 0 | 0 | 0.00% | 0.00% | 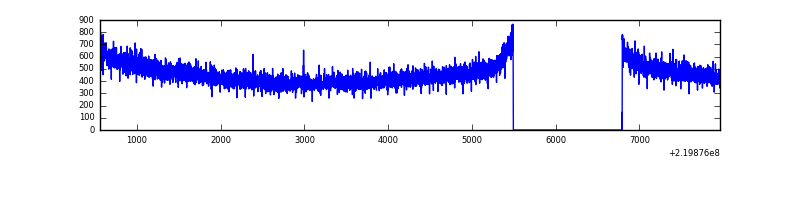 |
| D | 7404 | 6104 | 428 | 428 | 5.78% | 7.01% | 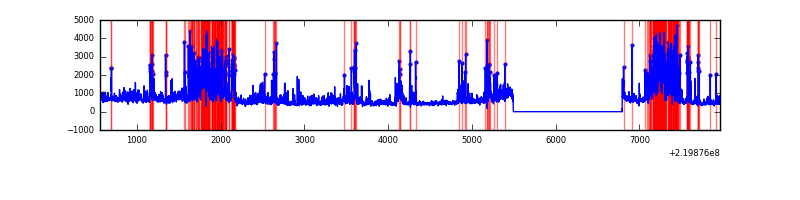 |
Top three noisy pixels from each quadrant. If the there are fewer than three noisy pixels in the level2.evt file, extra rows are filled as -1
| Pixel properties | Quadrant properties | ||||||
|---|---|---|---|---|---|---|---|
| Quadrant | DetID | PixID | Counts | Sigma | Mean | Median | Sigma |
| A | 8 | 15 | 327349 | 2258.37 | 721 | 707 | 144.6 |
| A | 14 | 111 | 40742 | 276.8 | 721 | 707 | 144.6 |
| A | 13 | 248 | 8631 | 54.79 | 721 | 707 | 144.6 |
| B | 0 | 228 | 700984 | 5211.7 | 723 | 706 | 134.4 |
| B | 4 | 170 | 35621 | 259.85 | 723 | 706 | 134.4 |
| B | 4 | 48 | 31503 | 229.2 | 723 | 706 | 134.4 |
| C | 13 | 61 | 5700 | 30.66 | 712 | 714 | 162.6 |
| C | 7 | 159 | 2029 | 8.09 | 712 | 714 | 162.6 |
| C | 3 | 202 | 1875 | 7.14 | 712 | 714 | 162.6 |
| D | 2 | 33 | 1349941 | 8245.1 | 676 | 655 | 163.6 |
| D | 2 | 152 | 541188 | 3303.04 | 676 | 655 | 163.6 |
| D | 8 | 195 | 359576 | 2193.26 | 676 | 655 | 163.6 |
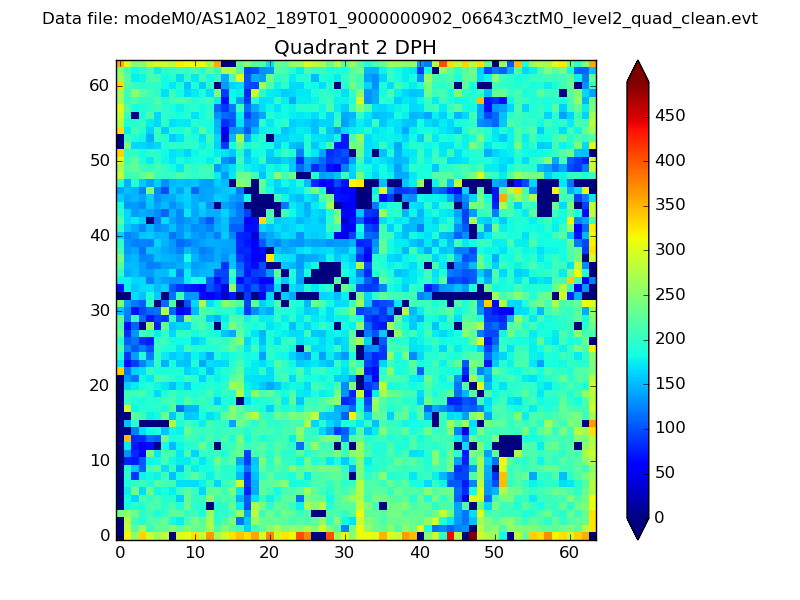
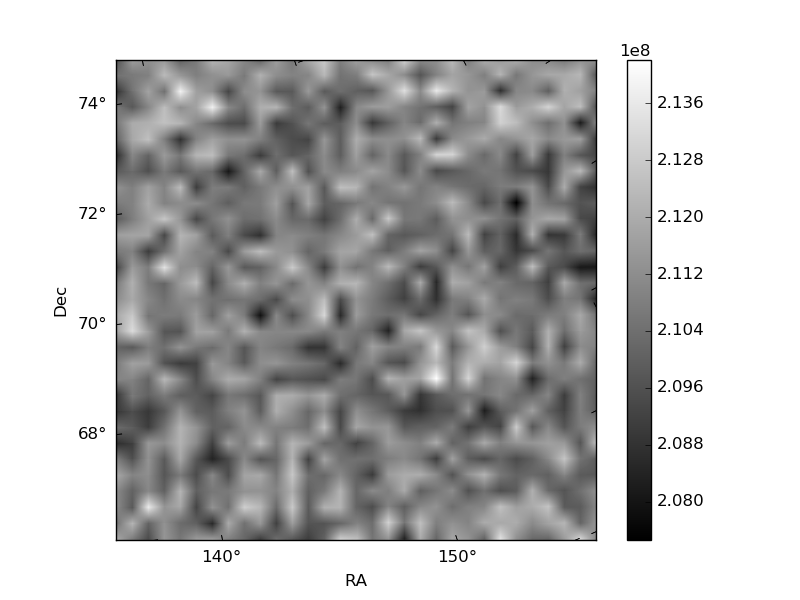
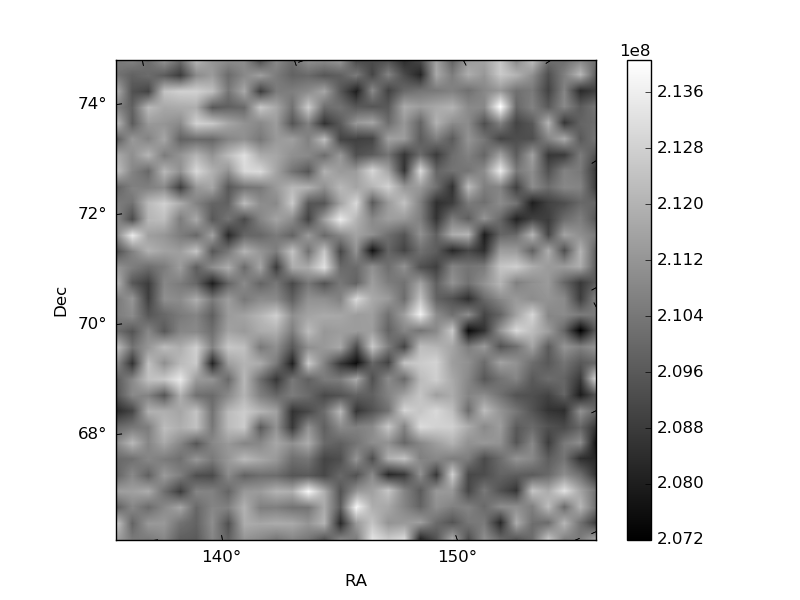
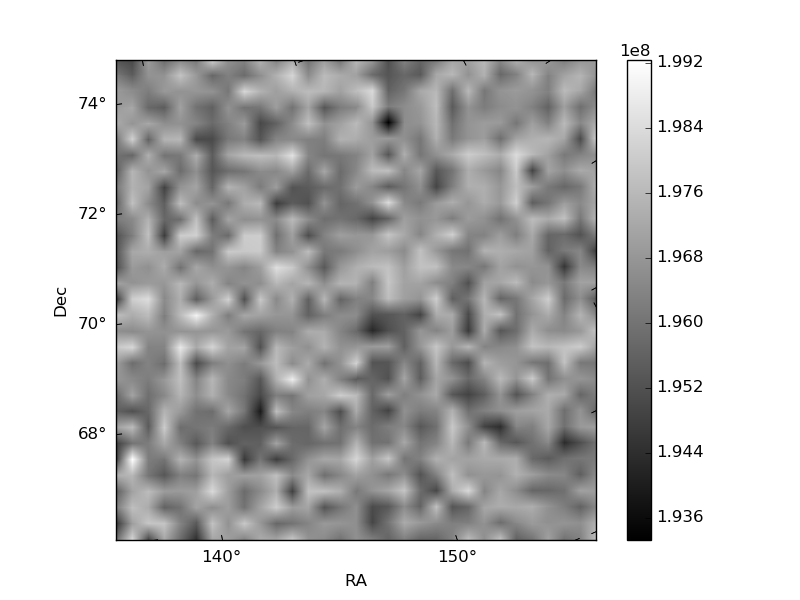
Histogram calculated using DETX and DETY for each event in the final _common_clean file
| Quadrant A | 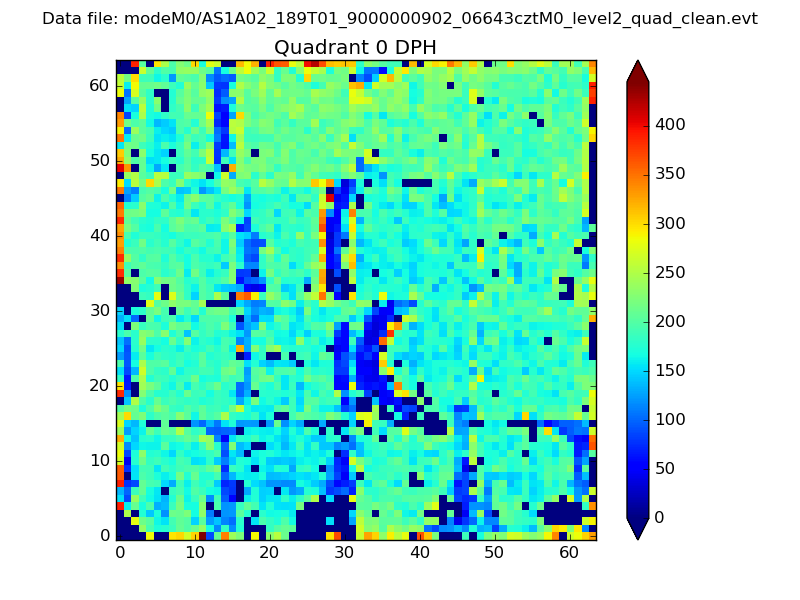 |
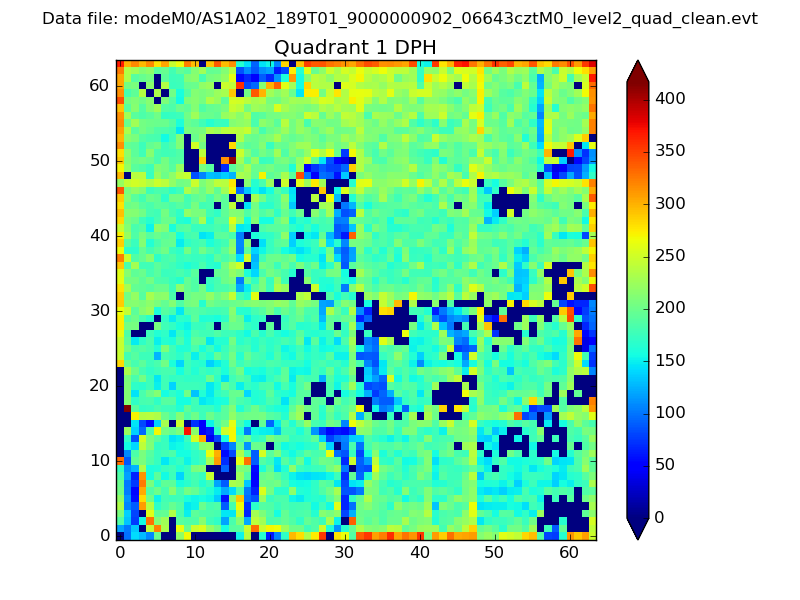 |
Quadrant B |
|---|---|---|---|
| Quadrant D | 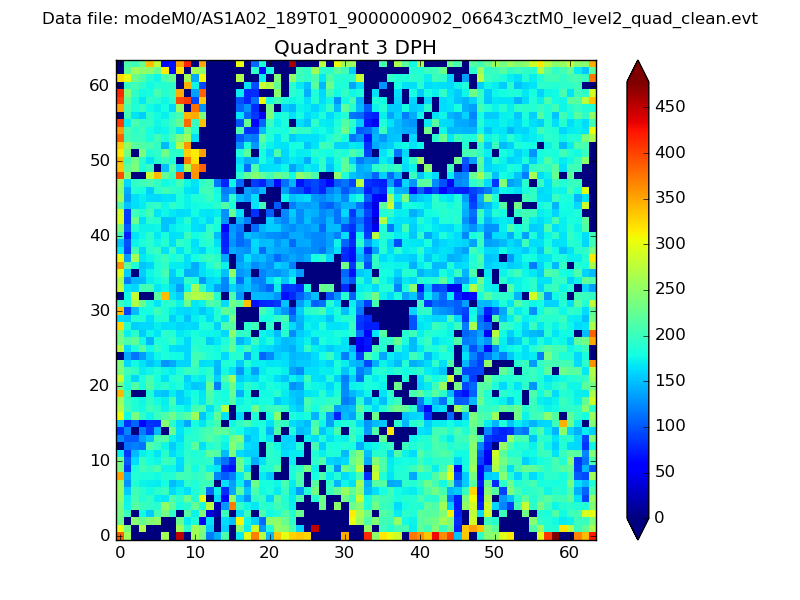 |
 |
Quadrant C |
| Plot type | Count rate plots | Images |
|---|---|---|
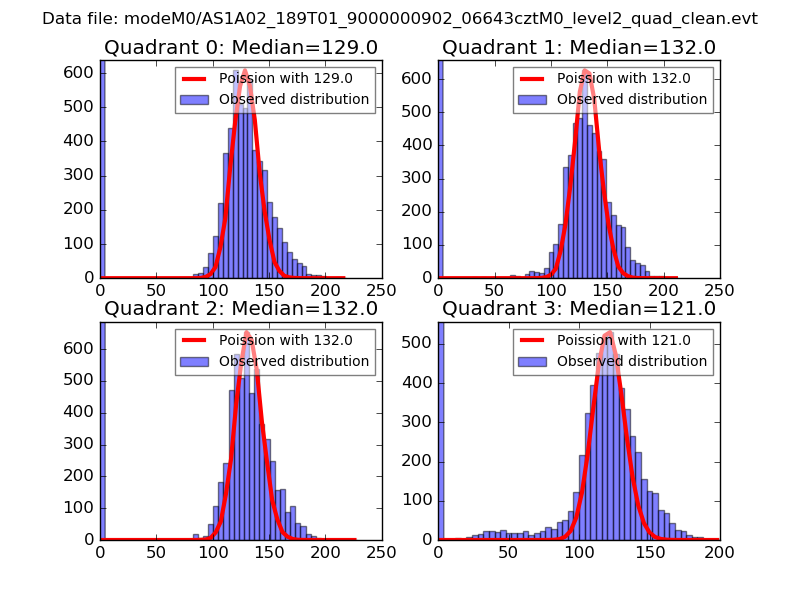
| Comparison with Poisson distribution Blue bars denote a histogram of data divided into 1 sec bins. Red curve is a Poisson curve with rate = median count rate of data. |
 |
 |
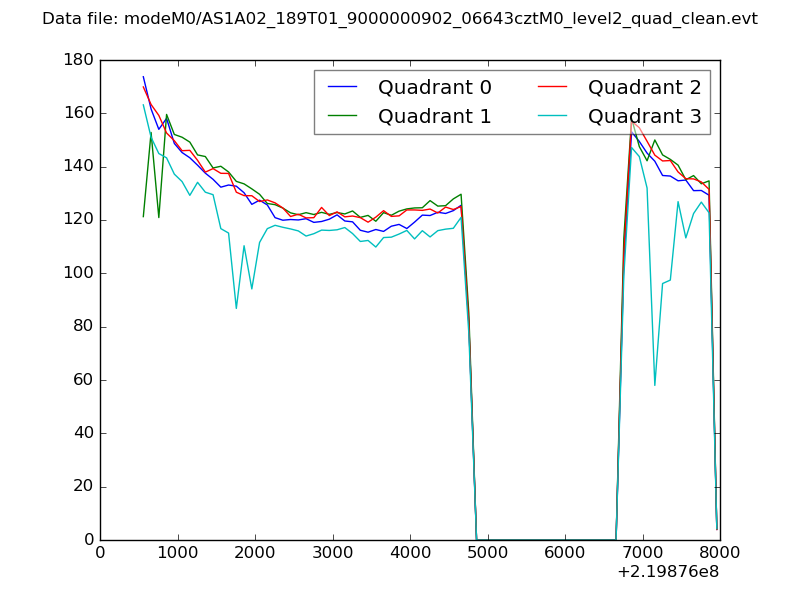
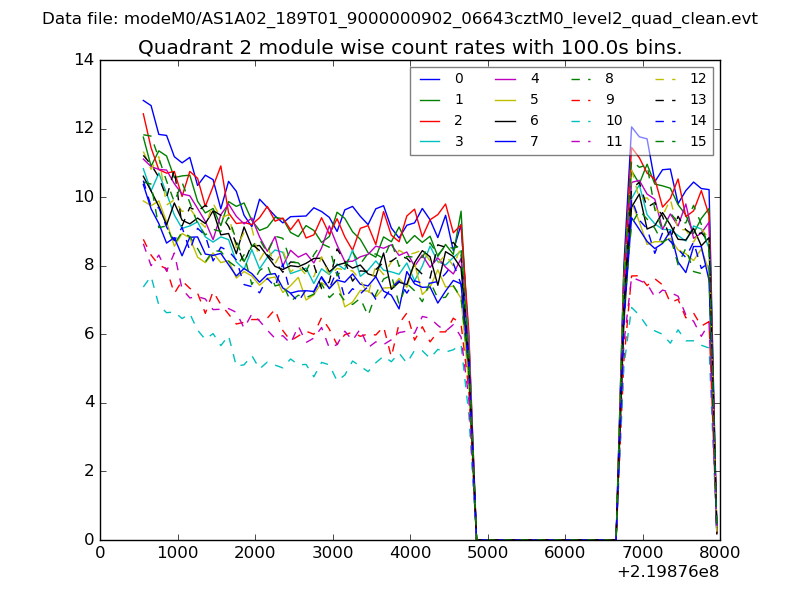
| Quadrant-wise count rates Data is divided into 100 sec bins |
 |
|
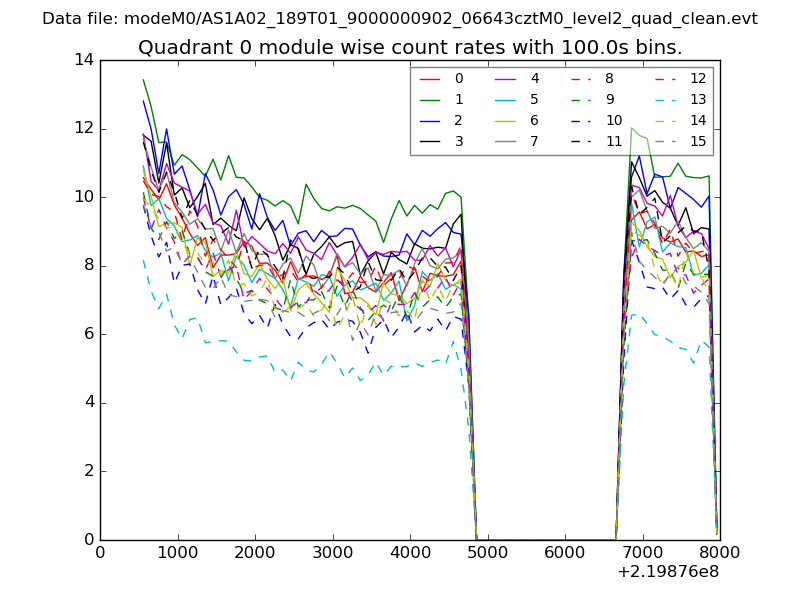
| Module-wise count rates for Quadrant A Data is divided into 100 sec bins |
 |
 |
| Module-wise count rates for Quadrant B Data is divided into 100 sec bins |
 |
 |
| Module-wise count rates for Quadrant C Data is divided into 100 sec bins |
 |
 |
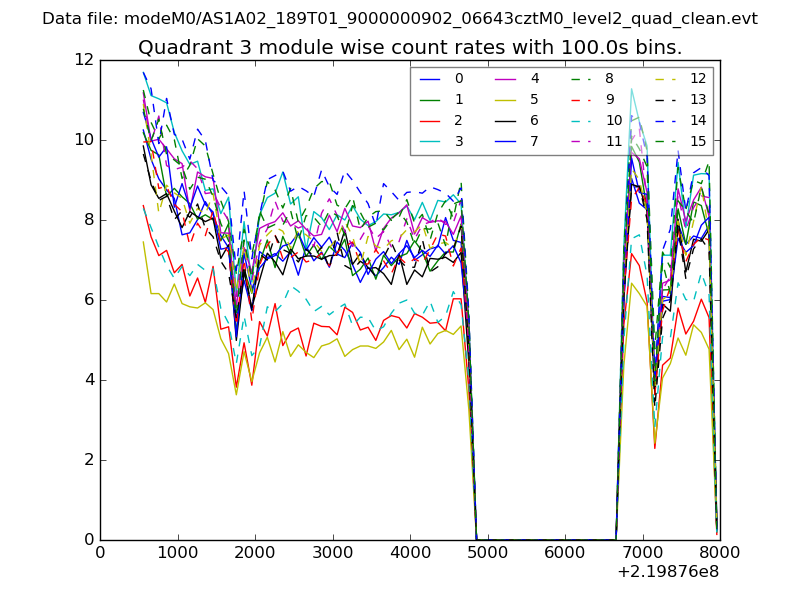
| Module-wise count rates for Quadrant D Data is divided into 100 sec bins |
 |
 |
| Parameter | Plot |
|---|---|
| CZT HV Monitor | 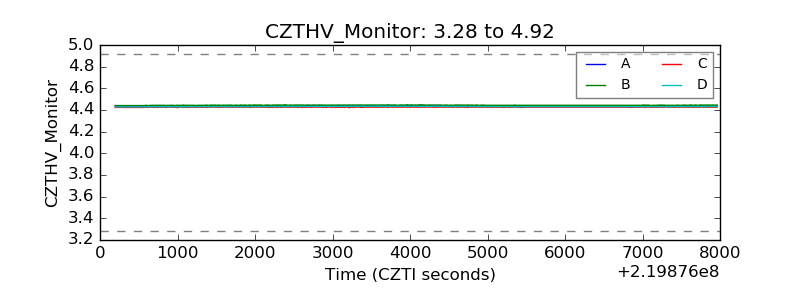 |
| D_VDD | 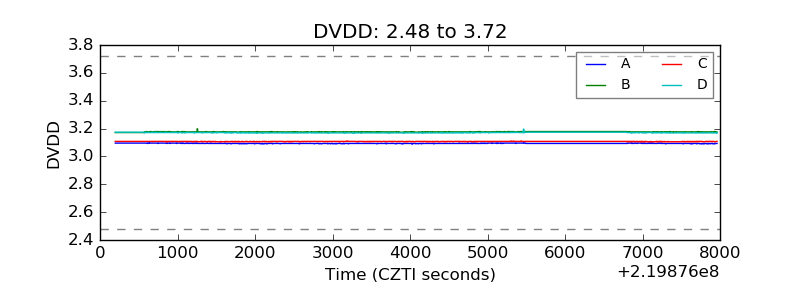 |
| Temperature 1 | 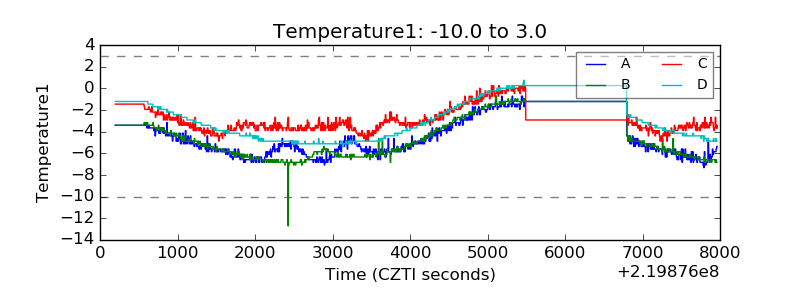 |
| Veto HV Monitor | 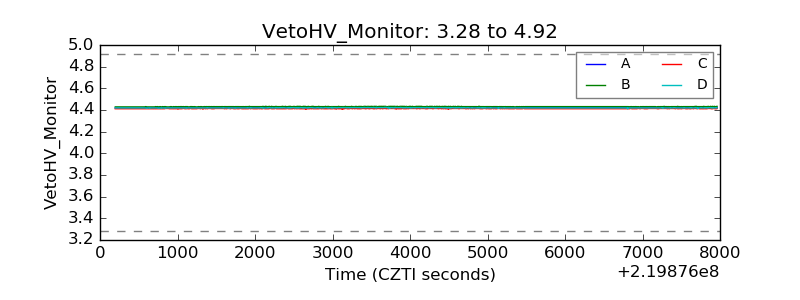 |
| Veto LLD | 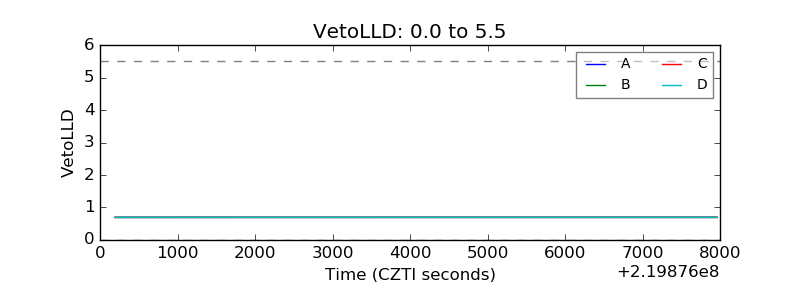 |
| Alpha Counter | 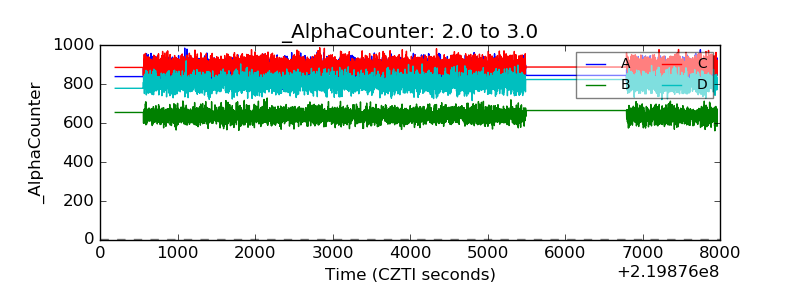 |
| _CPM_Rate | 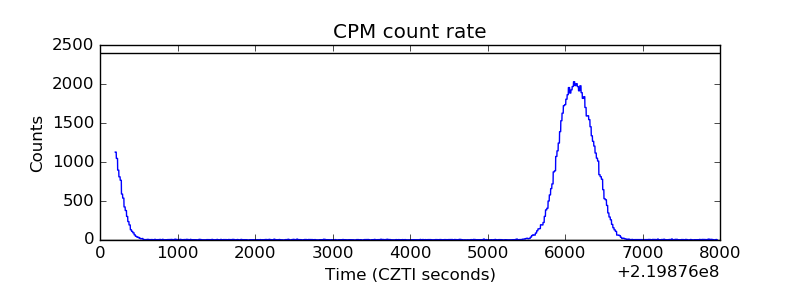 |
| CZT Counter | 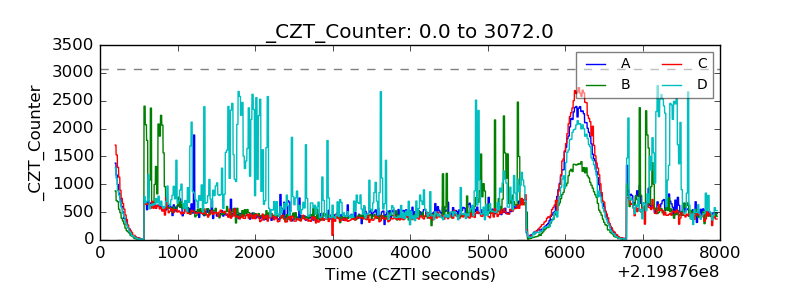 |
| +2.5 Volts monitor |  |
| +5 Volts monitor | 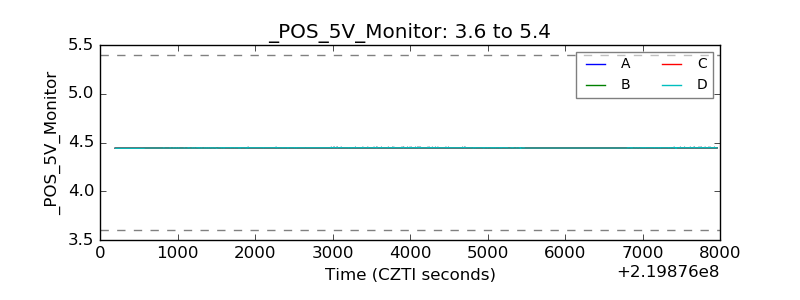 |
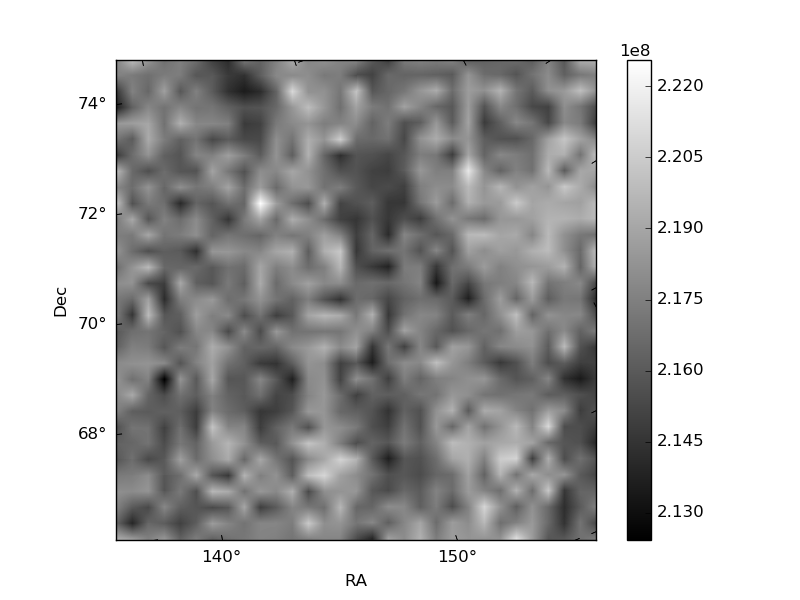
| _ROLL_ROT | 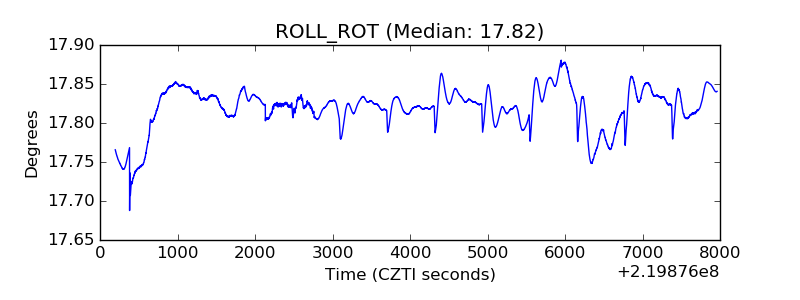 |
| _Roll_DEC | 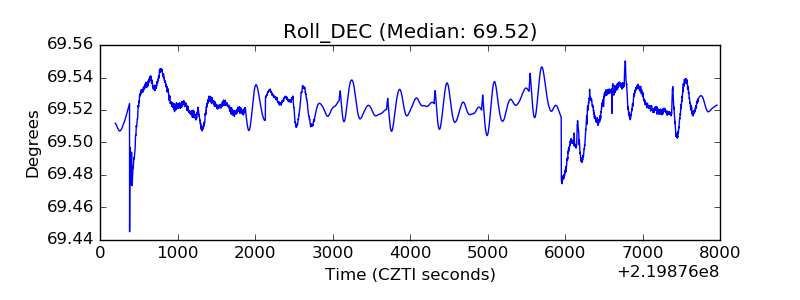 |
| _Roll_RA | 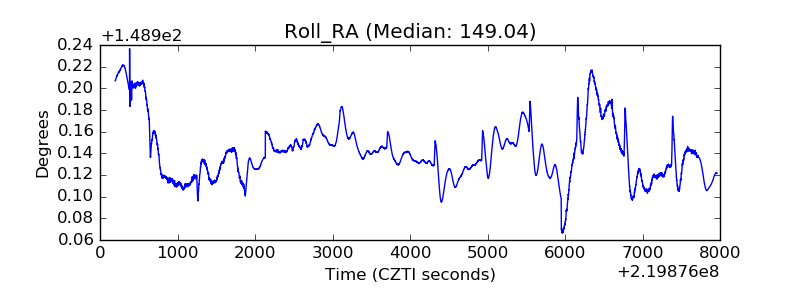 |
| Veto Counter | 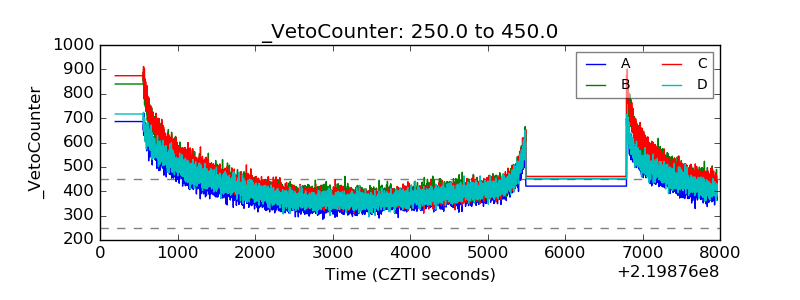 |