| Param | Original file | Final file |
|---|---|---|
| Filename | modeM0/AS1A02_189T01_9000000902_06644cztM0_level2.evt | modeM0/AS1A02_189T01_9000000902_06644cztM0_level2_quad_clean.evt |
| Size (bytes) | 529,352,640 | 106,421,760 |
| Size | 504.8 MB | 101.5 MB |
| Events in quadrant A | 3,521,036 | 697,114 |
| Events in quadrant B | 3,252,603 | 717,120 |
| Events in quadrant C | 3,051,056 | 709,687 |
| Events in quadrant D | 5,756,735 | 636,783 |
| Mode M9 | |||
|---|---|---|---|
| Quadrant | BADHDUFLAG | Total packets | Discarded packets |
| A | 0 | 19 | 0 |
| B | 0 | 19 | 0 |
| C | 0 | 19 | 0 |
| D | 0 | 20 | 0 |
| Mode M0 | |||
|---|---|---|---|
| Quadrant | BADHDUFLAG | Total packets | Discarded packets |
| A | 0 | 14821 | 3 |
| B | 0 | 14314 | 2 |
| C | 0 | 13919 | 2 |
| D | 0 | 21816 | 2 |
| Mode SS | |||
|---|---|---|---|
| Quadrant | BADHDUFLAG | Total packets | Discarded packets |
| A | 0 | 136 | 0 |
| B | 0 | 136 | 0 |
| C | 0 | 136 | 0 |
| D | 0 | 136 | 0 |
| Quadrant | Total seconds | Saturated seconds | Saturation percentage |
|---|---|---|---|
| A | 6626 | 35 | 0.528222% |
| B | 6626 | 86 | 1.297917% |
| C | 6626 | 68 | 1.026260% |
| D | 6626 | 750 | 11.319046% |
Noise dominated data is calculated using 1-second bins in cleaned event files. If a bin has >2000 counts, and if more than 50% of those come from <1% of pixels, then it is considered to be noise-dominated and hence unusable.
| Quadrant | # 1 sec bins | Bins with >0 counts | Bins with >2000 counts | High rate bins dominated by noise | Noise dominated (total time) | Noise dominated (detector-on time) | Marked lightcurve |
|---|---|---|---|---|---|---|---|
| A | 7906 | 6627 | 3 | 3 | 0.04% | 0.05% | 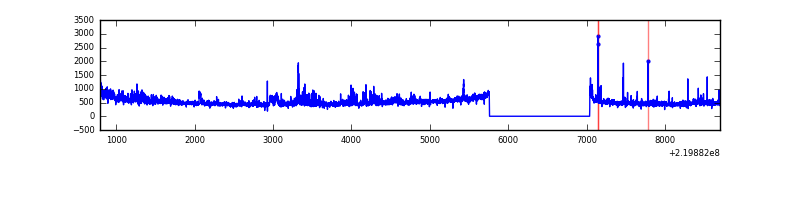 |
| B | 7906 | 6626 | 29 | 29 | 0.37% | 0.44% | 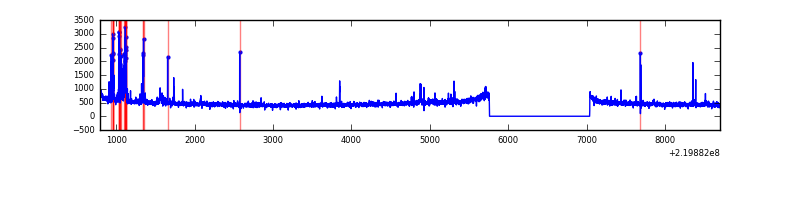 |
| C | 7906 | 6626 | 28 | 28 | 0.35% | 0.42% | 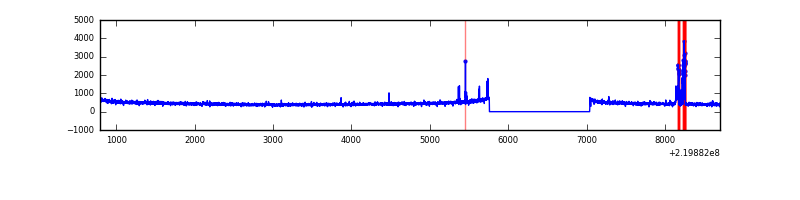 |
| D | 7906 | 6626 | 559 | 559 | 7.07% | 8.44% | 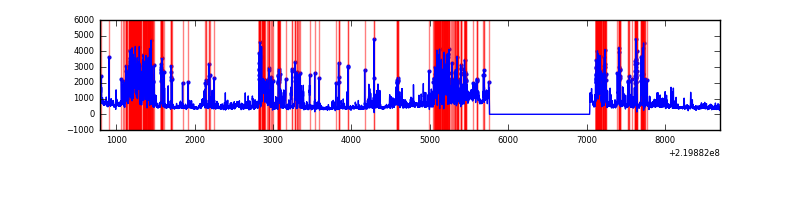 |
Top three noisy pixels from each quadrant. If the there are fewer than three noisy pixels in the level2.evt file, extra rows are filled as -1
| Pixel properties | Quadrant properties | ||||||
|---|---|---|---|---|---|---|---|
| Quadrant | DetID | PixID | Counts | Sigma | Mean | Median | Sigma |
| A | 8 | 15 | 426207 | 2782.36 | 761 | 744 | 152.9 |
| A | 15 | 239 | 140501 | 913.95 | 761 | 744 | 152.9 |
| A | 15 | 174 | 11394 | 69.64 | 761 | 744 | 152.9 |
| B | 0 | 228 | 164629 | 1135.9 | 776 | 759 | 144.3 |
| B | 0 | 219 | 18493 | 122.93 | 776 | 759 | 144.3 |
| B | 4 | 170 | 16931 | 112.1 | 776 | 759 | 144.3 |
| C | 9 | 247 | 133755 | 777.63 | 746 | 751 | 171.0 |
| C | 13 | 61 | 6032 | 30.88 | 746 | 751 | 171.0 |
| C | 1 | 16 | 4224 | 20.31 | 746 | 751 | 171.0 |
| D | 2 | 33 | 1985735 | 11796.88 | 698 | 676 | 168.3 |
| D | 2 | 152 | 621892 | 3691.78 | 698 | 676 | 168.3 |
| D | 4 | 95 | 155286 | 918.82 | 698 | 676 | 168.3 |
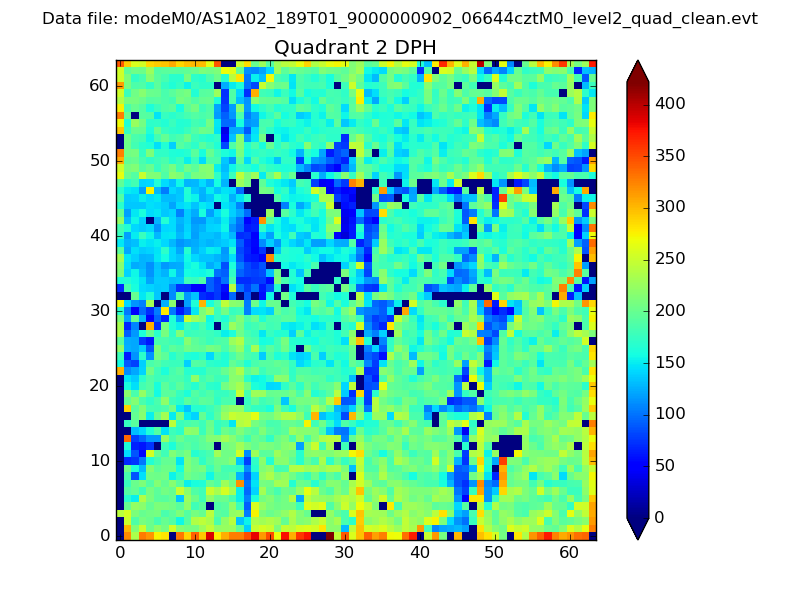
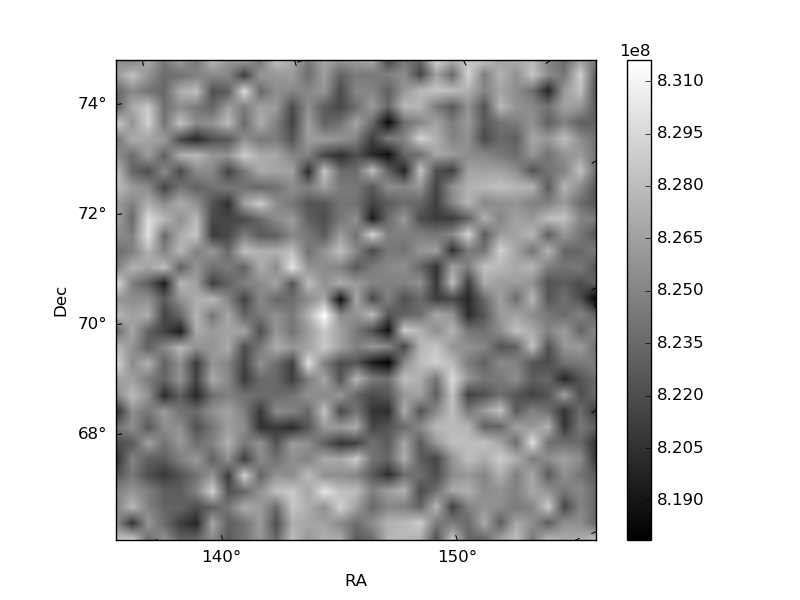
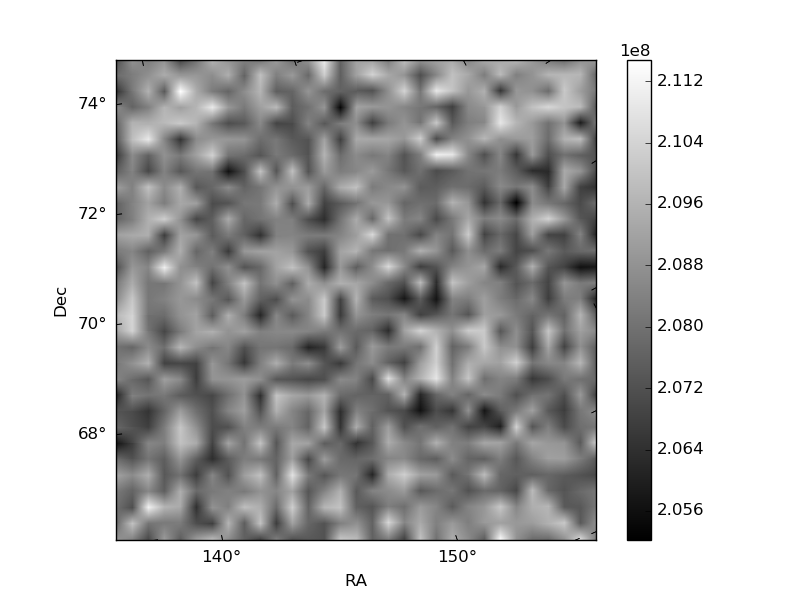
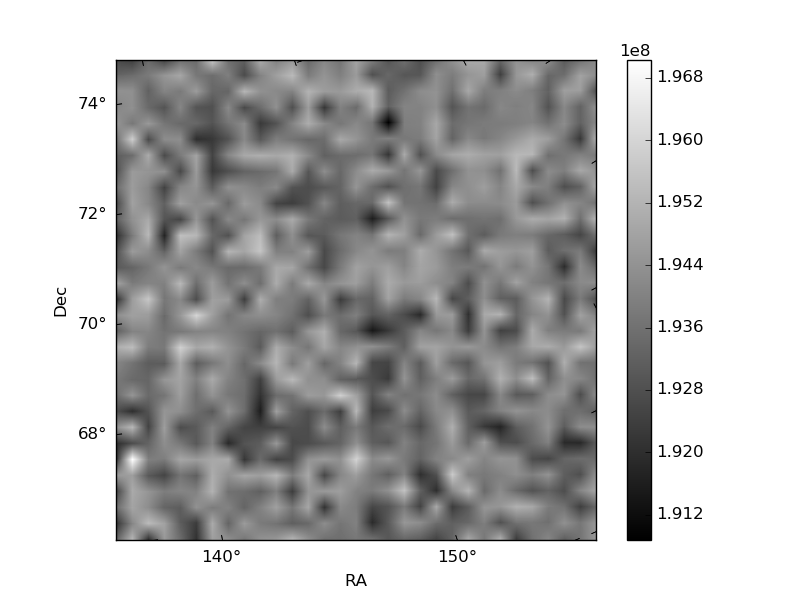
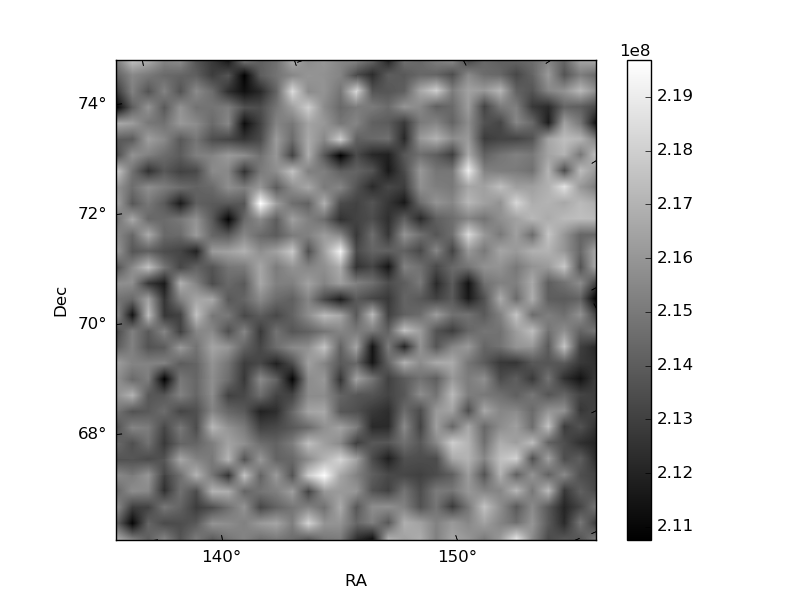
Histogram calculated using DETX and DETY for each event in the final _common_clean file
| Quadrant A | 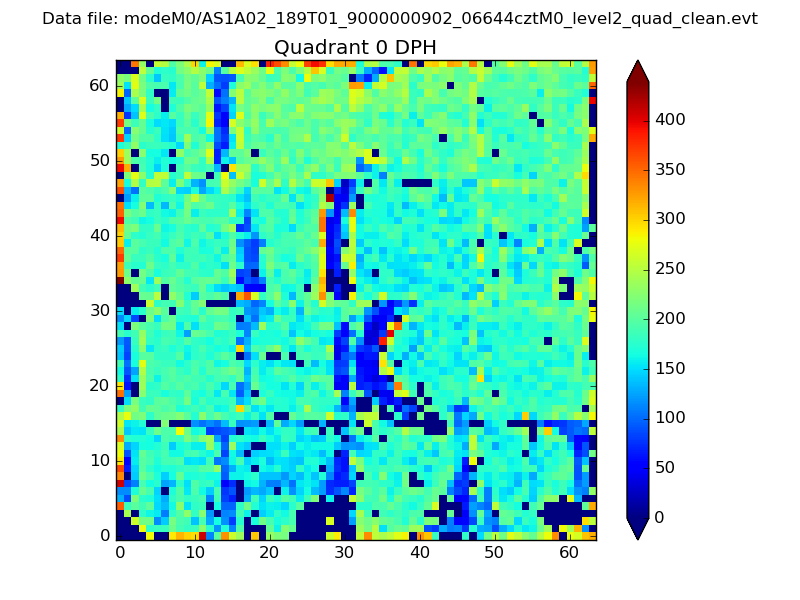 |
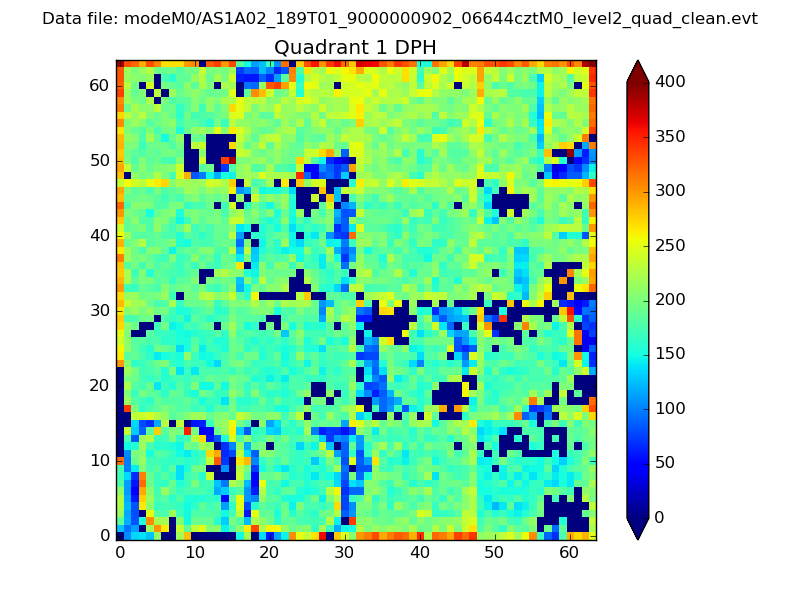 |
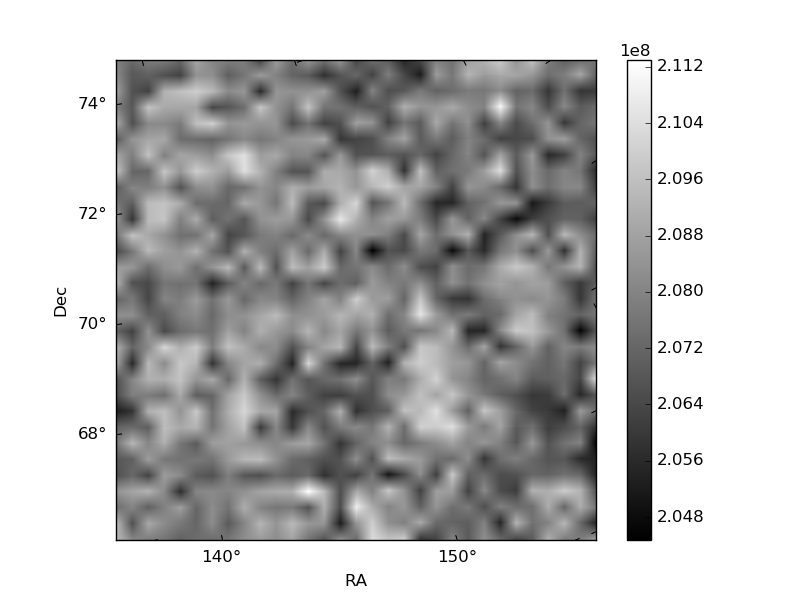
Quadrant B |
|---|---|---|---|
| Quadrant D | 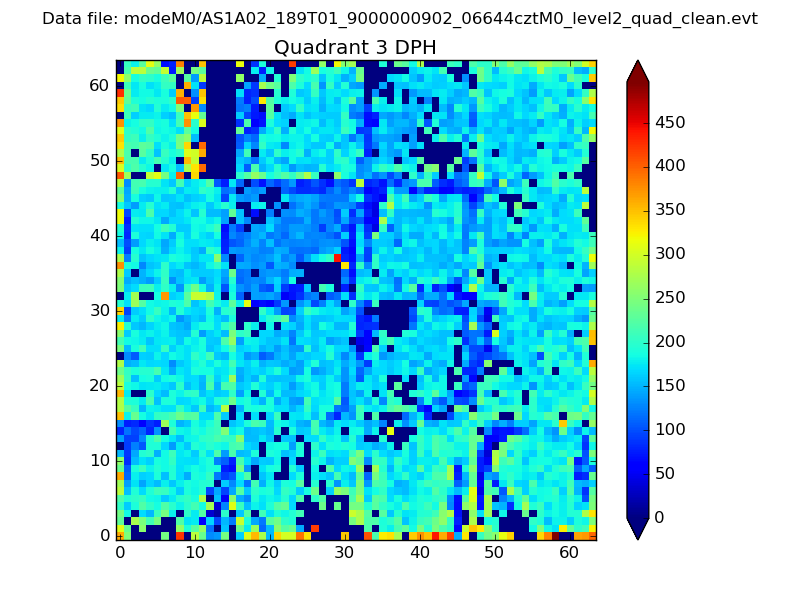 |
 |
Quadrant C |
| Plot type | Count rate plots | Images |
|---|---|---|
| Comparison with Poisson distribution Blue bars denote a histogram of data divided into 1 sec bins. Red curve is a Poisson curve with rate = median count rate of data. |
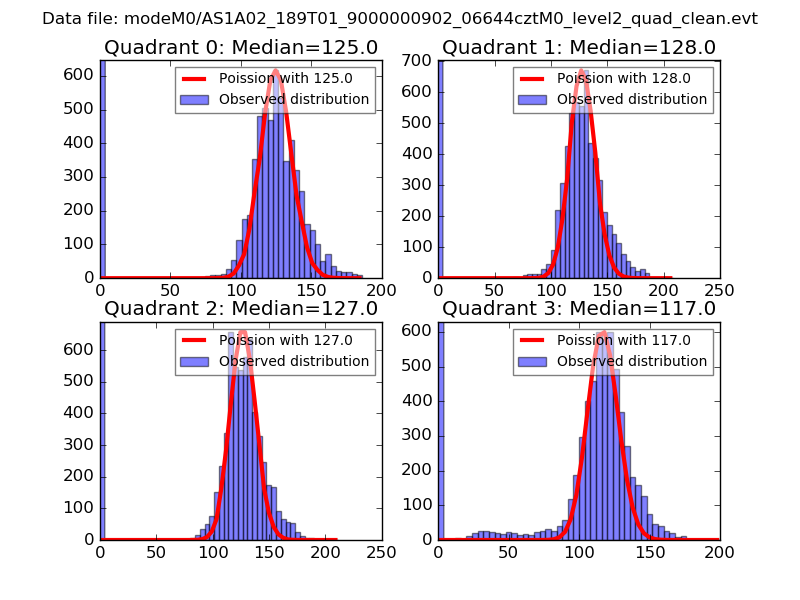 |
 |
| Quadrant-wise count rates Data is divided into 100 sec bins |
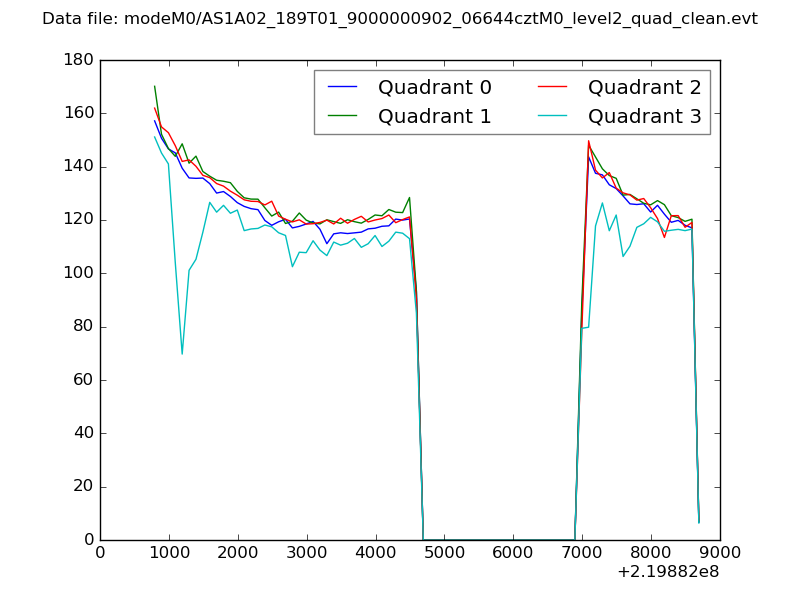 |
|
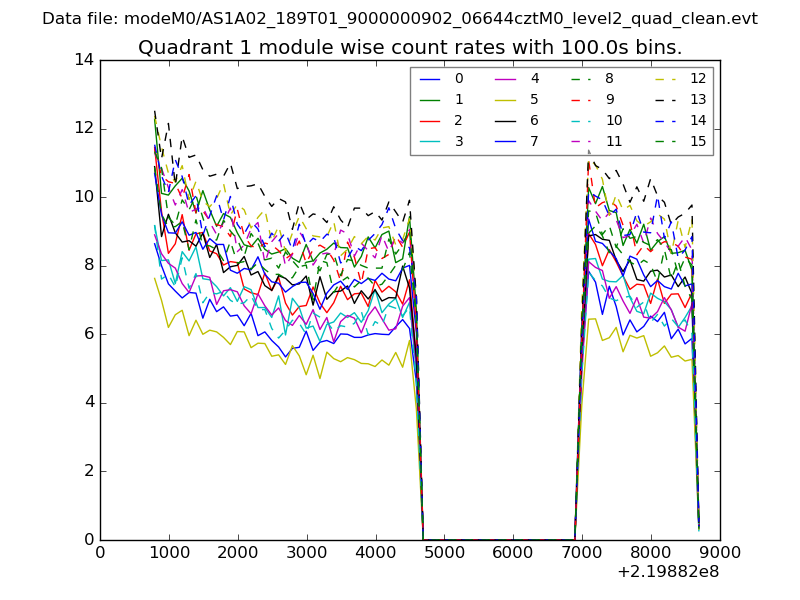
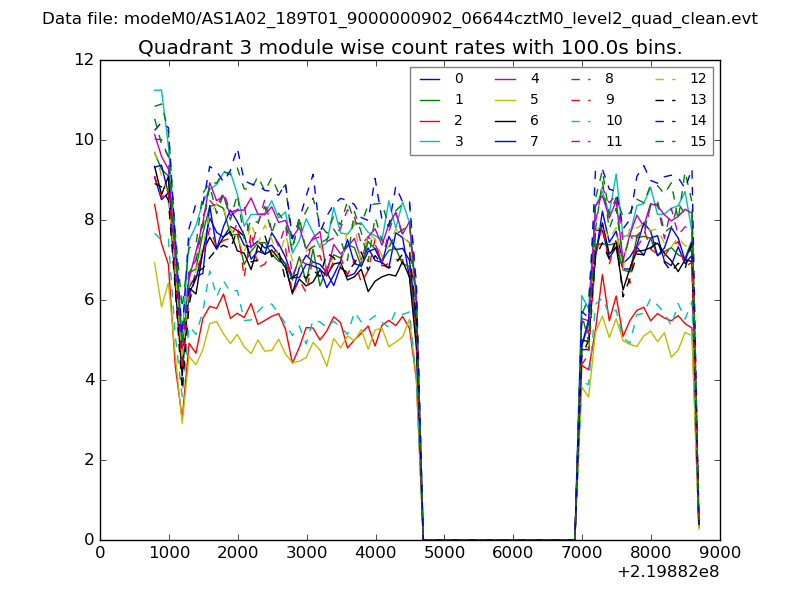
| Module-wise count rates for Quadrant A Data is divided into 100 sec bins |
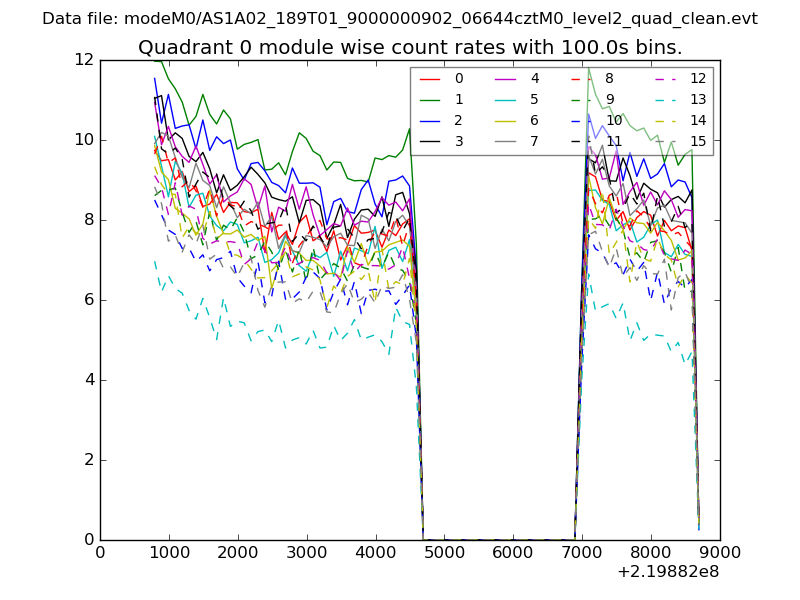 |
 |
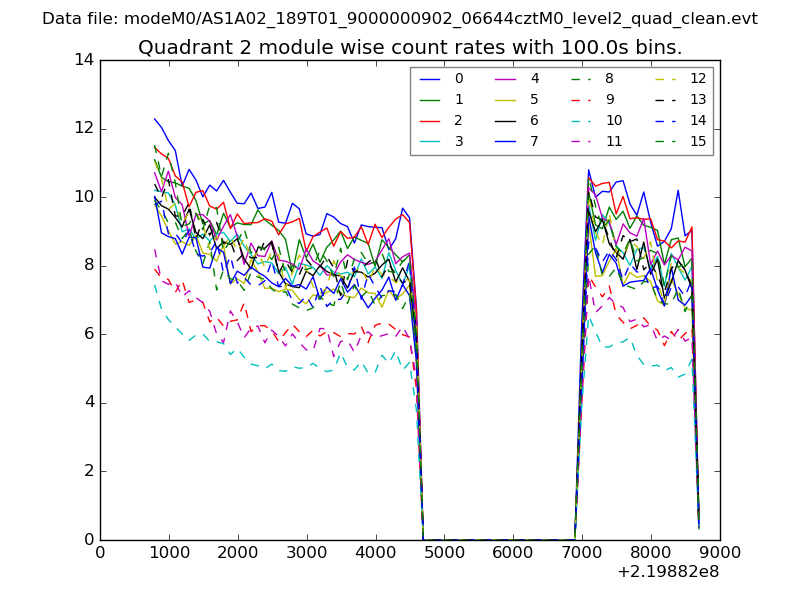
| Module-wise count rates for Quadrant B Data is divided into 100 sec bins |
 |
 |
| Module-wise count rates for Quadrant C Data is divided into 100 sec bins |
 |
 |
| Module-wise count rates for Quadrant D Data is divided into 100 sec bins |
 |
 |
| Parameter | Plot |
|---|---|
| CZT HV Monitor | 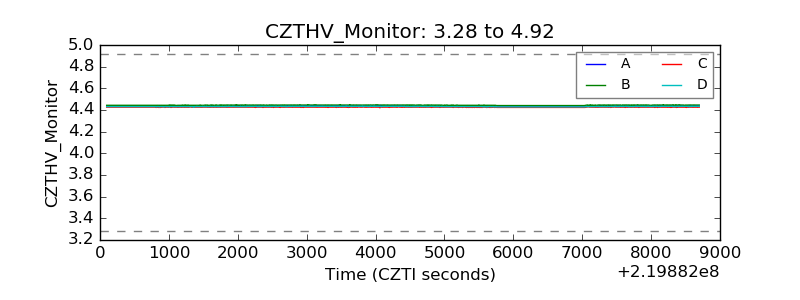 |
| D_VDD | 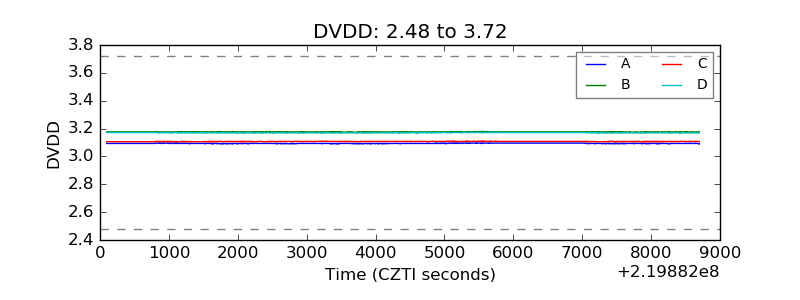 |
| Temperature 1 | 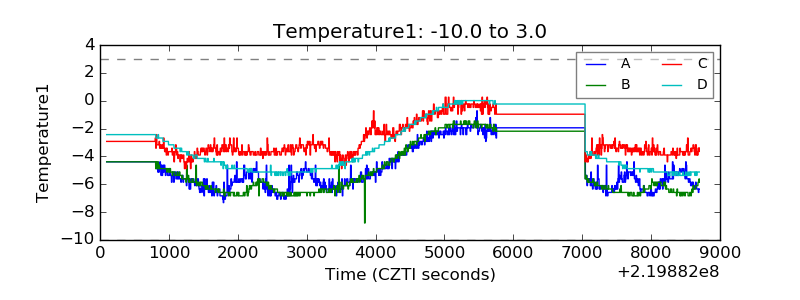 |
| Veto HV Monitor | 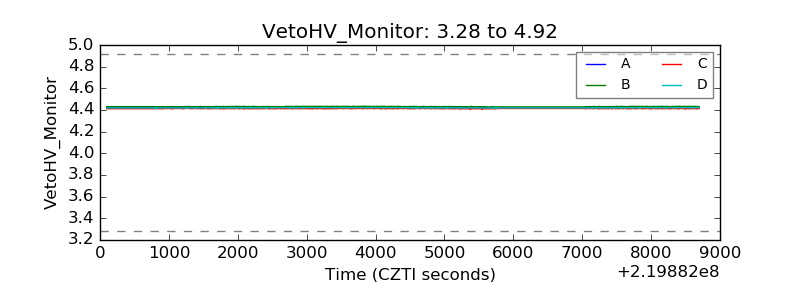 |
| Veto LLD | 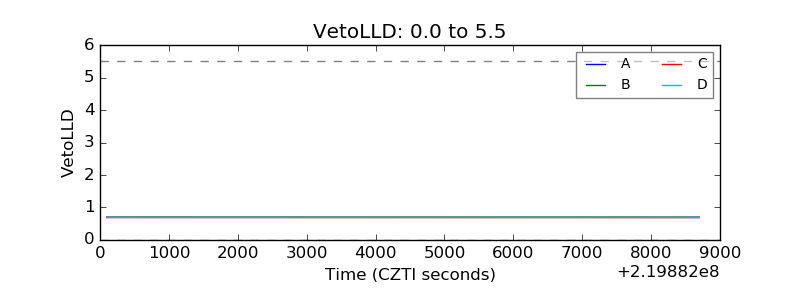 |
| Alpha Counter | 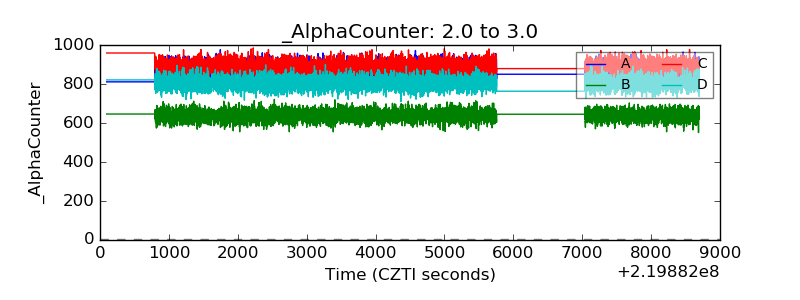 |
| _CPM_Rate | 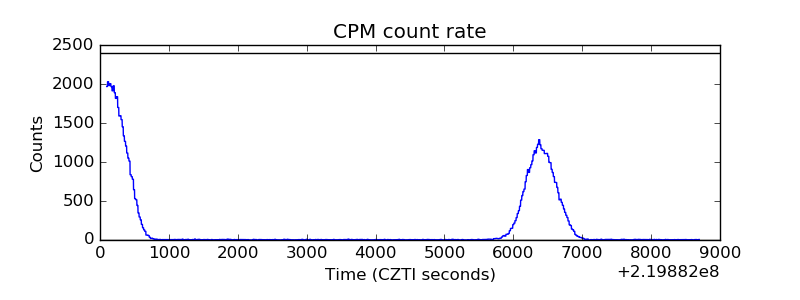 |
| CZT Counter | 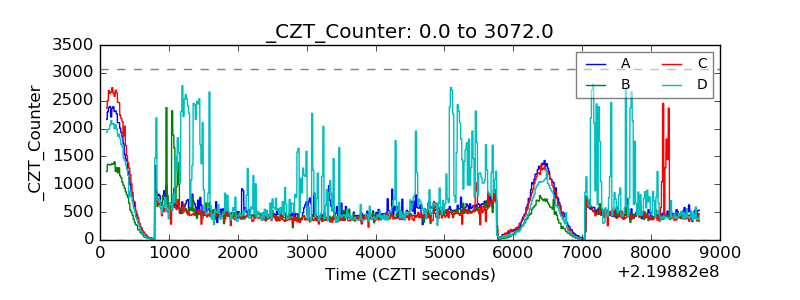 |
| +2.5 Volts monitor |  |
| +5 Volts monitor |  |
| _ROLL_ROT | 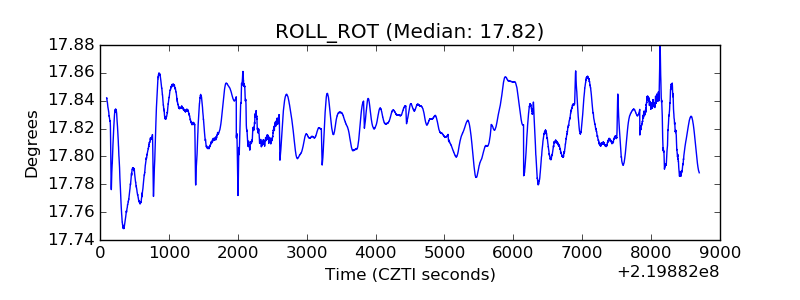 |
| _Roll_DEC | 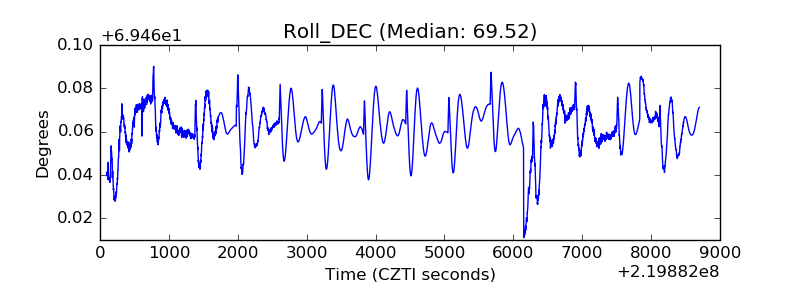 |
| _Roll_RA | 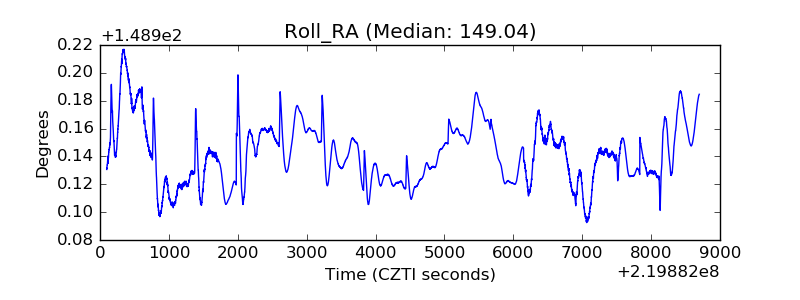 |
| Veto Counter |  |