| Param | Original file | Final file |
|---|---|---|
| Filename | modeM0/AS1A02_189T01_9000000902_06645cztM0_level2.evt | modeM0/AS1A02_189T01_9000000902_06645cztM0_level2_quad_clean.evt |
| Size (bytes) | 498,712,320 | 98,691,840 |
| Size | 475.6 MB | 94.1 MB |
| Events in quadrant A | 3,325,559 | 640,544 |
| Events in quadrant B | 3,051,931 | 658,944 |
| Events in quadrant C | 2,951,765 | 645,110 |
| Events in quadrant D | 5,322,910 | 580,910 |
| Mode M9 | |||
|---|---|---|---|
| Quadrant | BADHDUFLAG | Total packets | Discarded packets |
| A | 0 | 11 | 0 |
| B | 0 | 11 | 0 |
| C | 0 | 11 | 0 |
| D | 0 | 11 | 0 |
| Mode M0 | |||
|---|---|---|---|
| Quadrant | BADHDUFLAG | Total packets | Discarded packets |
| A | 0 | 14252 | 2 |
| B | 0 | 13849 | 1 |
| C | 0 | 13787 | 1 |
| D | 0 | 20498 | 1 |
| Mode SS | |||
|---|---|---|---|
| Quadrant | BADHDUFLAG | Total packets | Discarded packets |
| A | 0 | 136 | 0 |
| B | 0 | 136 | 0 |
| C | 0 | 136 | 0 |
| D | 0 | 136 | 0 |
| Quadrant | Total seconds | Saturated seconds | Saturation percentage |
|---|---|---|---|
| A | 6640 | 22 | 0.331325% |
| B | 6640 | 17 | 0.256024% |
| C | 6640 | 42 | 0.632530% |
| D | 6640 | 735 | 11.069277% |
Noise dominated data is calculated using 1-second bins in cleaned event files. If a bin has >2000 counts, and if more than 50% of those come from <1% of pixels, then it is considered to be noise-dominated and hence unusable.
| Quadrant | # 1 sec bins | Bins with >0 counts | Bins with >2000 counts | High rate bins dominated by noise | Noise dominated (total time) | Noise dominated (detector-on time) | Marked lightcurve |
|---|---|---|---|---|---|---|---|
| A | 7795 | 6641 | 9 | 9 | 0.12% | 0.14% | 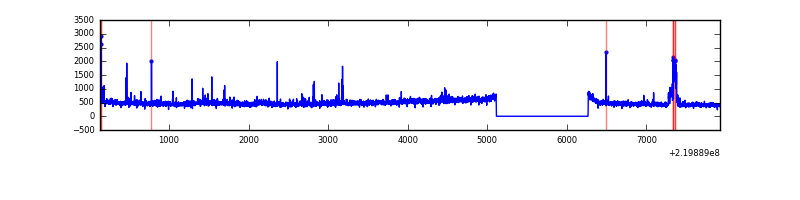 |
| B | 7795 | 6641 | 2 | 2 | 0.03% | 0.03% | 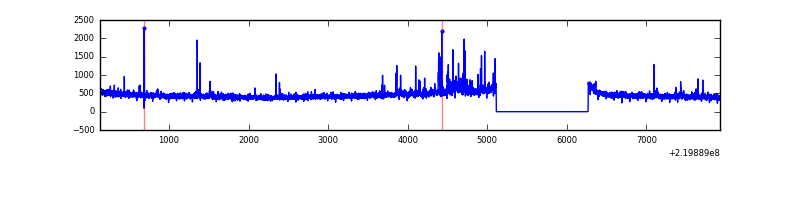 |
| C | 7795 | 6641 | 27 | 27 | 0.35% | 0.41% | 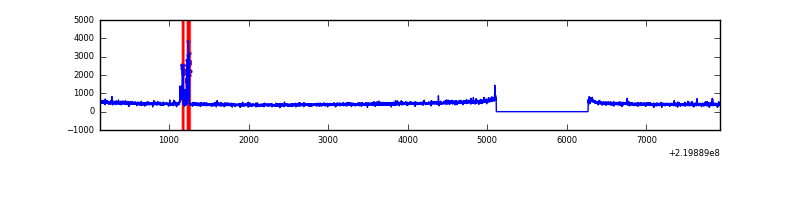 |
| D | 7795 | 6641 | 553 | 553 | 7.09% | 8.33% | 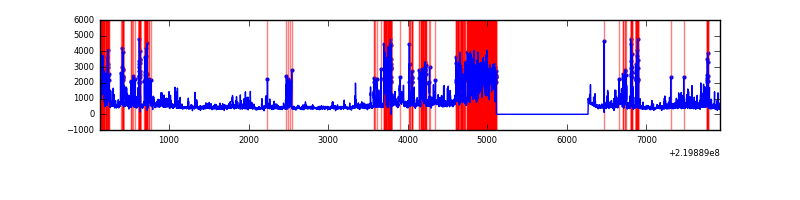 |
Top three noisy pixels from each quadrant. If the there are fewer than three noisy pixels in the level2.evt file, extra rows are filled as -1
| Pixel properties | Quadrant properties | ||||||
|---|---|---|---|---|---|---|---|
| Quadrant | DetID | PixID | Counts | Sigma | Mean | Median | Sigma |
| A | 8 | 15 | 384495 | 2581.01 | 739 | 723 | 148.7 |
| A | 15 | 239 | 85893 | 572.8 | 739 | 723 | 148.7 |
| A | 0 | 226 | 7213 | 43.64 | 739 | 723 | 148.7 |
| B | 4 | 170 | 70200 | 490.85 | 754 | 733 | 141.5 |
| B | 0 | 214 | 16519 | 111.54 | 754 | 733 | 141.5 |
| B | 12 | 111 | 13717 | 91.74 | 754 | 733 | 141.5 |
| C | 9 | 247 | 130881 | 787.6 | 719 | 721 | 165.3 |
| C | 1 | 16 | 7568 | 41.43 | 719 | 721 | 165.3 |
| C | 10 | 22 | 6518 | 35.08 | 719 | 721 | 165.3 |
| D | 2 | 33 | 1672764 | 10358.51 | 665 | 642 | 161.4 |
| D | 2 | 152 | 431283 | 2667.75 | 665 | 642 | 161.4 |
| D | 8 | 195 | 282901 | 1748.55 | 665 | 642 | 161.4 |
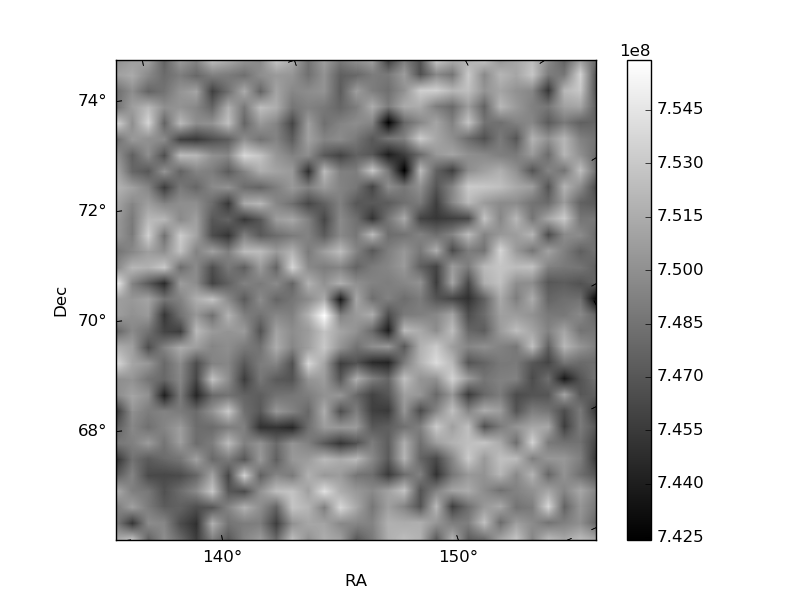
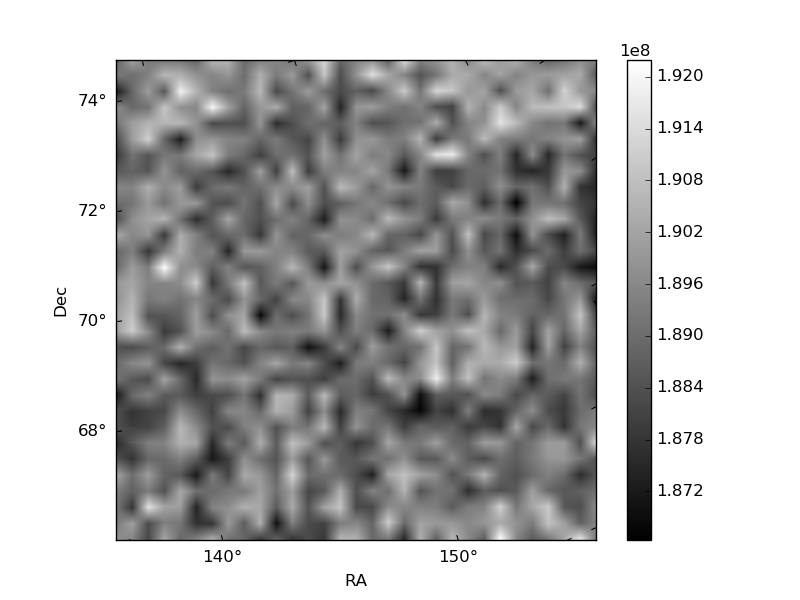
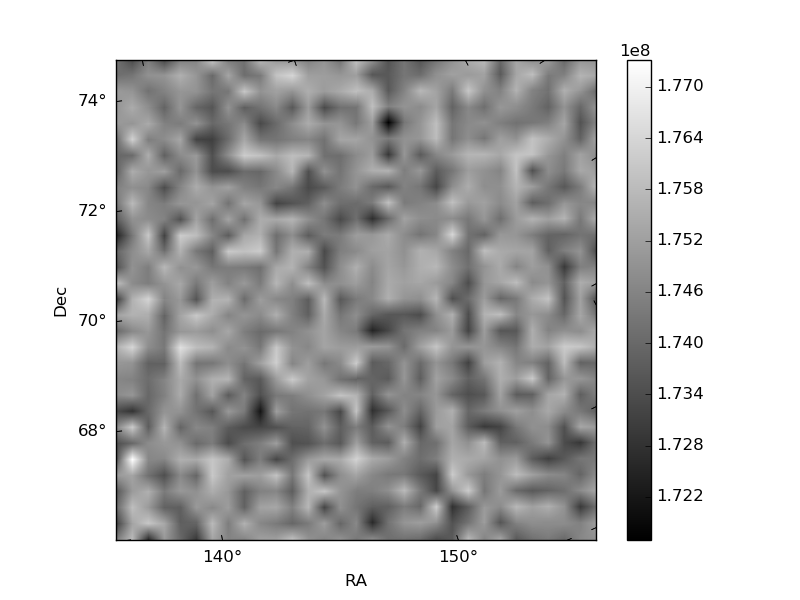
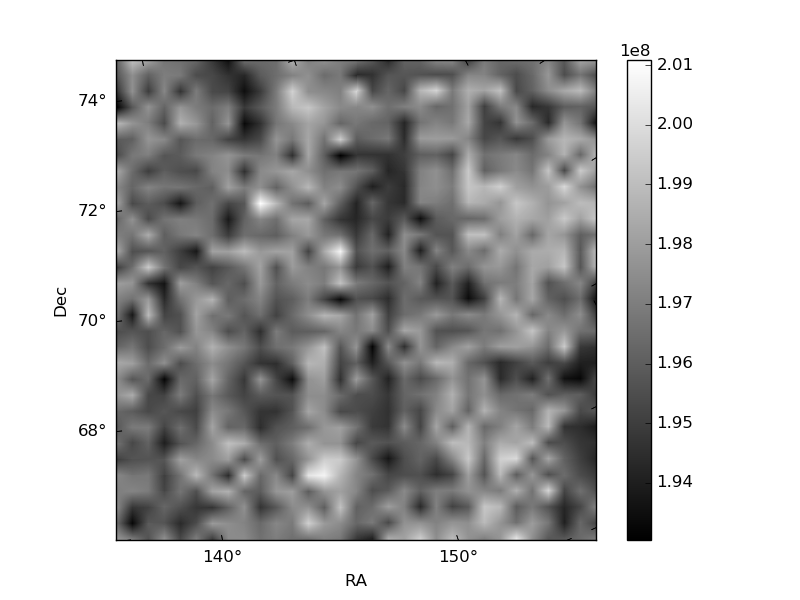
Histogram calculated using DETX and DETY for each event in the final _common_clean file
| Quadrant A | 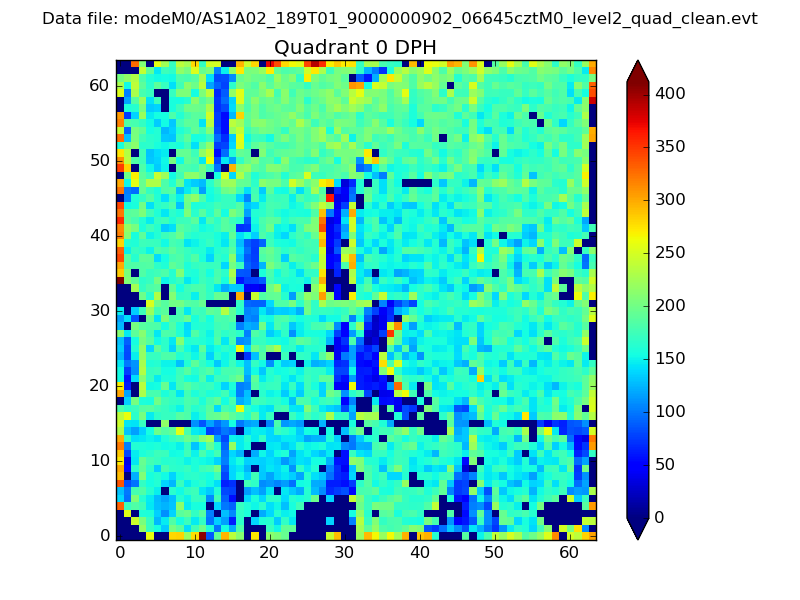 |
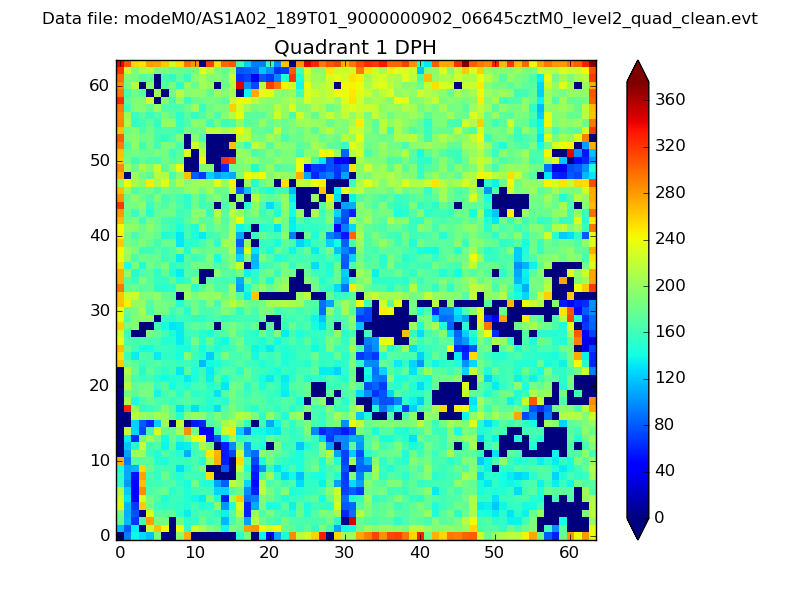 |
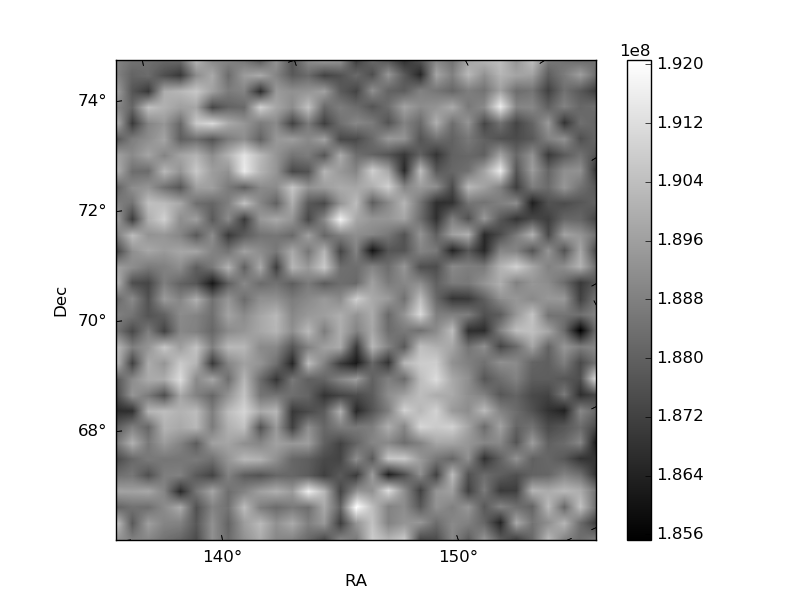
Quadrant B |
|---|---|---|---|
| Quadrant D | 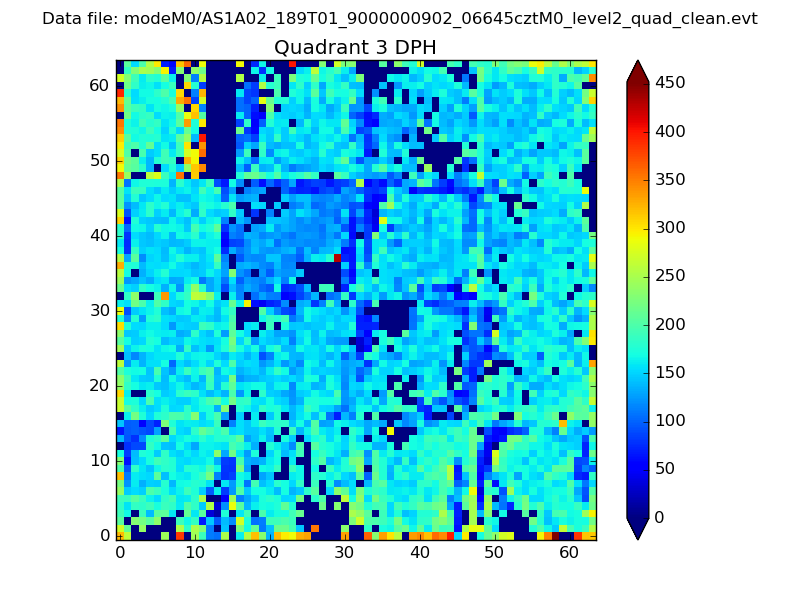 |
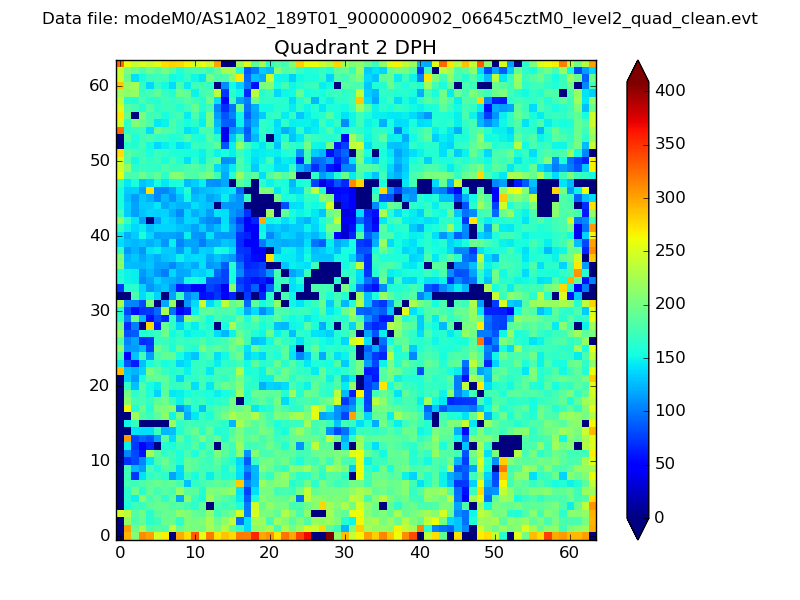 |
Quadrant C |
| Plot type | Count rate plots | Images |
|---|---|---|
| Comparison with Poisson distribution Blue bars denote a histogram of data divided into 1 sec bins. Red curve is a Poisson curve with rate = median count rate of data. |
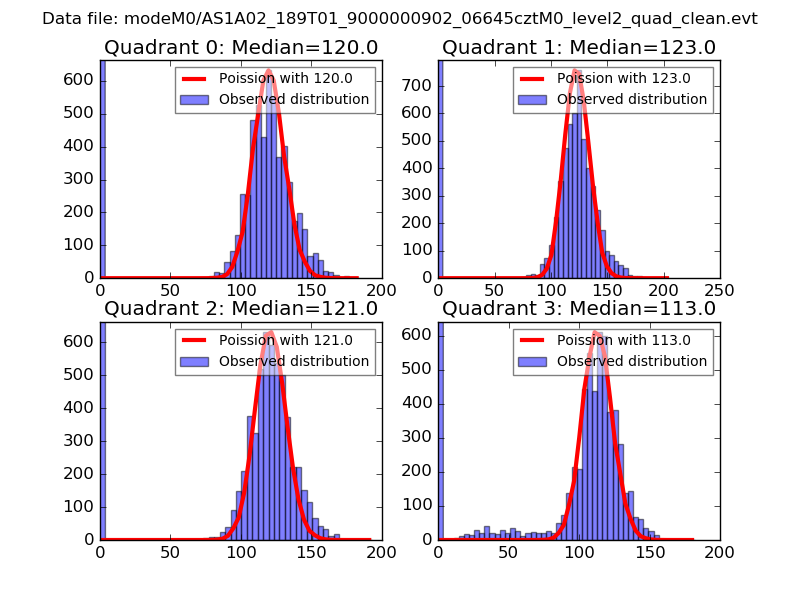 |
 |
| Quadrant-wise count rates Data is divided into 100 sec bins |
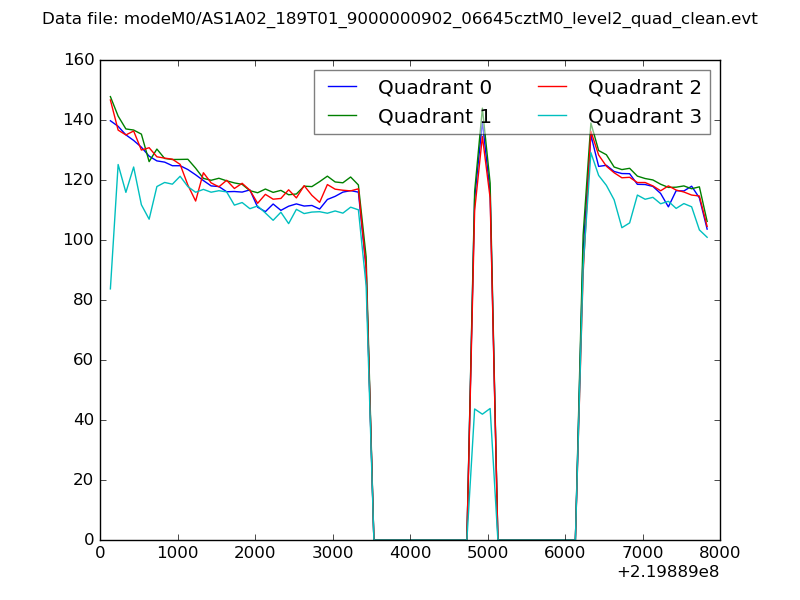 |
|
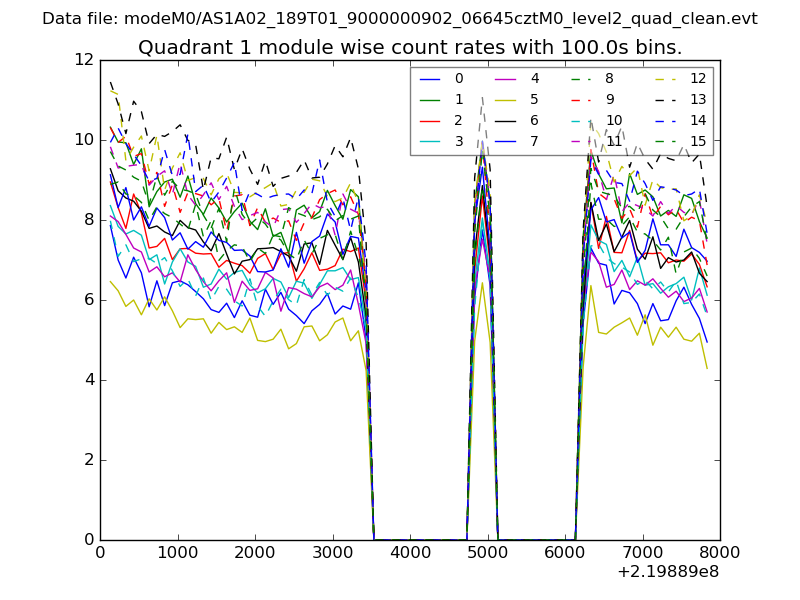
| Module-wise count rates for Quadrant A Data is divided into 100 sec bins |
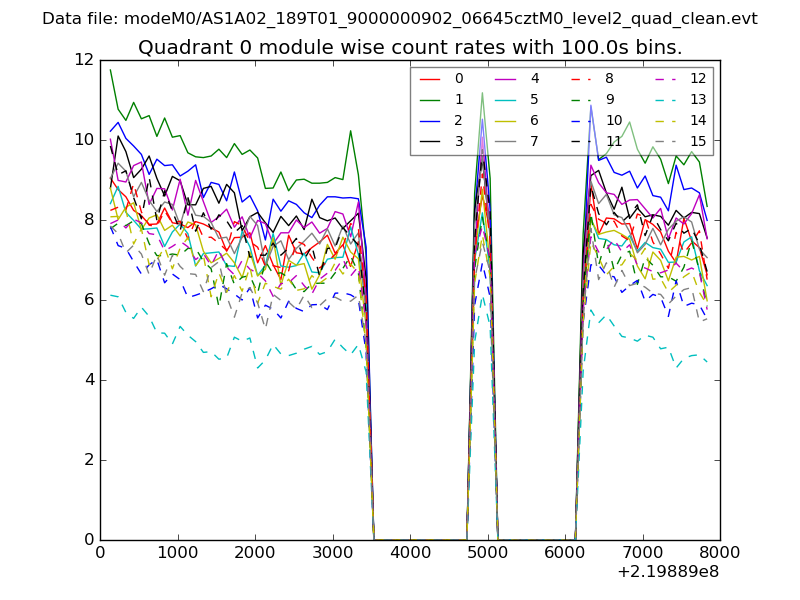 |
 |
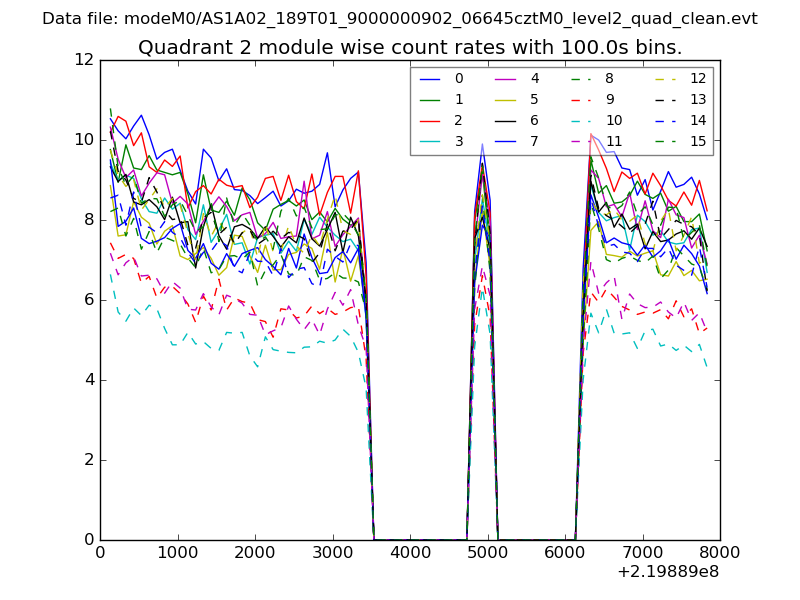
| Module-wise count rates for Quadrant B Data is divided into 100 sec bins |
 |
 |
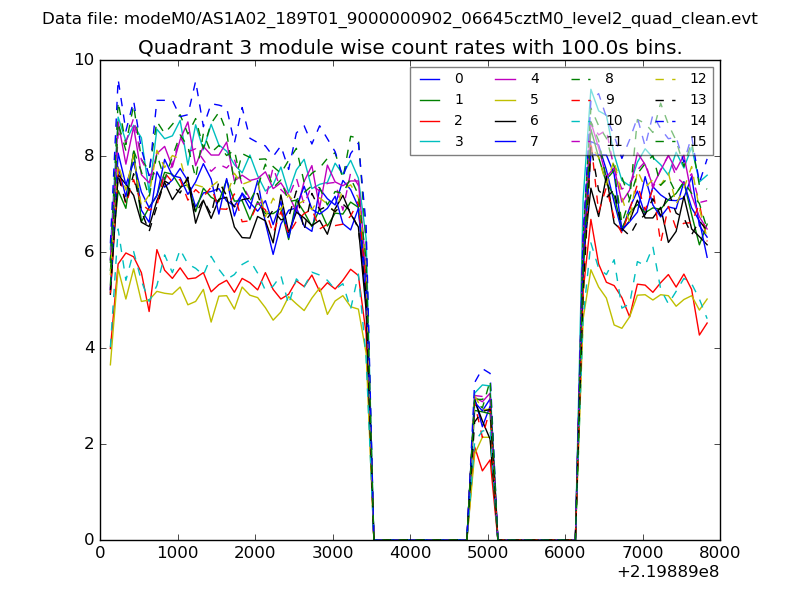
| Module-wise count rates for Quadrant C Data is divided into 100 sec bins |
 |
 |
| Module-wise count rates for Quadrant D Data is divided into 100 sec bins |
 |
 |
| Parameter | Plot |
|---|---|
| CZT HV Monitor | 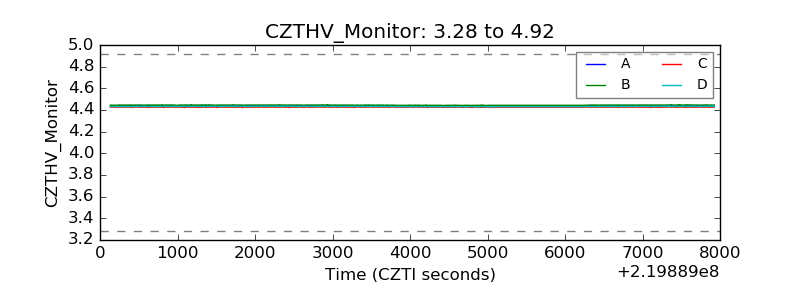 |
| D_VDD | 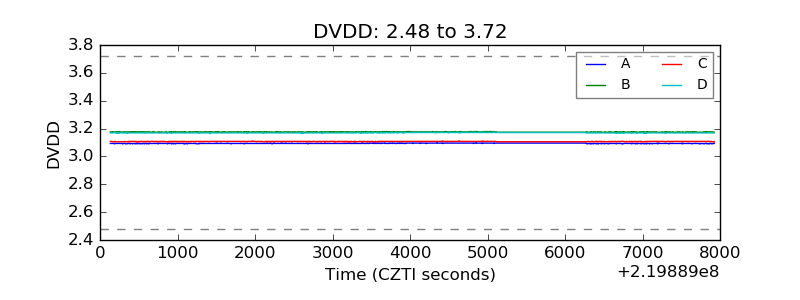 |
| Temperature 1 | 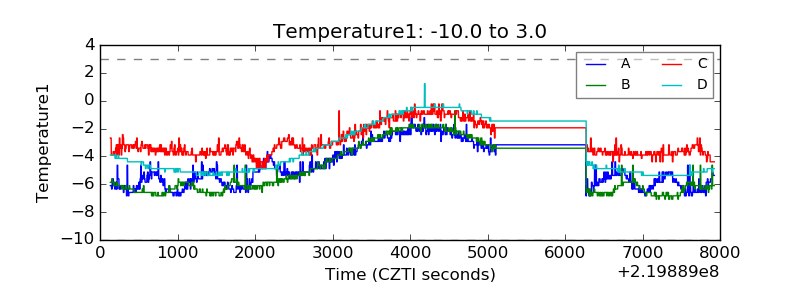 |
| Veto HV Monitor | 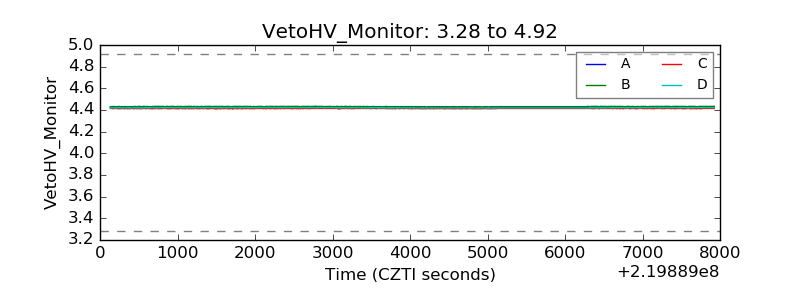 |
| Veto LLD | 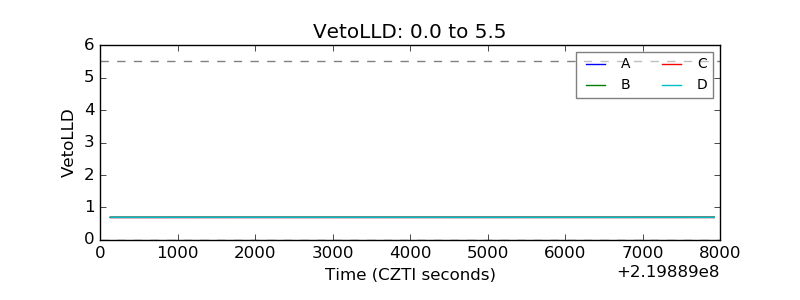 |
| Alpha Counter | 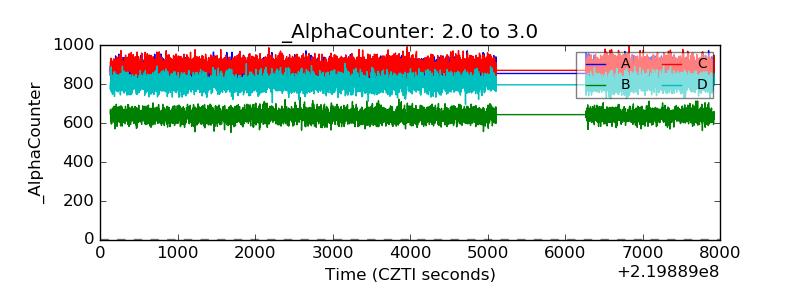 |
| _CPM_Rate |  |
| CZT Counter |  |
| +2.5 Volts monitor | 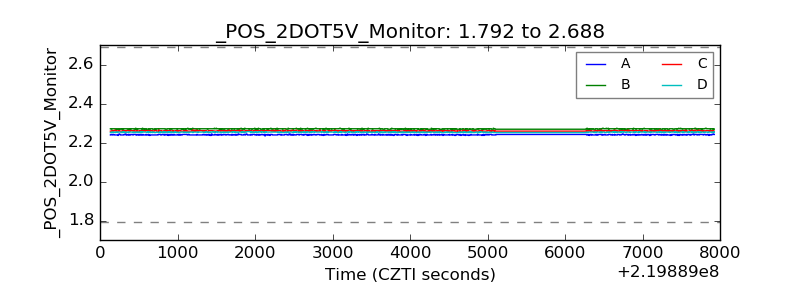 |
| +5 Volts monitor |  |
| _ROLL_ROT | 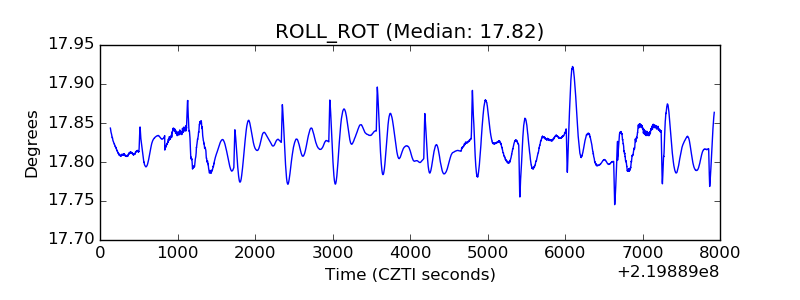 |
| _Roll_DEC | 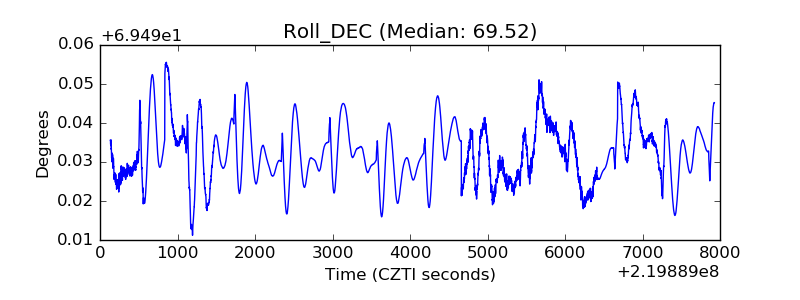 |
| _Roll_RA | 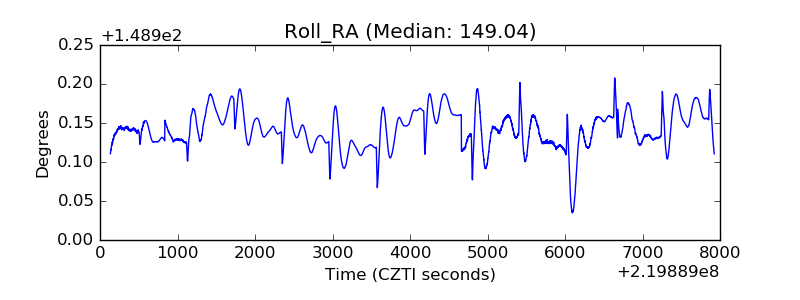 |
| Veto Counter | 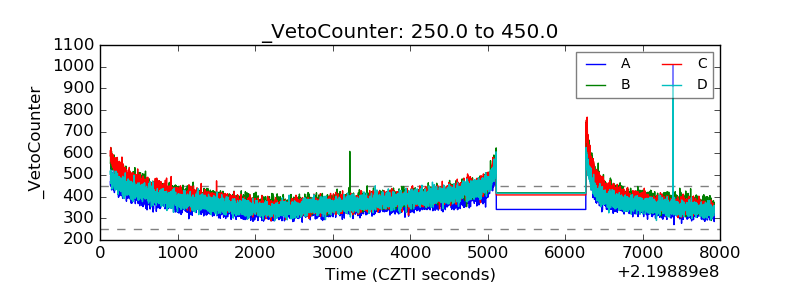 |