| Param | Original file | Final file |
|---|---|---|
| Filename | modeM0/AS1A02_189T01_9000000902_06646cztM0_level2.evt | modeM0/AS1A02_189T01_9000000902_06646cztM0_level2_quad_clean.evt |
| Size (bytes) | 508,040,640 | 101,960,640 |
| Size | 484.5 MB | 97.2 MB |
| Events in quadrant A | 3,514,333 | 658,185 |
| Events in quadrant B | 3,122,526 | 670,983 |
| Events in quadrant C | 2,921,902 | 659,871 |
| Events in quadrant D | 5,357,572 | 616,654 |
| Mode M9 | |||
|---|---|---|---|
| Quadrant | BADHDUFLAG | Total packets | Discarded packets |
| A | 0 | 13 | 0 |
| B | 0 | 13 | 0 |
| C | 0 | 13 | 0 |
| D | 0 | 14 | 0 |
| Mode M0 | |||
|---|---|---|---|
| Quadrant | BADHDUFLAG | Total packets | Discarded packets |
| A | 0 | 15267 | 3 |
| B | 0 | 14257 | 2 |
| C | 0 | 14002 | 2 |
| D | 0 | 20904 | 2 |
| Mode SS | |||
|---|---|---|---|
| Quadrant | BADHDUFLAG | Total packets | Discarded packets |
| A | 0 | 140 | 0 |
| B | 0 | 140 | 0 |
| C | 0 | 140 | 0 |
| D | 0 | 140 | 0 |
| Quadrant | Total seconds | Saturated seconds | Saturation percentage |
|---|---|---|---|
| A | 6921 | 32 | 0.462361% |
| B | 6921 | 14 | 0.202283% |
| C | 6921 | 25 | 0.361219% |
| D | 6921 | 411 | 5.938448% |
Noise dominated data is calculated using 1-second bins in cleaned event files. If a bin has >2000 counts, and if more than 50% of those come from <1% of pixels, then it is considered to be noise-dominated and hence unusable.
| Quadrant | # 1 sec bins | Bins with >0 counts | Bins with >2000 counts | High rate bins dominated by noise | Noise dominated (total time) | Noise dominated (detector-on time) | Marked lightcurve |
|---|---|---|---|---|---|---|---|
| A | 7801 | 6922 | 10 | 10 | 0.13% | 0.14% | 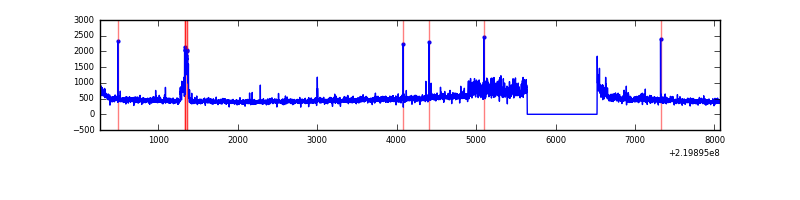 |
| B | 7801 | 6922 | 2 | 2 | 0.03% | 0.03% | 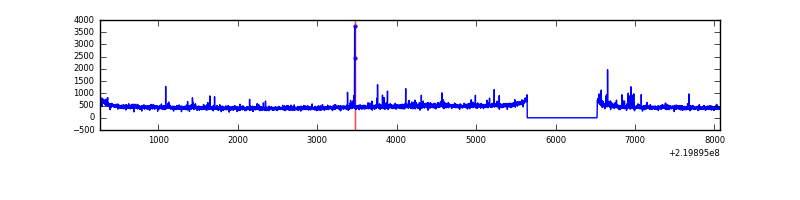 |
| C | 7801 | 6922 | 0 | 0 | 0.00% | 0.00% |  |
| D | 7801 | 6922 | 261 | 261 | 3.35% | 3.77% | 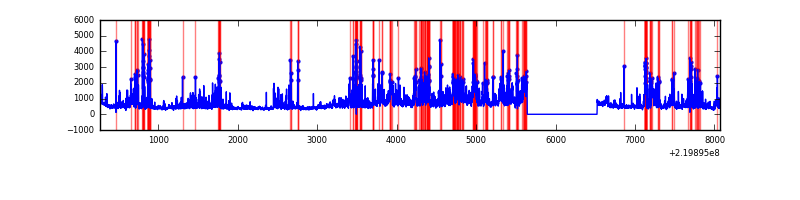 |
Top three noisy pixels from each quadrant. If the there are fewer than three noisy pixels in the level2.evt file, extra rows are filled as -1
| Pixel properties | Quadrant properties | ||||||
|---|---|---|---|---|---|---|---|
| Quadrant | DetID | PixID | Counts | Sigma | Mean | Median | Sigma |
| A | 8 | 15 | 449838 | 2901.44 | 765 | 750 | 154.8 |
| A | 15 | 239 | 103604 | 664.51 | 765 | 750 | 154.8 |
| A | 0 | 226 | 7699 | 44.9 | 765 | 750 | 154.8 |
| B | 0 | 214 | 28539 | 186.91 | 778 | 758 | 148.6 |
| B | 4 | 81 | 20285 | 131.38 | 778 | 758 | 148.6 |
| B | 0 | 228 | 15983 | 102.43 | 778 | 758 | 148.6 |
| C | 9 | 16 | 7199 | 37.85 | 741 | 742 | 170.6 |
| C | 10 | 22 | 7014 | 36.77 | 741 | 742 | 170.6 |
| C | 13 | 61 | 5944 | 30.5 | 741 | 742 | 170.6 |
| D | 2 | 152 | 1073781 | 6076.95 | 723 | 699 | 176.6 |
| D | 2 | 33 | 801439 | 4534.65 | 723 | 699 | 176.6 |
| D | 4 | 95 | 294650 | 1664.67 | 723 | 699 | 176.6 |
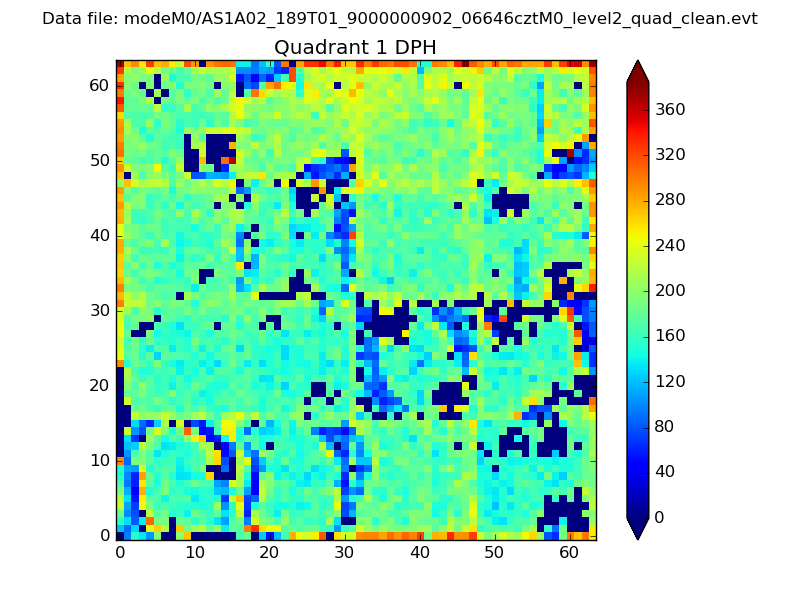
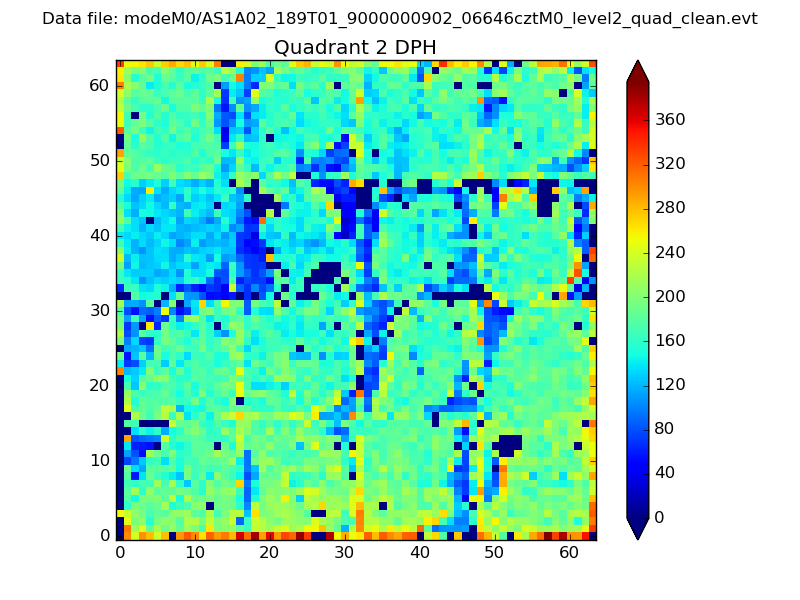
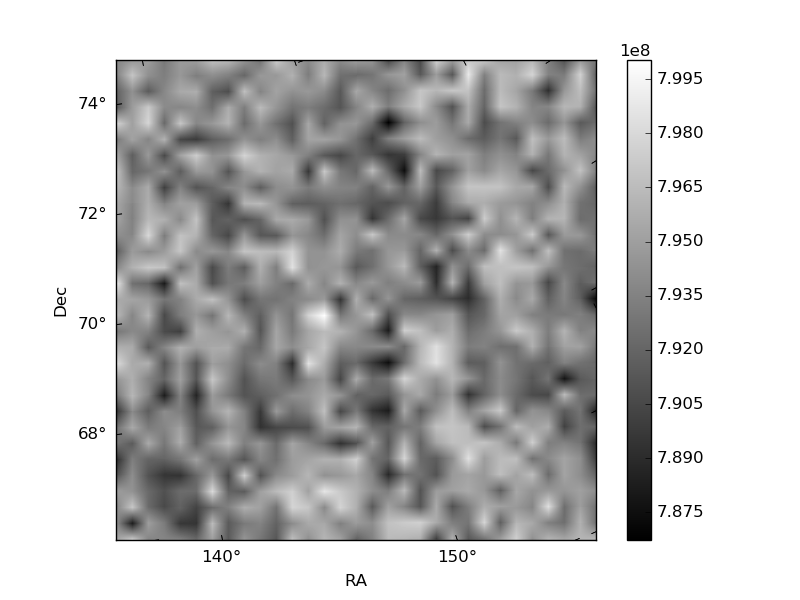
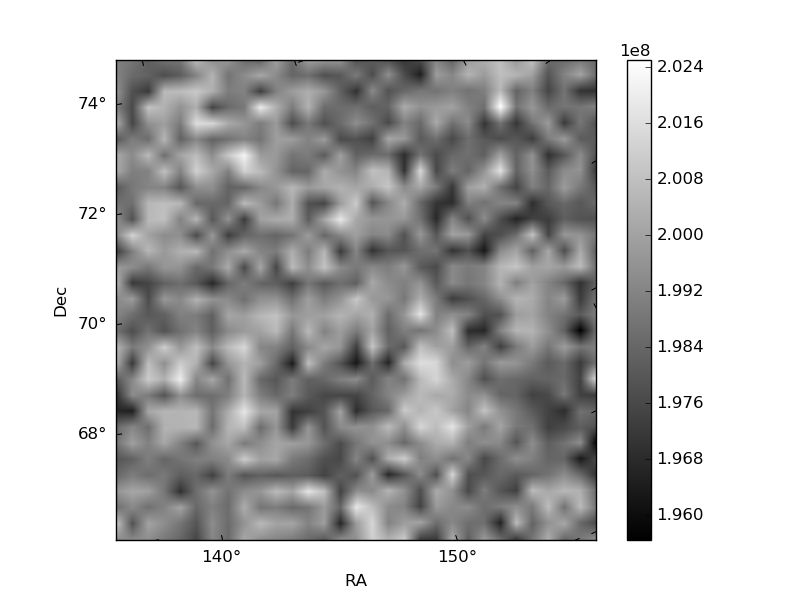
Histogram calculated using DETX and DETY for each event in the final _common_clean file
| Quadrant A | 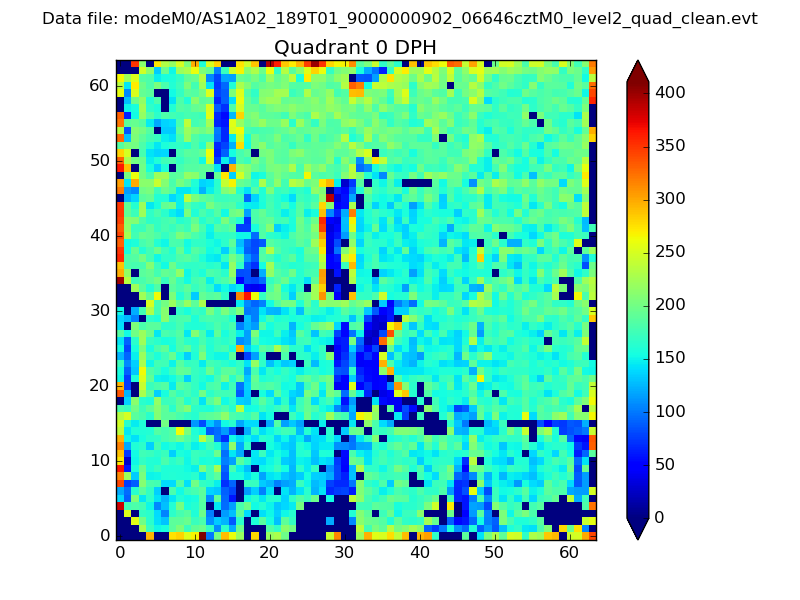 |
 |
Quadrant B |
|---|---|---|---|
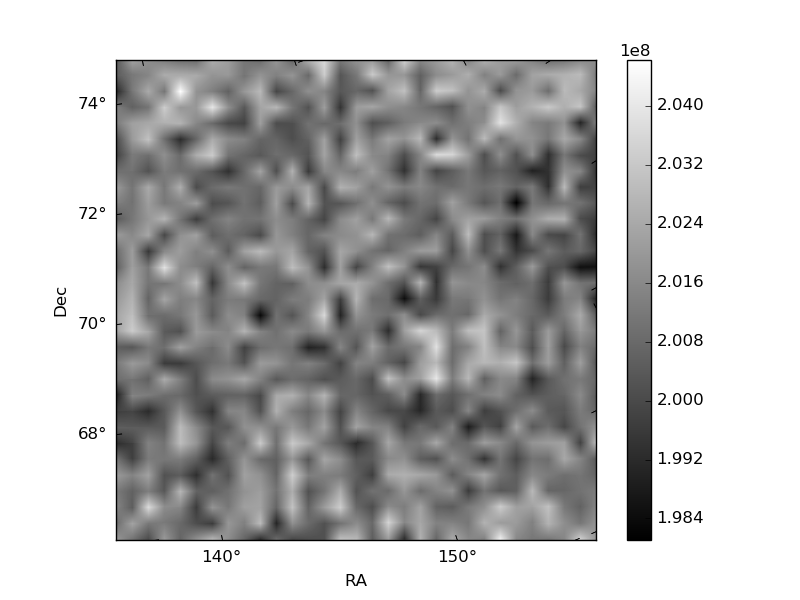
| Quadrant D | 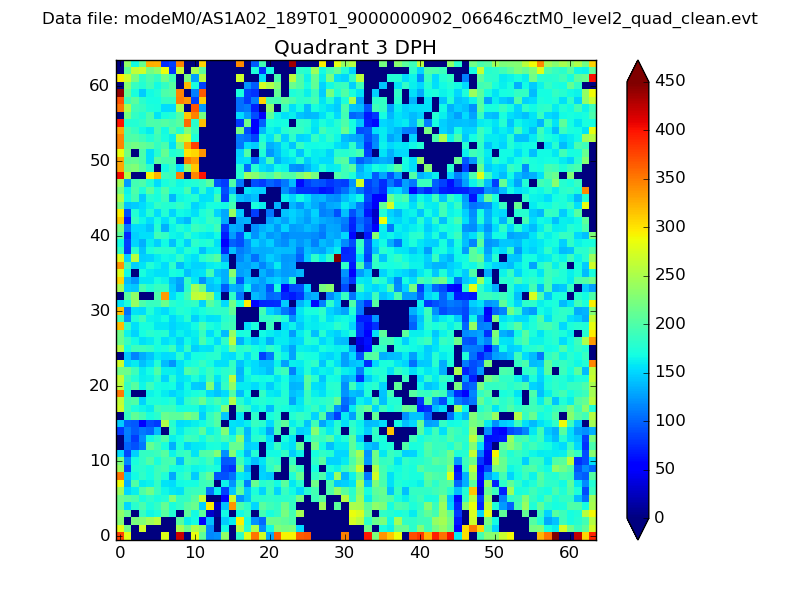 |
 |
Quadrant C |
| Plot type | Count rate plots | Images |
|---|---|---|
| Comparison with Poisson distribution Blue bars denote a histogram of data divided into 1 sec bins. Red curve is a Poisson curve with rate = median count rate of data. |
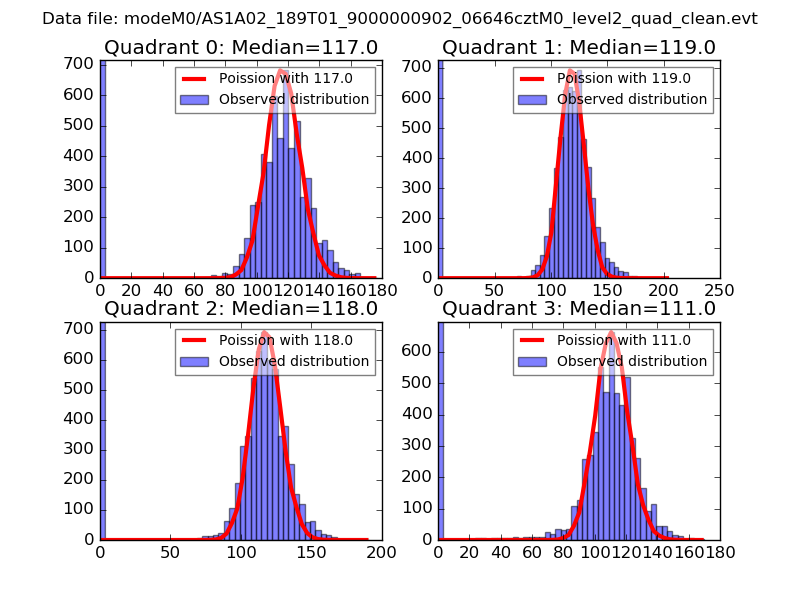 |
 |
| Quadrant-wise count rates Data is divided into 100 sec bins |
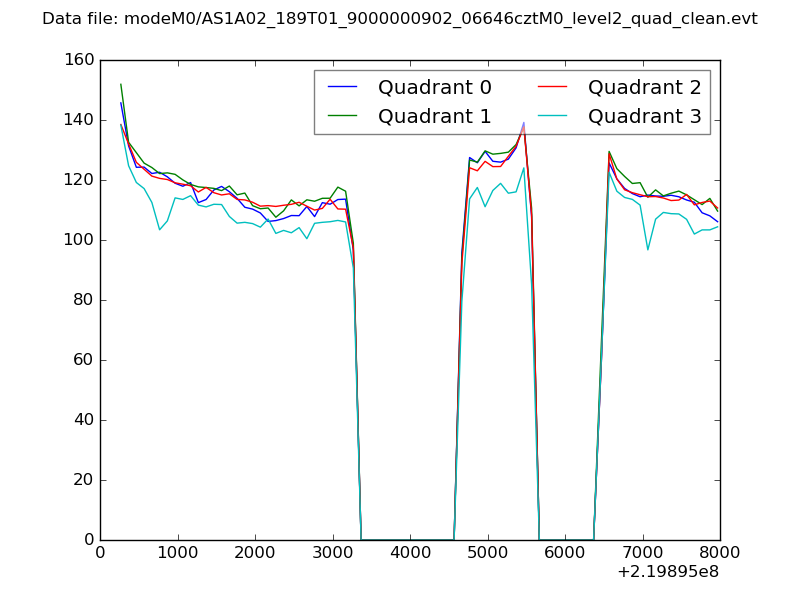 |
|
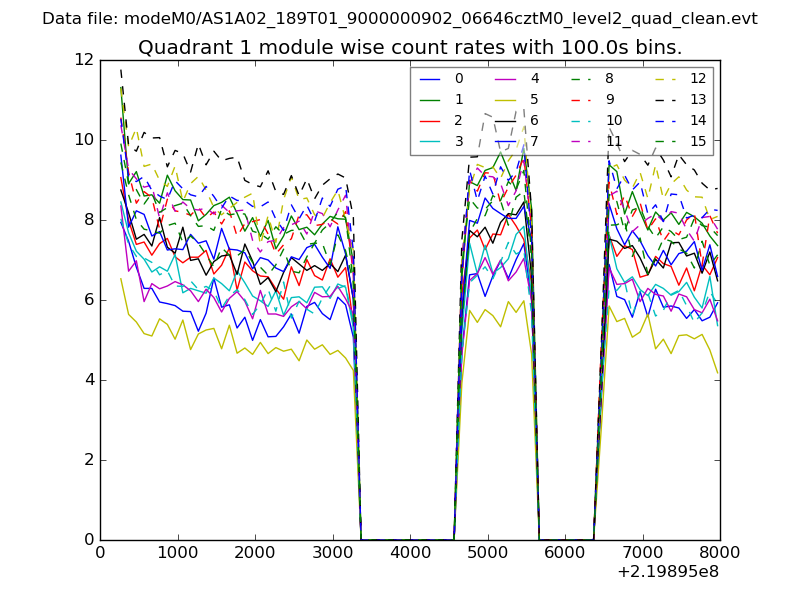
| Module-wise count rates for Quadrant A Data is divided into 100 sec bins |
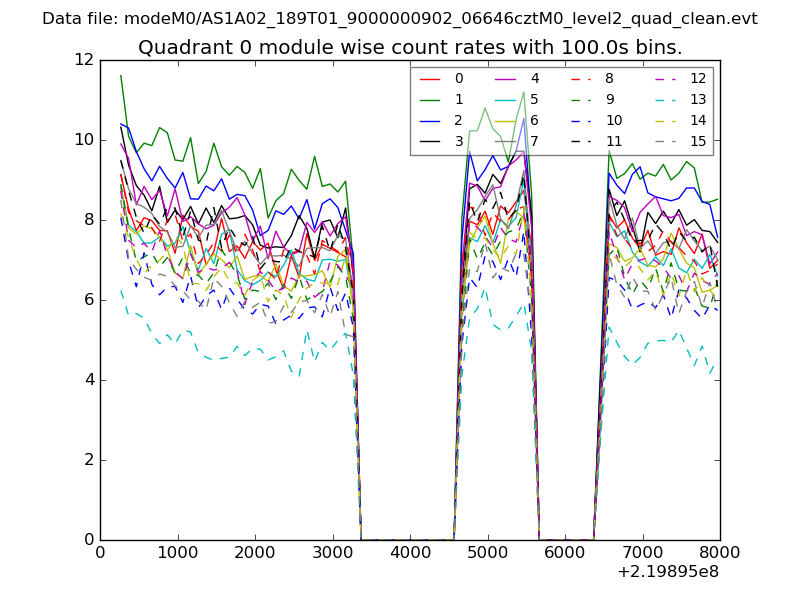 |
 |
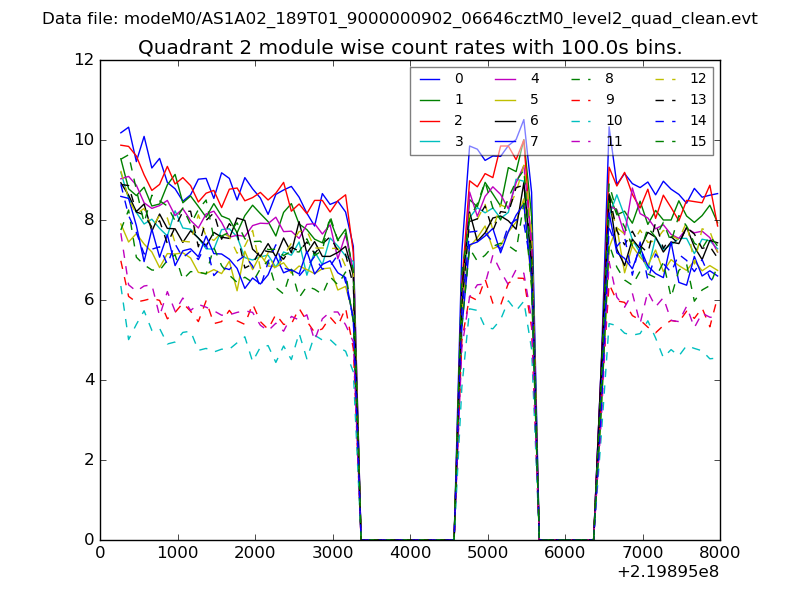
| Module-wise count rates for Quadrant B Data is divided into 100 sec bins |
 |
 |
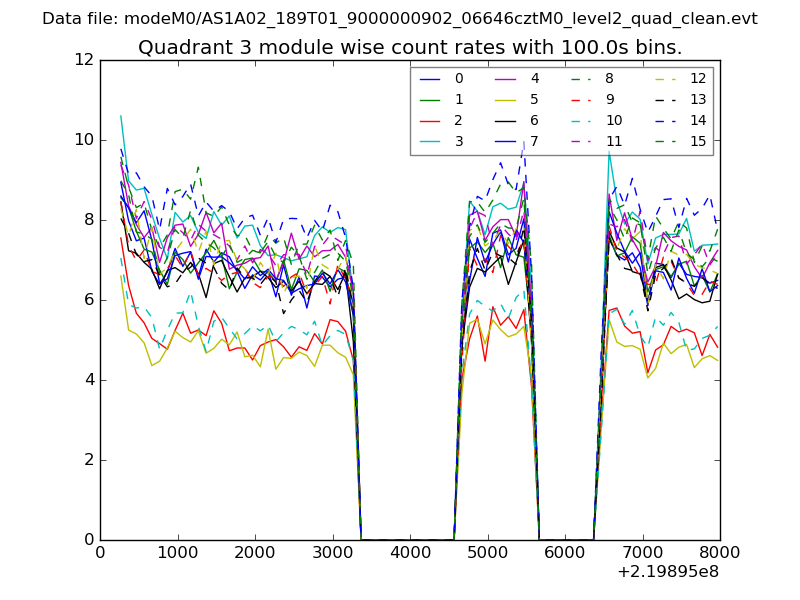
| Module-wise count rates for Quadrant C Data is divided into 100 sec bins |
 |
 |
| Module-wise count rates for Quadrant D Data is divided into 100 sec bins |
 |
 |
| Parameter | Plot |
|---|---|
| CZT HV Monitor | 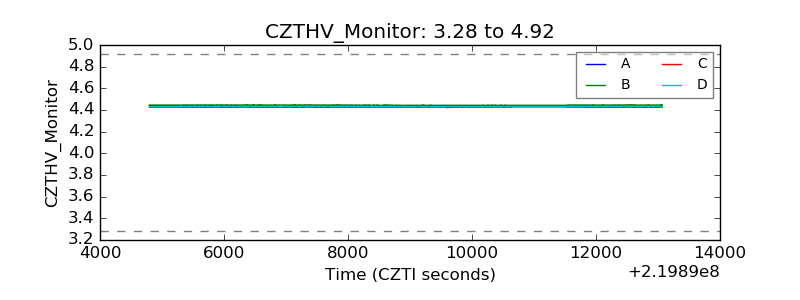 |
| D_VDD | 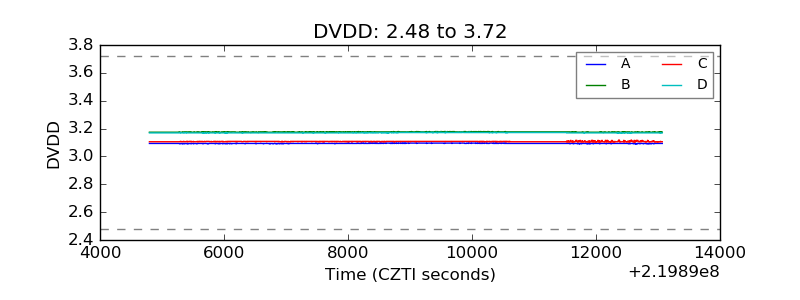 |
| Temperature 1 | 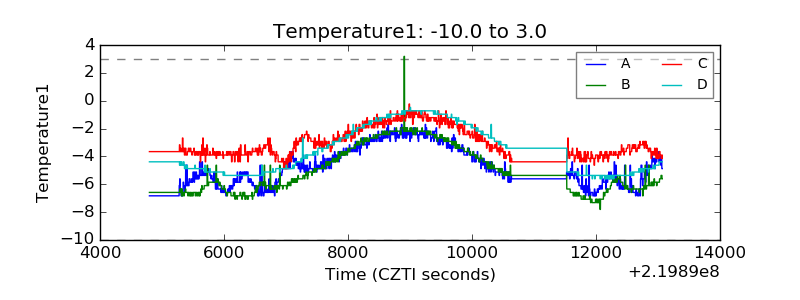 |
| Veto HV Monitor | 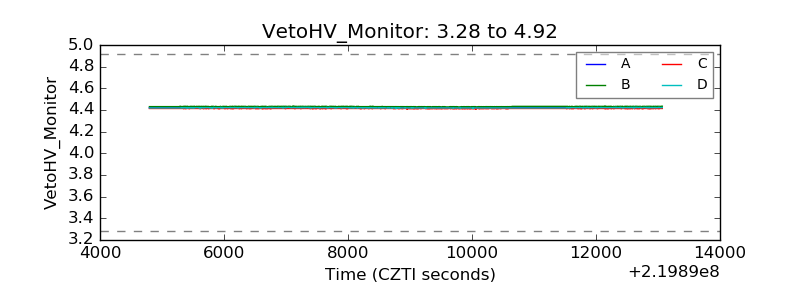 |
| Veto LLD | 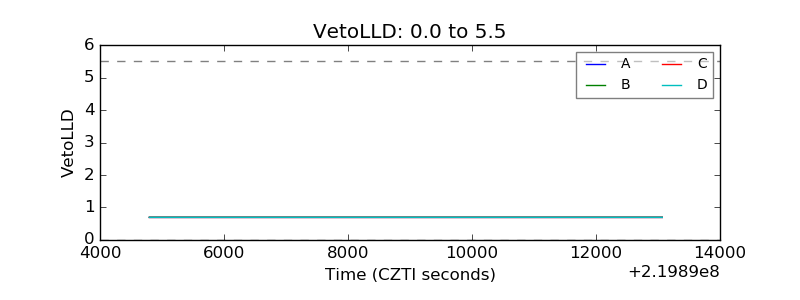 |
| Alpha Counter | 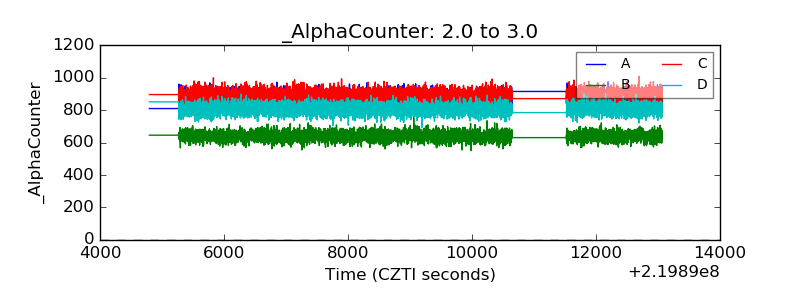 |
| _CPM_Rate | 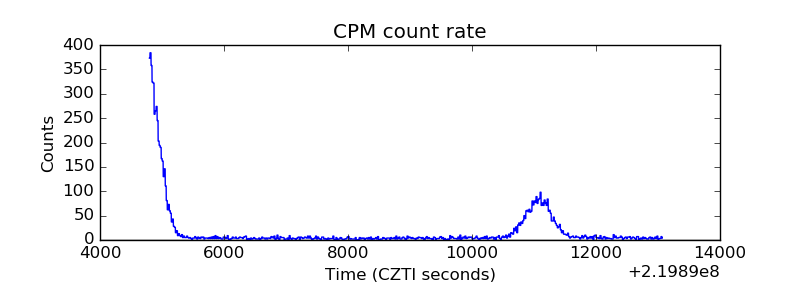 |
| CZT Counter | 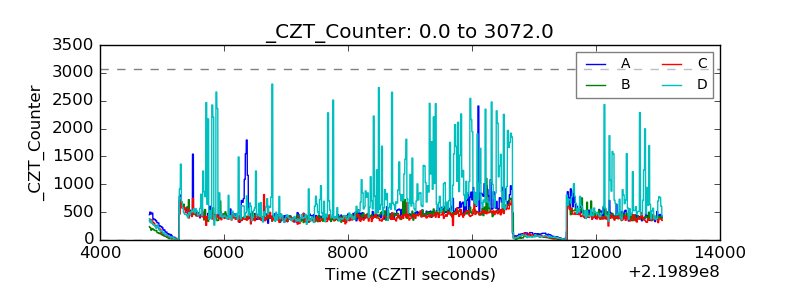 |
| +2.5 Volts monitor |  |
| +5 Volts monitor | 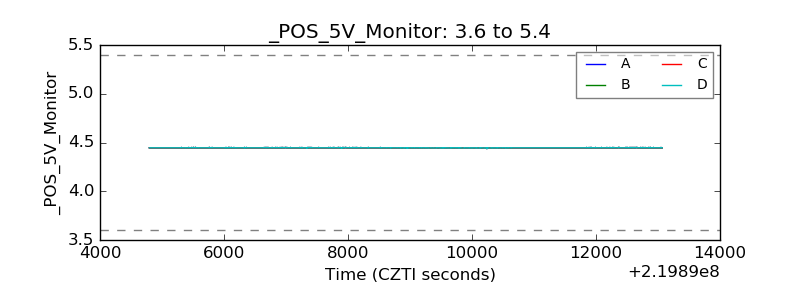 |
| _ROLL_ROT | 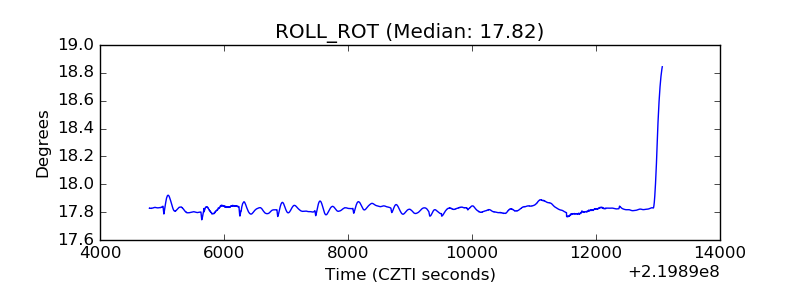 |
| _Roll_DEC | 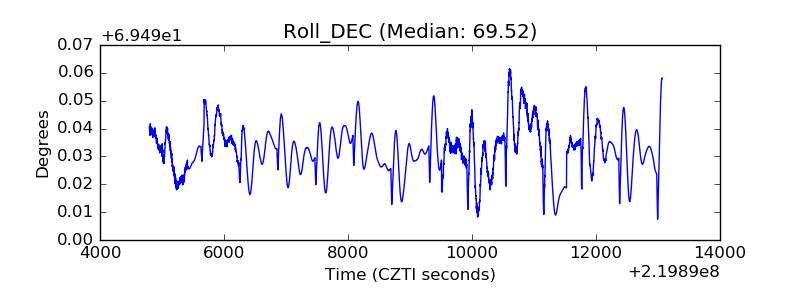 |
| _Roll_RA | 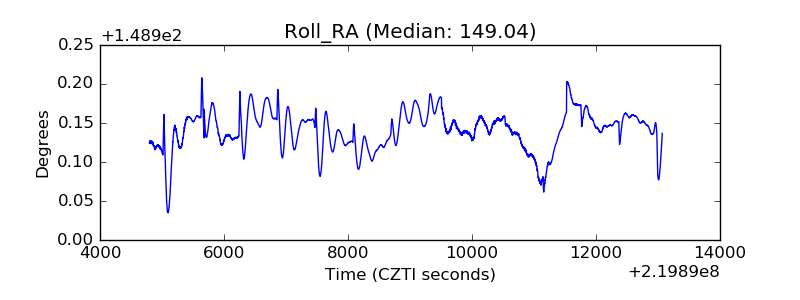 |
| Veto Counter | 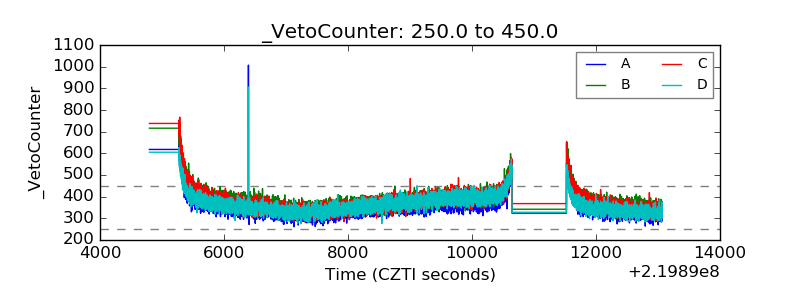 |