| Param | Original file | Final file |
|---|---|---|
| Filename | modeM0/AS1A02_189T01_9000000902_06647cztM0_level2.evt | modeM0/AS1A02_189T01_9000000902_06647cztM0_level2_quad_clean.evt |
| Size (bytes) | 534,839,040 | 110,767,680 |
| Size | 510.1 MB | 105.6 MB |
| Events in quadrant A | 3,862,574 | 714,817 |
| Events in quadrant B | 3,603,671 | 730,189 |
| Events in quadrant C | 3,214,743 | 720,969 |
| Events in quadrant D | 5,011,569 | 670,730 |
| Mode M9 | |||
|---|---|---|---|
| Quadrant | BADHDUFLAG | Total packets | Discarded packets |
| A | 0 | 12 | 0 |
| B | 0 | 12 | 0 |
| C | 0 | 12 | 0 |
| D | 0 | 12 | 0 |
| Mode M0 | |||
|---|---|---|---|
| Quadrant | BADHDUFLAG | Total packets | Discarded packets |
| A | 0 | 16879 | 448 |
| B | 0 | 16354 | 411 |
| C | 0 | 15648 | 383 |
| D | 0 | 21180 | 964 |
| Mode SS | |||
|---|---|---|---|
| Quadrant | BADHDUFLAG | Total packets | Discarded packets |
| A | 0 | 156 | 2 |
| B | 0 | 156 | 2 |
| C | 0 | 156 | 8 |
| D | 0 | 156 | 6 |
| Quadrant | Total seconds | Saturated seconds | Saturation percentage |
|---|---|---|---|
| A | 7453 | 113 | 1.516168% |
| B | 7452 | 92 | 1.234568% |
| C | 7466 | 41 | 0.549156% |
| D | 7402 | 278 | 3.755742% |
Noise dominated data is calculated using 1-second bins in cleaned event files. If a bin has >2000 counts, and if more than 50% of those come from <1% of pixels, then it is considered to be noise-dominated and hence unusable.
| Quadrant | # 1 sec bins | Bins with >0 counts | Bins with >2000 counts | High rate bins dominated by noise | Noise dominated (total time) | Noise dominated (detector-on time) | Marked lightcurve |
|---|---|---|---|---|---|---|---|
| A | 8882 | 7578 | 2 | 2 | 0.02% | 0.03% | 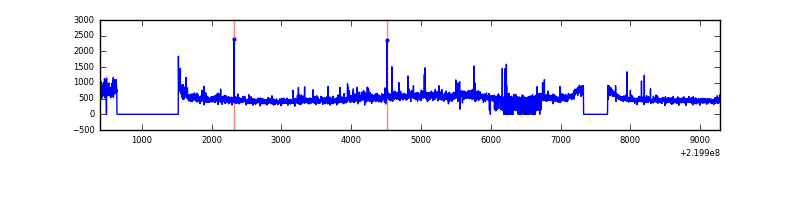 |
| B | 8882 | 7567 | 2 | 2 | 0.02% | 0.03% | 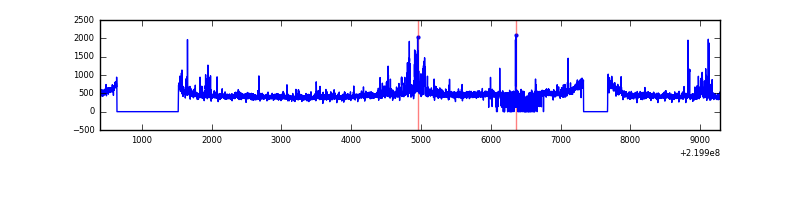 |
| C | 8882 | 7593 | 0 | 0 | 0.00% | 0.00% | 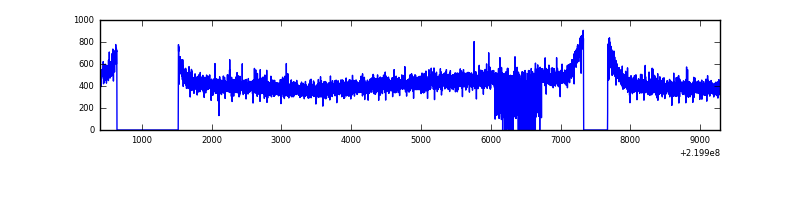 |
| D | 8882 | 7527 | 151 | 151 | 1.70% | 2.01% | 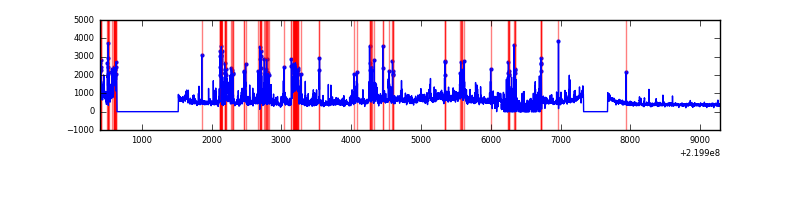 |
Top three noisy pixels from each quadrant. If the there are fewer than three noisy pixels in the level2.evt file, extra rows are filled as -1
| Pixel properties | Quadrant properties | ||||||
|---|---|---|---|---|---|---|---|
| Quadrant | DetID | PixID | Counts | Sigma | Mean | Median | Sigma |
| A | 8 | 15 | 567213 | 3283.9 | 842 | 822 | 172.5 |
| A | 15 | 239 | 30706 | 173.27 | 842 | 822 | 172.5 |
| A | 0 | 226 | 8551 | 44.81 | 842 | 822 | 172.5 |
| B | 0 | 228 | 95995 | 585.39 | 851 | 828 | 162.6 |
| B | 4 | 80 | 67864 | 412.35 | 851 | 828 | 162.6 |
| B | 4 | 81 | 47472 | 286.91 | 851 | 828 | 162.6 |
| C | 8 | 128 | 14711 | 73.87 | 815 | 816 | 188.1 |
| C | 8 | 112 | 7164 | 33.75 | 815 | 816 | 188.1 |
| C | 13 | 61 | 6570 | 30.59 | 815 | 816 | 188.1 |
| D | 2 | 33 | 727187 | 3705.42 | 797 | 768 | 196.0 |
| D | 8 | 195 | 610129 | 3108.31 | 797 | 768 | 196.0 |
| D | 2 | 152 | 316587 | 1610.97 | 797 | 768 | 196.0 |
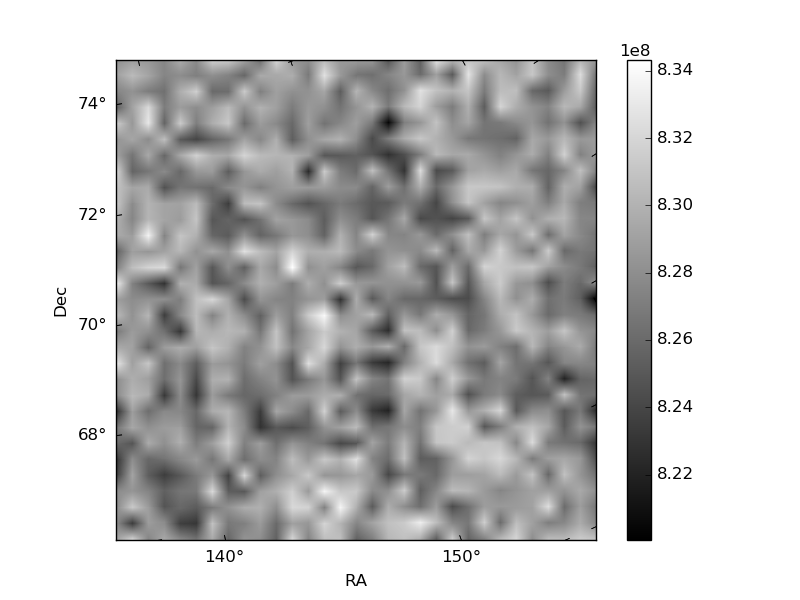
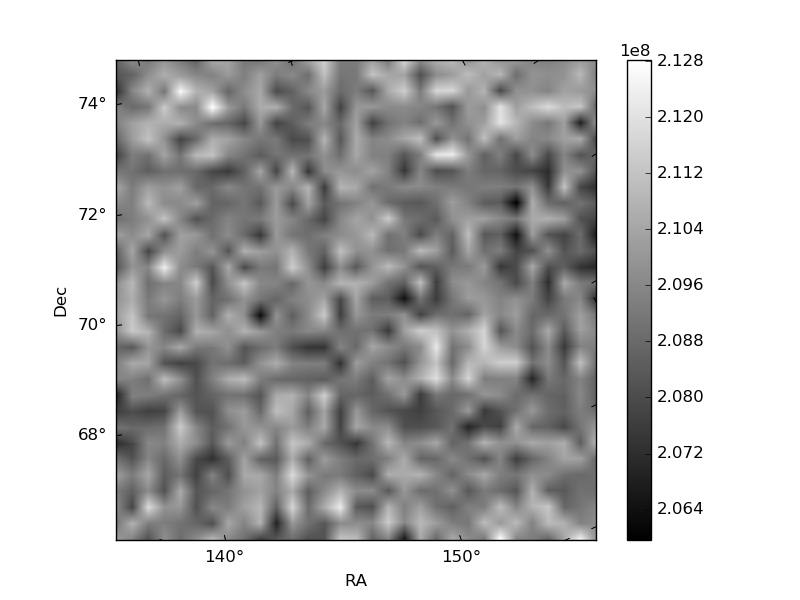
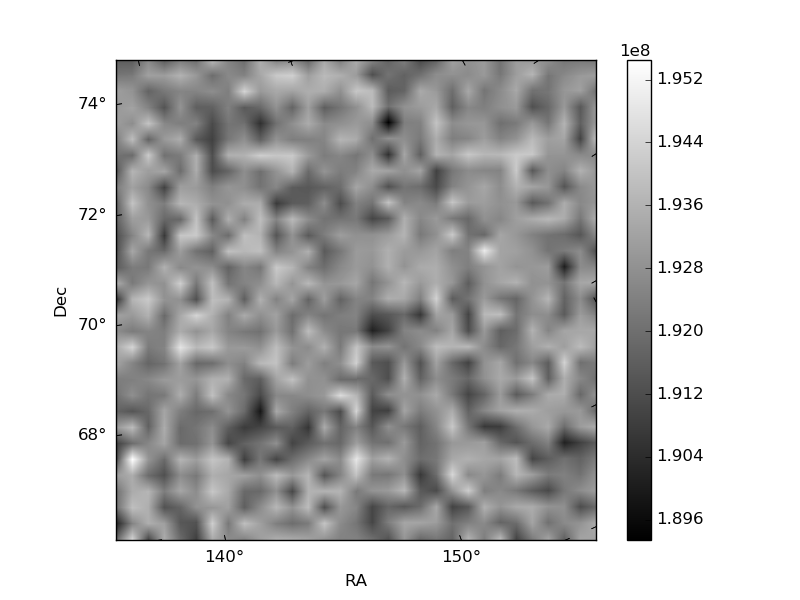
Histogram calculated using DETX and DETY for each event in the final _common_clean file
| Quadrant A | 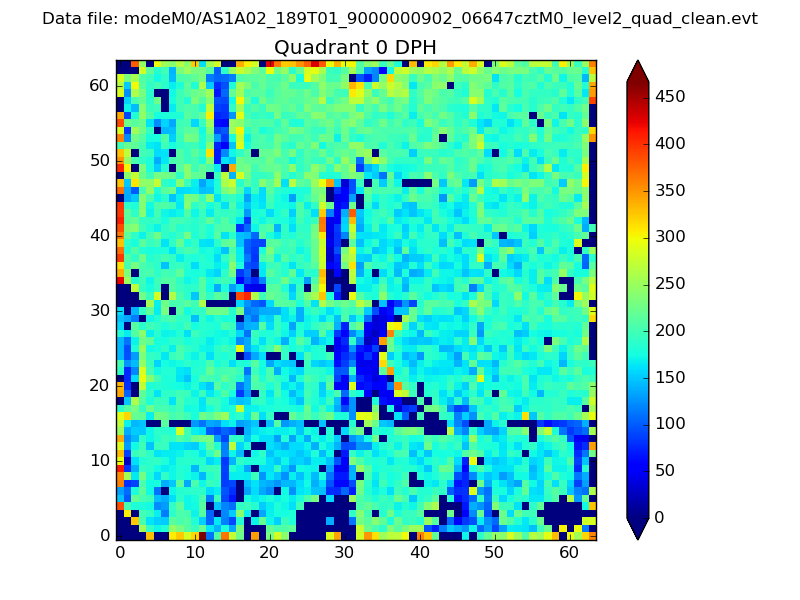 |
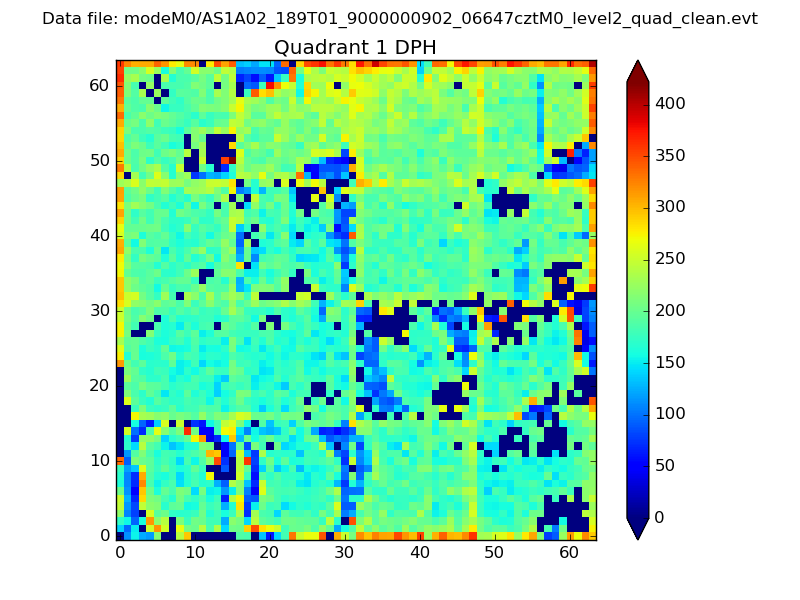 |
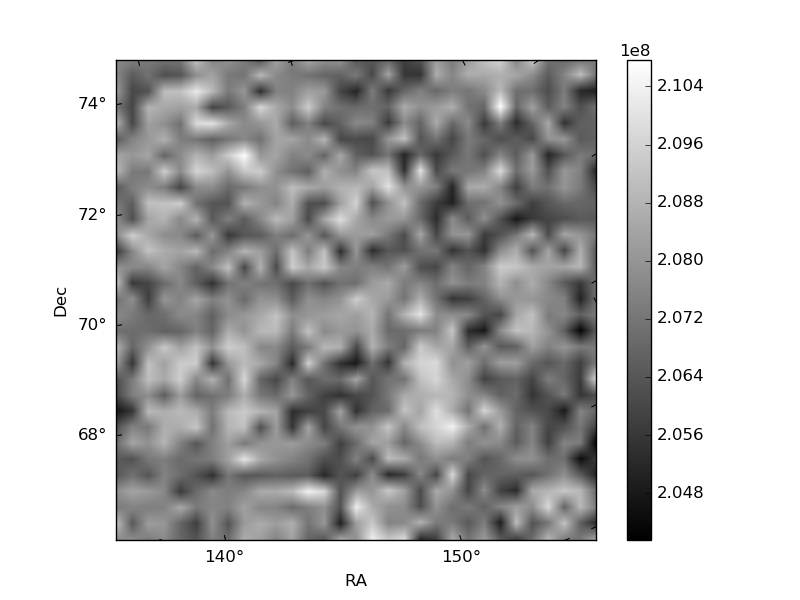
Quadrant B |
|---|---|---|---|
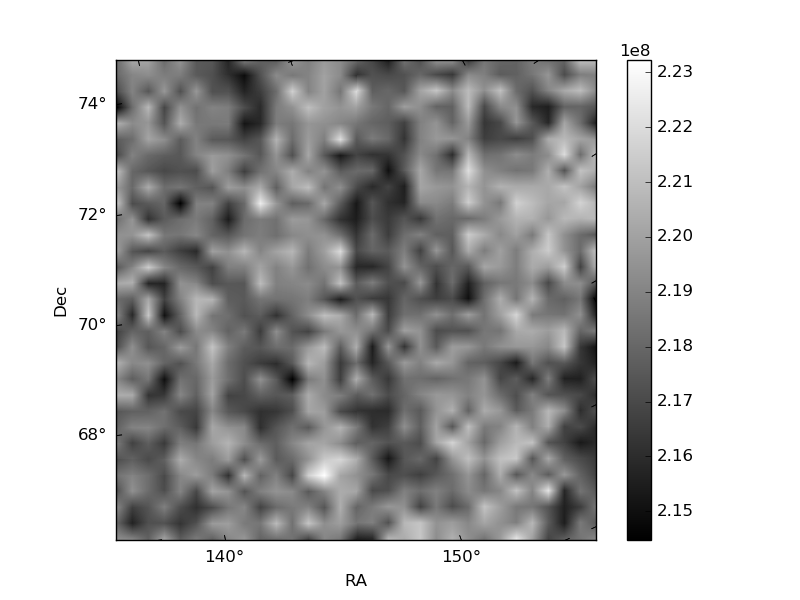
| Quadrant D | 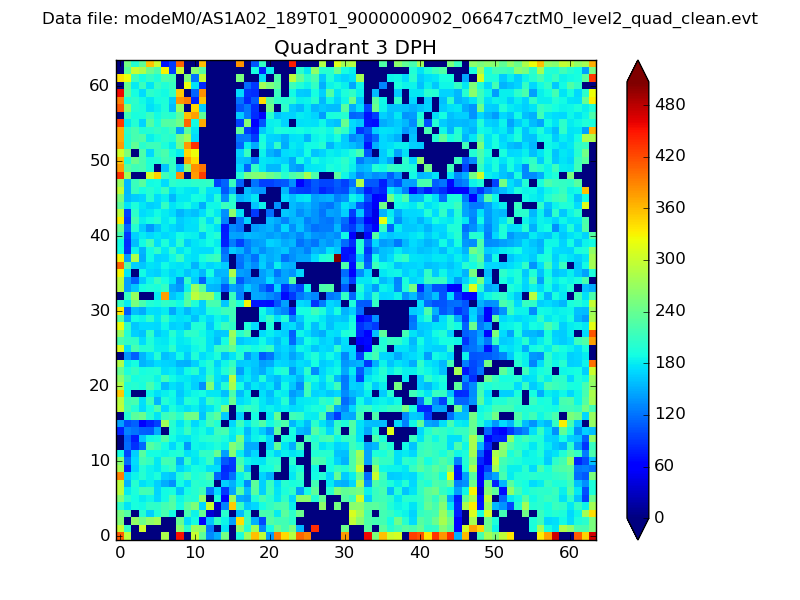 |
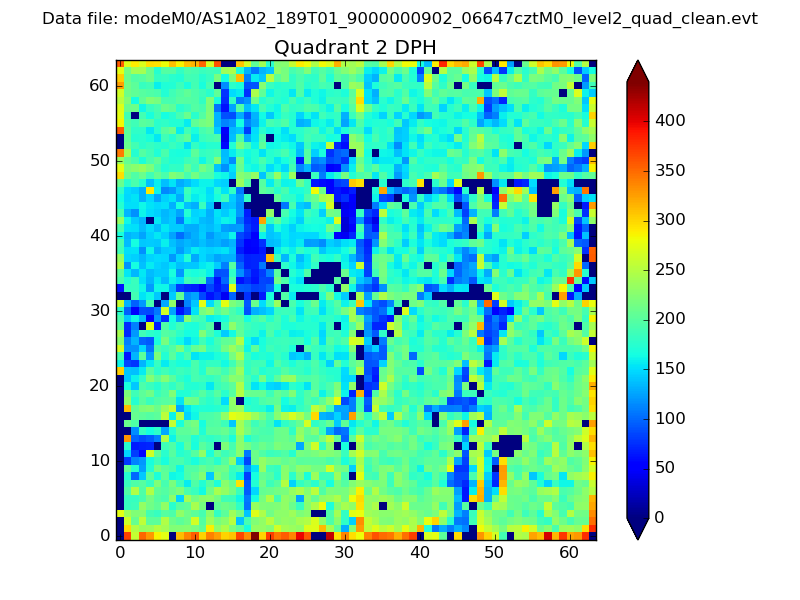 |
Quadrant C |
| Plot type | Count rate plots | Images |
|---|---|---|
| Comparison with Poisson distribution Blue bars denote a histogram of data divided into 1 sec bins. Red curve is a Poisson curve with rate = median count rate of data. |
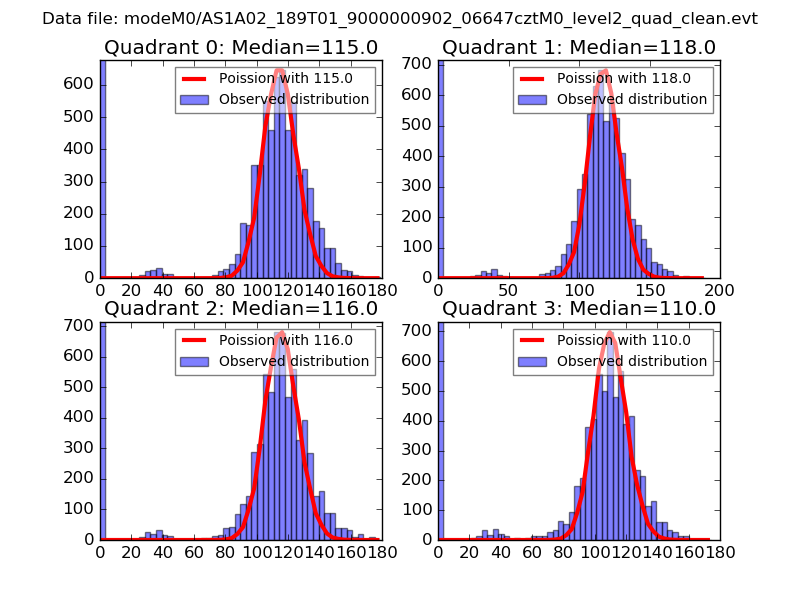 |
 |
| Quadrant-wise count rates Data is divided into 100 sec bins |
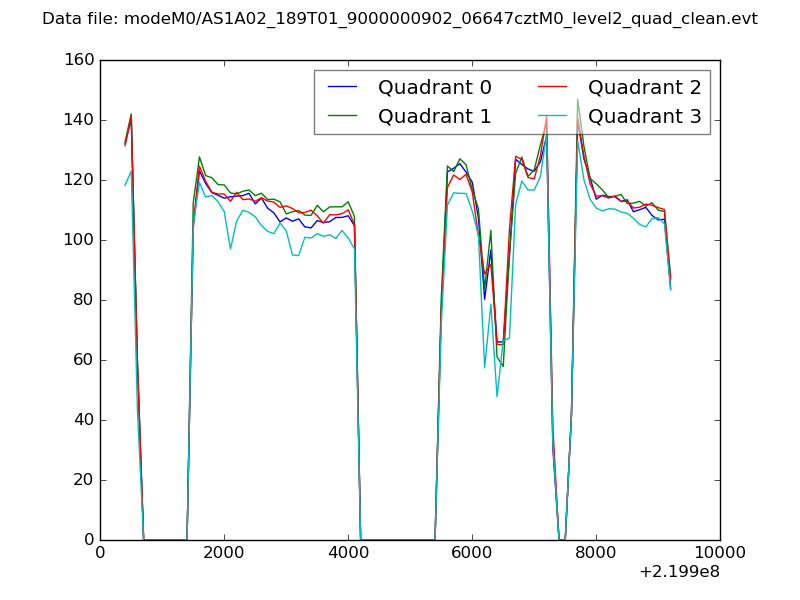 |
|
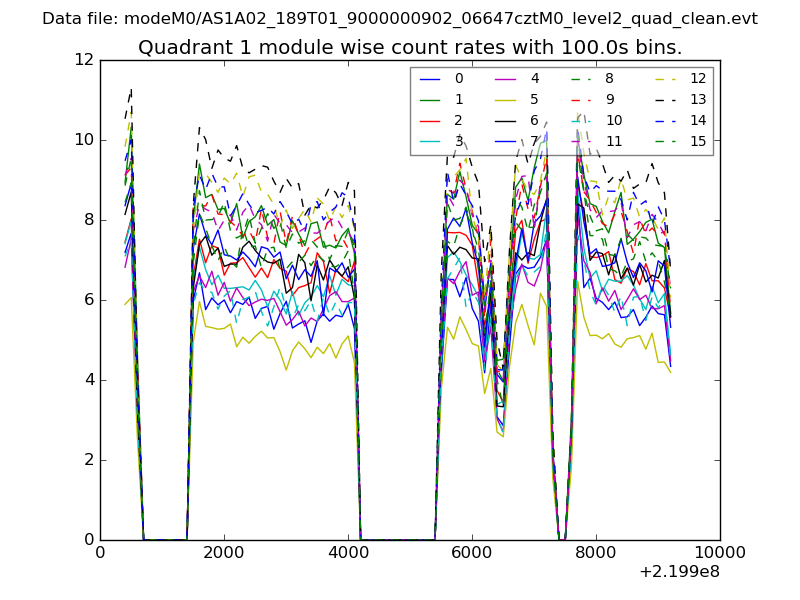
| Module-wise count rates for Quadrant A Data is divided into 100 sec bins |
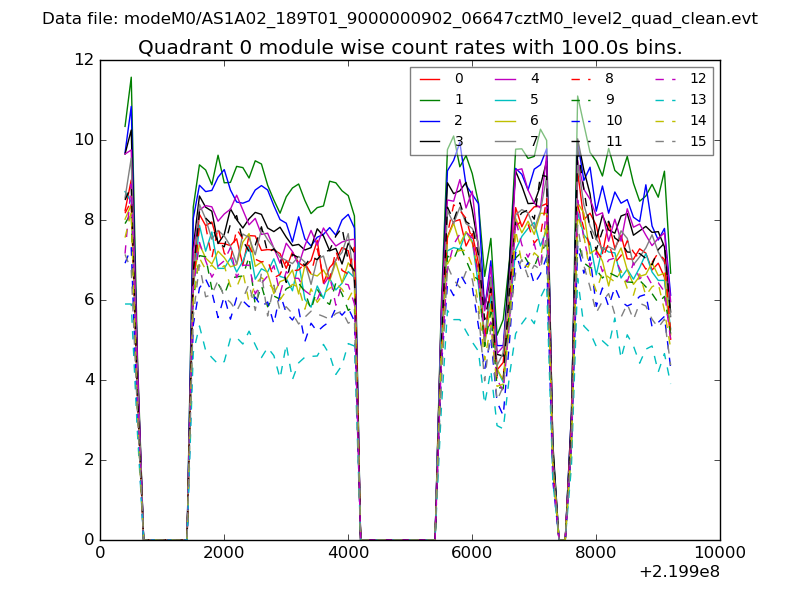 |
 |
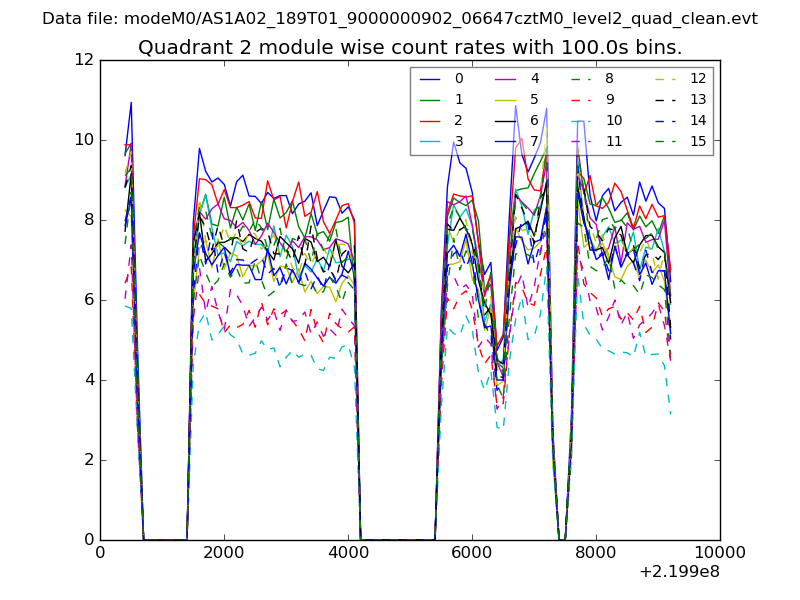
| Module-wise count rates for Quadrant B Data is divided into 100 sec bins |
 |
 |
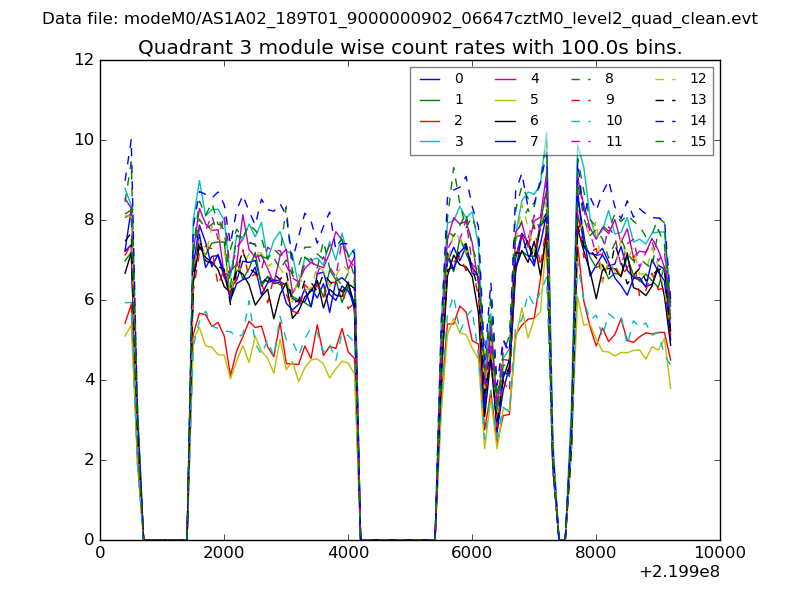
| Module-wise count rates for Quadrant C Data is divided into 100 sec bins |
 |
 |
| Module-wise count rates for Quadrant D Data is divided into 100 sec bins |
 |
 |
| Parameter | Plot |
|---|---|
| CZT HV Monitor | 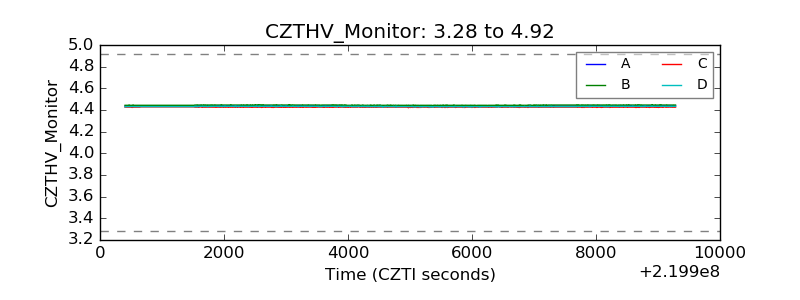 |
| D_VDD | 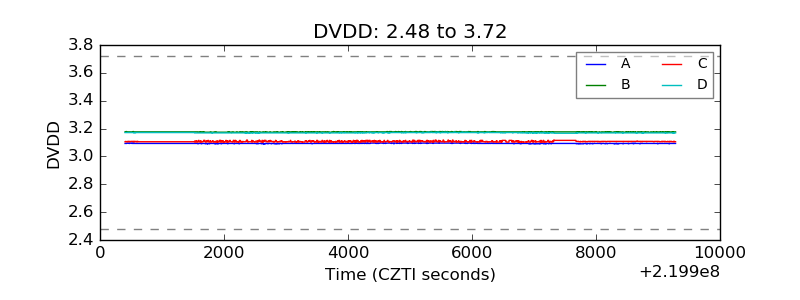 |
| Temperature 1 | 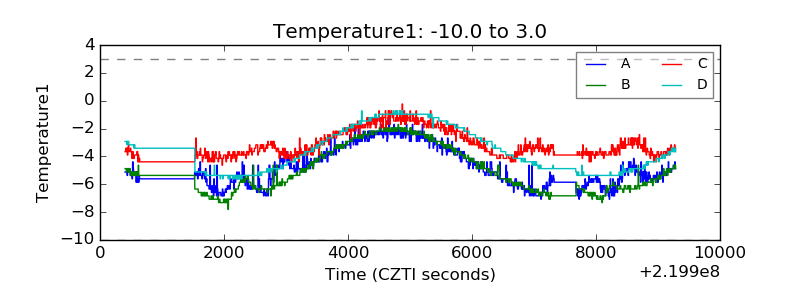 |
| Veto HV Monitor | 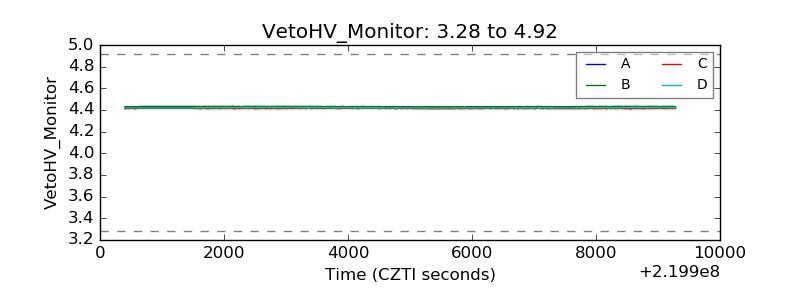 |
| Veto LLD | 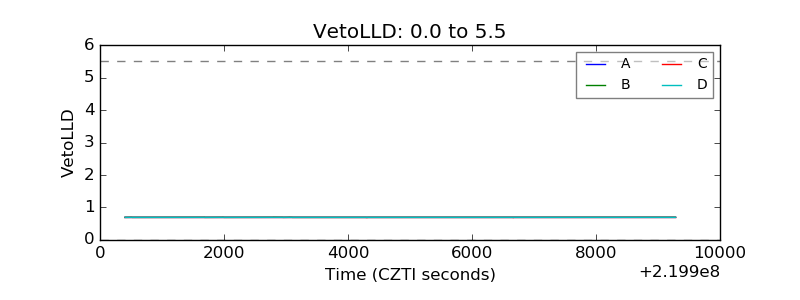 |
| Alpha Counter | 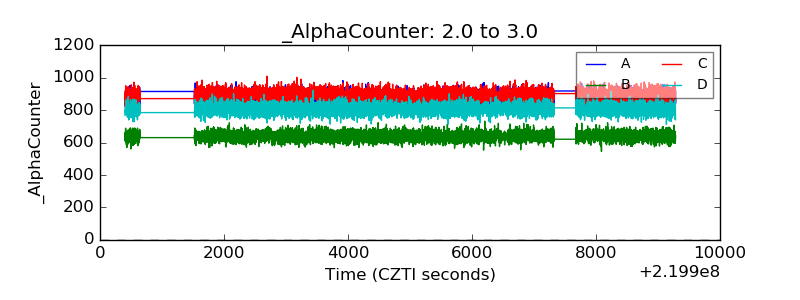 |
| _CPM_Rate | 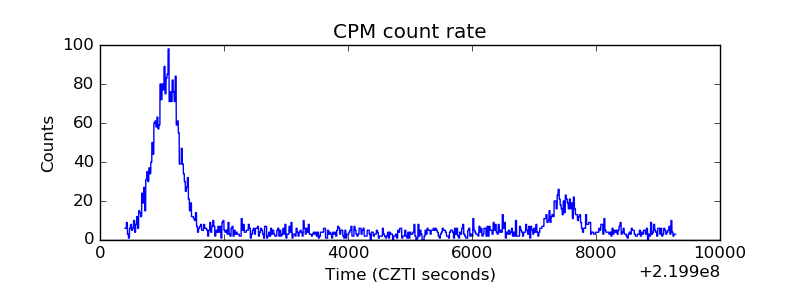 |
| CZT Counter | 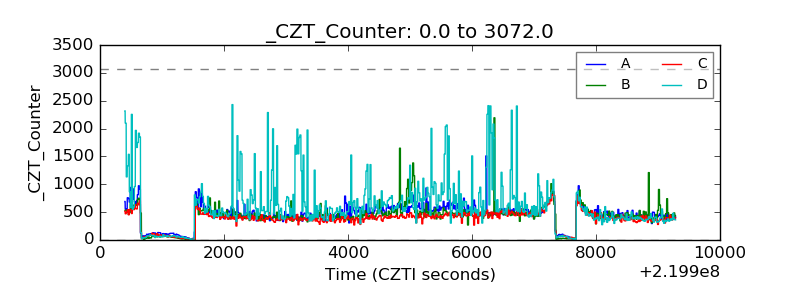 |
| +2.5 Volts monitor | 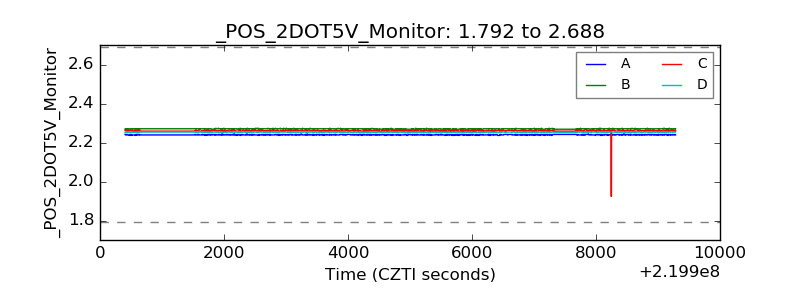 |
| +5 Volts monitor | 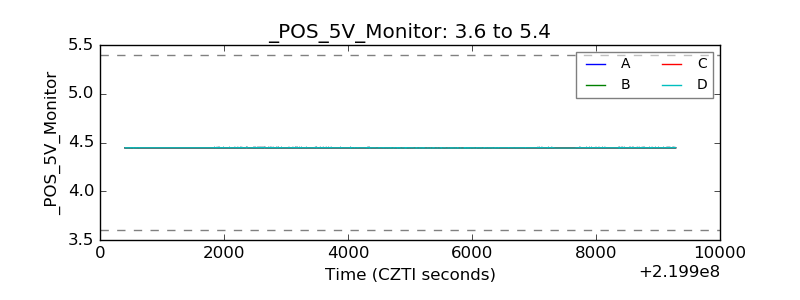 |
| _ROLL_ROT | 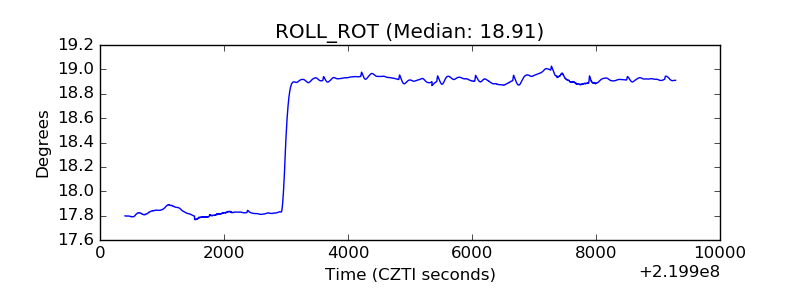 |
| _Roll_DEC | 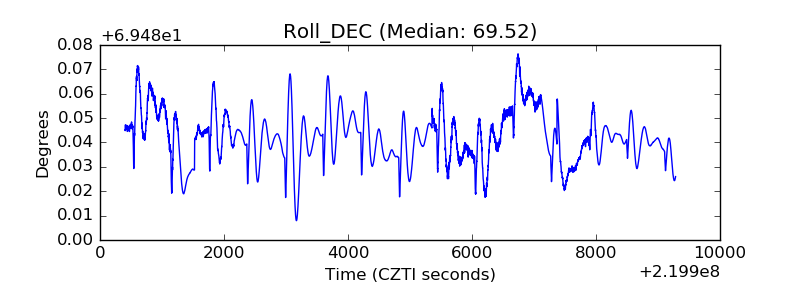 |
| _Roll_RA | 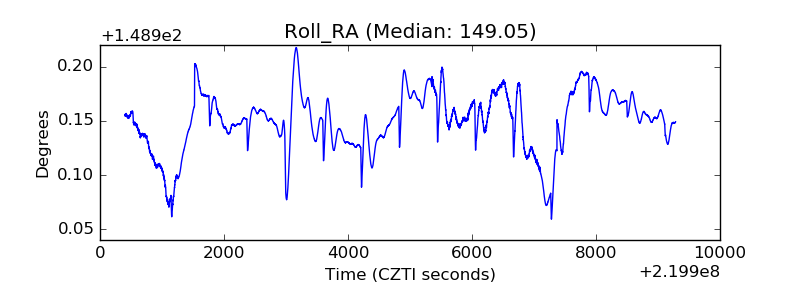 |
| Veto Counter | 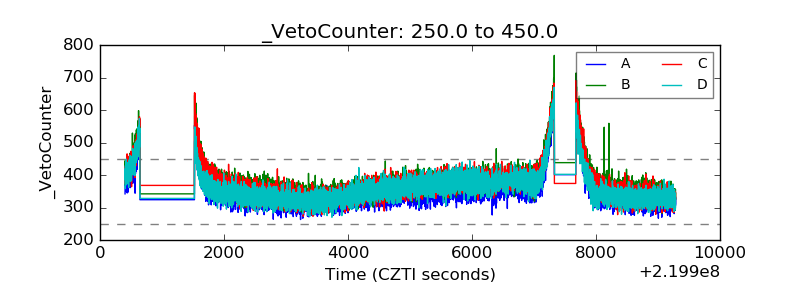 |