| Param | Original file | Final file |
|---|---|---|
| Filename | modeM0/AS1A02_189T01_9000000902_06648cztM0_level2.evt | modeM0/AS1A02_189T01_9000000902_06648cztM0_level2_quad_clean.evt |
| Size (bytes) | 478,255,680 | 95,656,320 |
| Size | 456.1 MB | 91.2 MB |
| Events in quadrant A | 3,369,196 | 612,121 |
| Events in quadrant B | 3,117,294 | 626,933 |
| Events in quadrant C | 2,840,379 | 618,468 |
| Events in quadrant D | 4,705,402 | 575,953 |
| Mode M9 | |||
|---|---|---|---|
| Quadrant | BADHDUFLAG | Total packets | Discarded packets |
| A | 0 | 1 | 0 |
| B | 0 | 1 | 0 |
| C | 0 | 1 | 0 |
| D | 0 | 1 | 0 |
| Mode M0 | |||
|---|---|---|---|
| Quadrant | BADHDUFLAG | Total packets | Discarded packets |
| A | 0 | 14153 | 1 |
| B | 0 | 13888 | 1 |
| C | 0 | 13561 | 1 |
| D | 0 | 18942 | 1 |
| Mode SS | |||
|---|---|---|---|
| Quadrant | BADHDUFLAG | Total packets | Discarded packets |
| A | 0 | 134 | 0 |
| B | 0 | 134 | 0 |
| C | 0 | 134 | 0 |
| D | 0 | 134 | 0 |
| Quadrant | Total seconds | Saturated seconds | Saturation percentage |
|---|---|---|---|
| A | 6646 | 212 | 3.189889% |
| B | 6646 | 155 | 2.332230% |
| C | 6646 | 69 | 1.038218% |
| D | 6646 | 619 | 9.313873% |
Noise dominated data is calculated using 1-second bins in cleaned event files. If a bin has >2000 counts, and if more than 50% of those come from <1% of pixels, then it is considered to be noise-dominated and hence unusable.
| Quadrant | # 1 sec bins | Bins with >0 counts | Bins with >2000 counts | High rate bins dominated by noise | Noise dominated (total time) | Noise dominated (detector-on time) | Marked lightcurve |
|---|---|---|---|---|---|---|---|
| A | 6736 | 6649 | 0 | 0 | 0.00% | 0.00% | 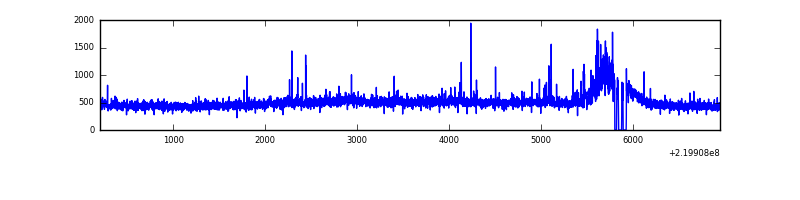 |
| B | 6736 | 6649 | 1 | 1 | 0.01% | 0.02% | 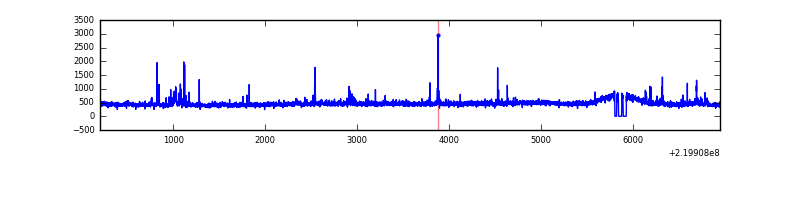 |
| C | 6736 | 6649 | 0 | 0 | 0.00% | 0.00% |  |
| D | 6736 | 6649 | 416 | 416 | 6.18% | 6.26% |  |
Top three noisy pixels from each quadrant. If the there are fewer than three noisy pixels in the level2.evt file, extra rows are filled as -1
| Pixel properties | Quadrant properties | ||||||
|---|---|---|---|---|---|---|---|
| Quadrant | DetID | PixID | Counts | Sigma | Mean | Median | Sigma |
| A | 8 | 15 | 340786 | 2211.78 | 748 | 732 | 153.7 |
| A | 15 | 239 | 120269 | 777.49 | 748 | 732 | 153.7 |
| A | 13 | 248 | 18622 | 116.36 | 748 | 732 | 153.7 |
| B | 4 | 81 | 54517 | 371.63 | 758 | 741 | 144.7 |
| B | 4 | 80 | 40922 | 277.68 | 758 | 741 | 144.7 |
| B | 0 | 198 | 33492 | 226.33 | 758 | 741 | 144.7 |
| C | 13 | 61 | 5819 | 30.33 | 725 | 727 | 167.9 |
| C | 7 | 159 | 3754 | 18.03 | 725 | 727 | 167.9 |
| C | 8 | 128 | 3587 | 17.04 | 725 | 727 | 167.9 |
| D | 2 | 33 | 1687344 | 9656.11 | 703 | 676 | 174.7 |
| D | 8 | 195 | 100381 | 570.81 | 703 | 676 | 174.7 |
| D | 2 | 63 | 71605 | 406.07 | 703 | 676 | 174.7 |
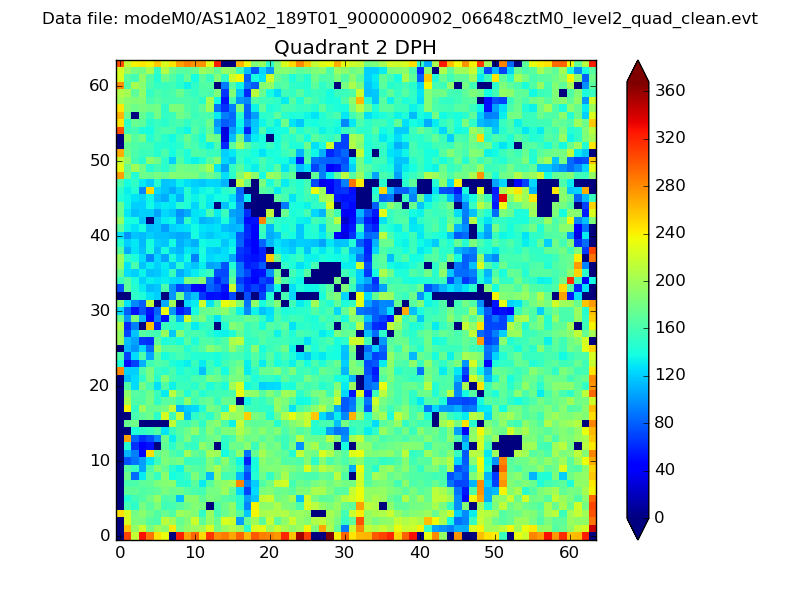
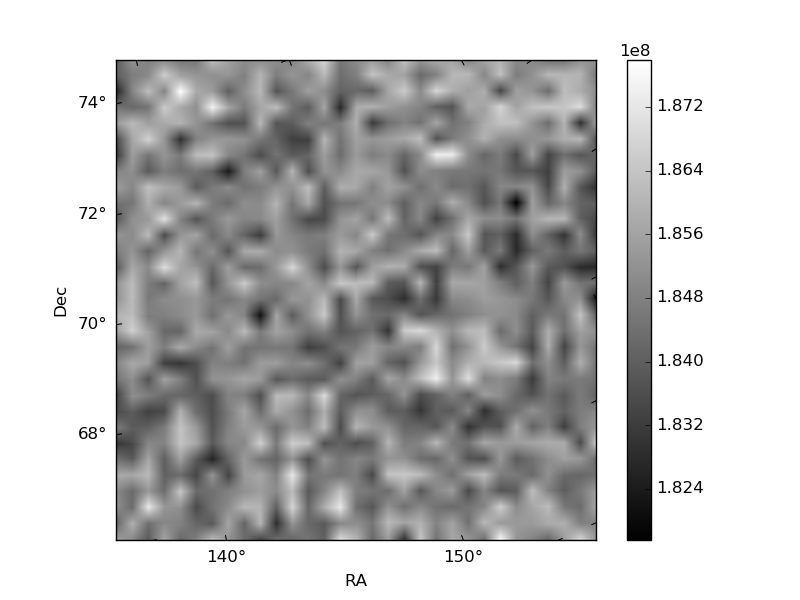
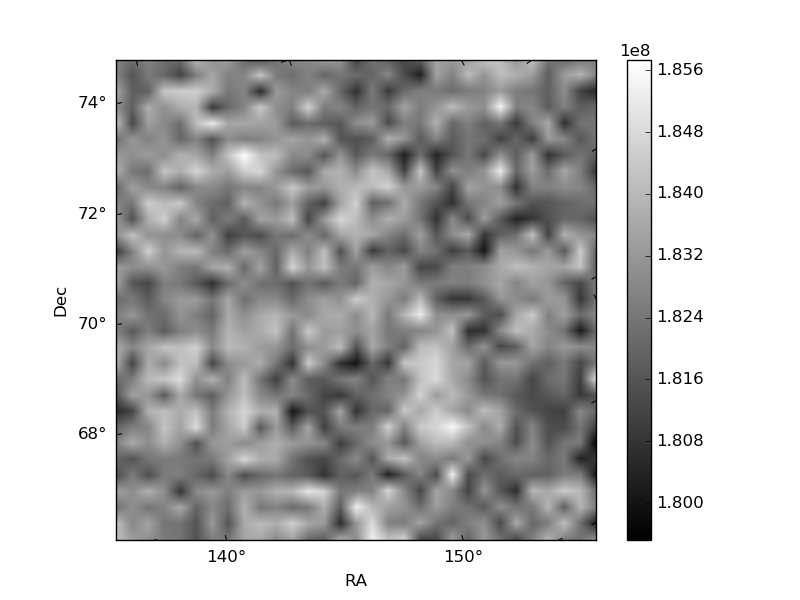
Histogram calculated using DETX and DETY for each event in the final _common_clean file
| Quadrant A | 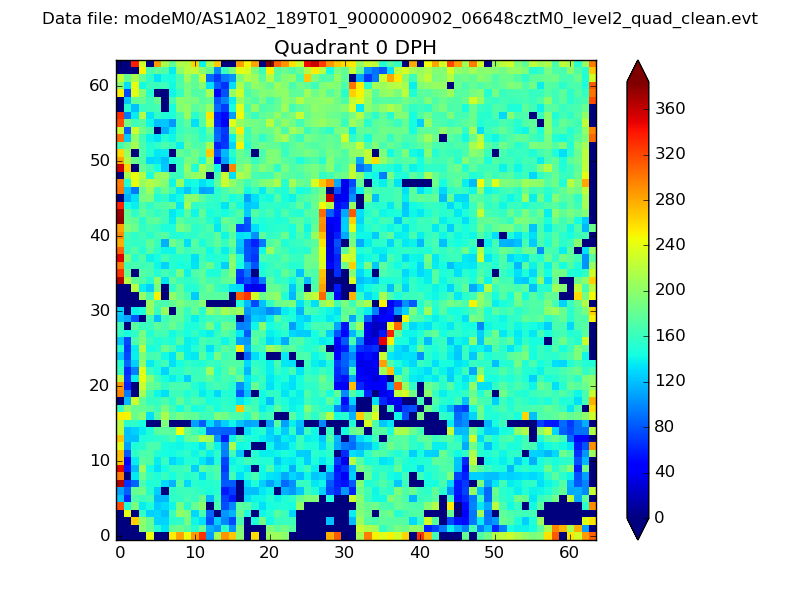 |
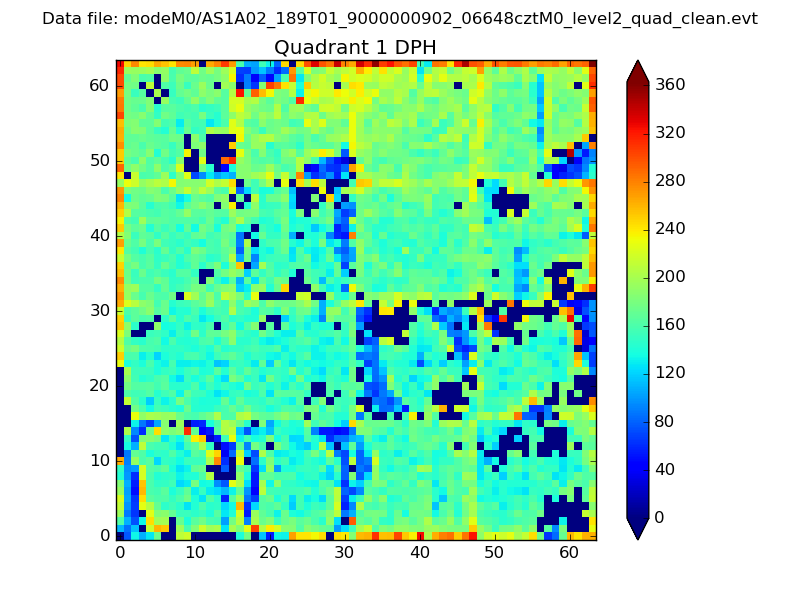 |
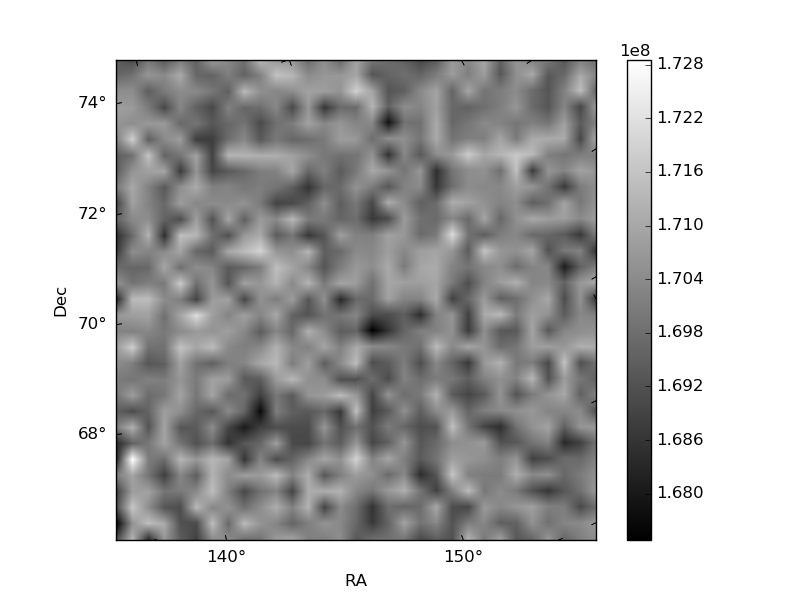
Quadrant B |
|---|---|---|---|
| Quadrant D | 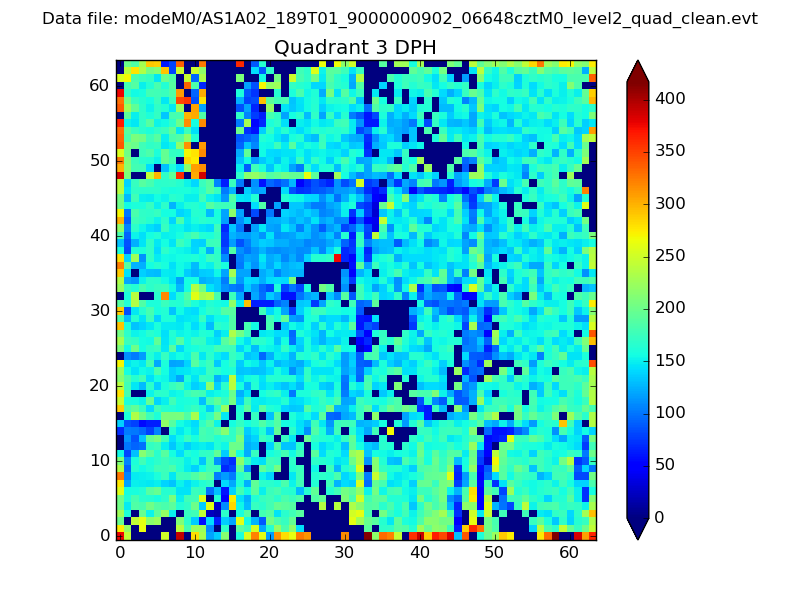 |
 |
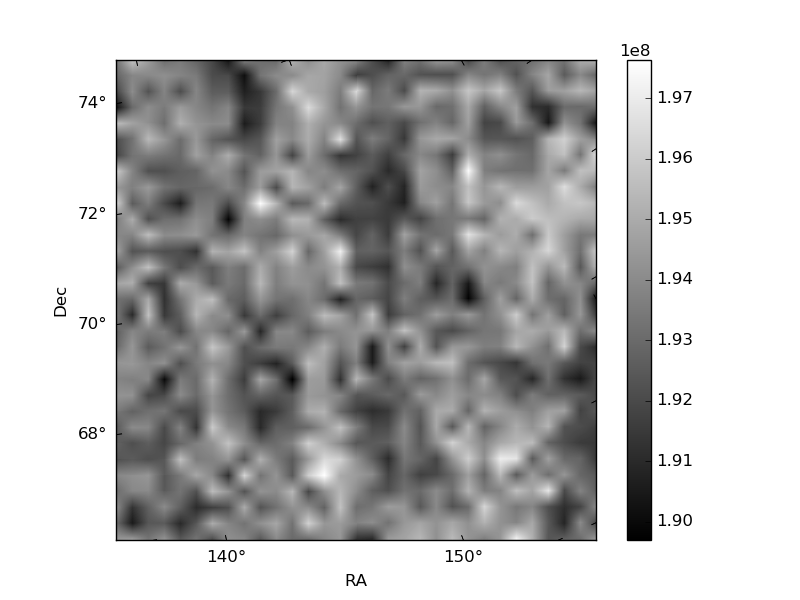
Quadrant C |
| Plot type | Count rate plots | Images |
|---|---|---|
| Comparison with Poisson distribution Blue bars denote a histogram of data divided into 1 sec bins. Red curve is a Poisson curve with rate = median count rate of data. |
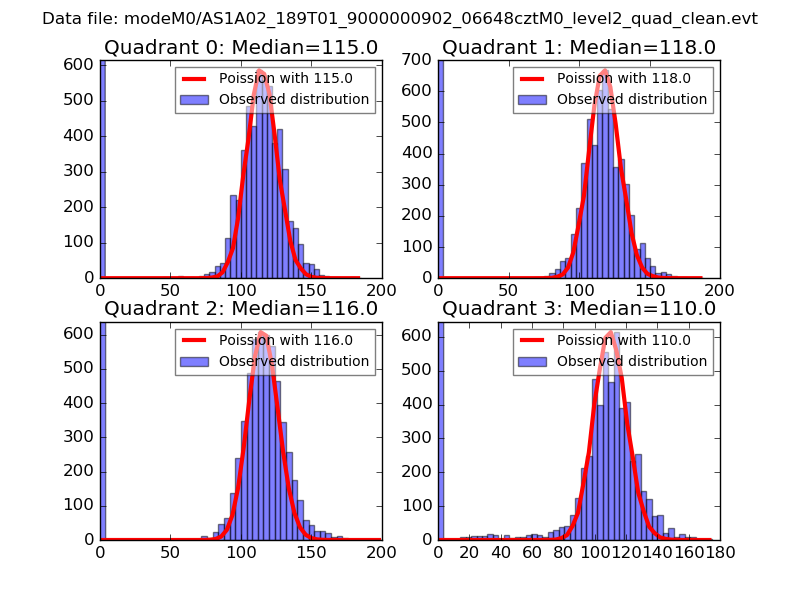 |
 |
| Quadrant-wise count rates Data is divided into 100 sec bins |
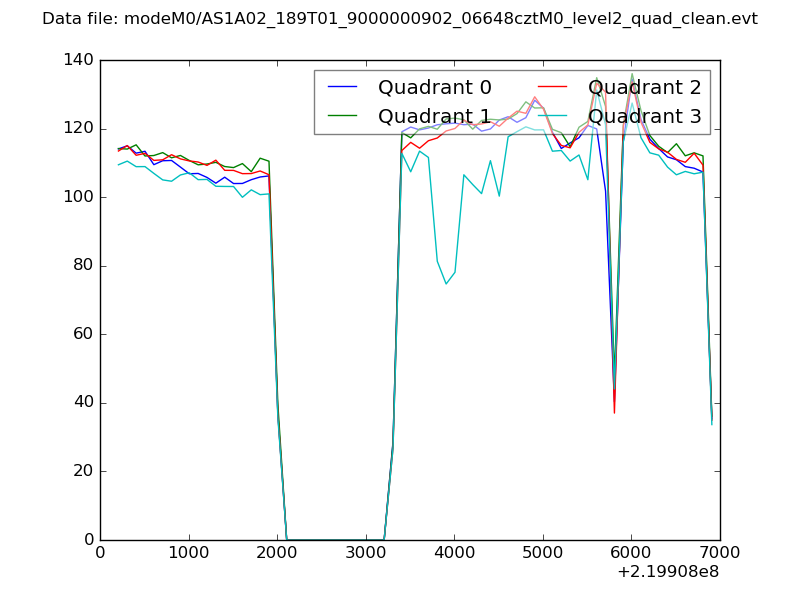 |
|
| Module-wise count rates for Quadrant A Data is divided into 100 sec bins |
 |
 |
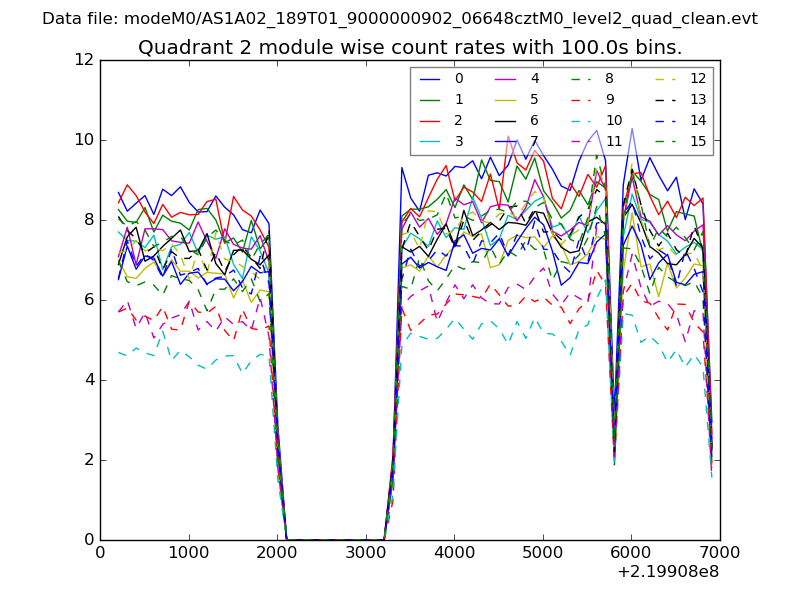
| Module-wise count rates for Quadrant B Data is divided into 100 sec bins |
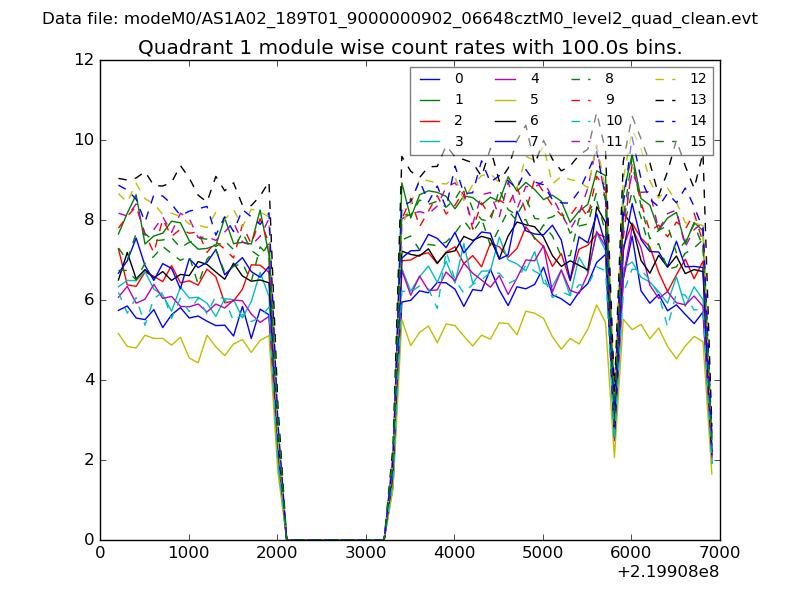 |
 |
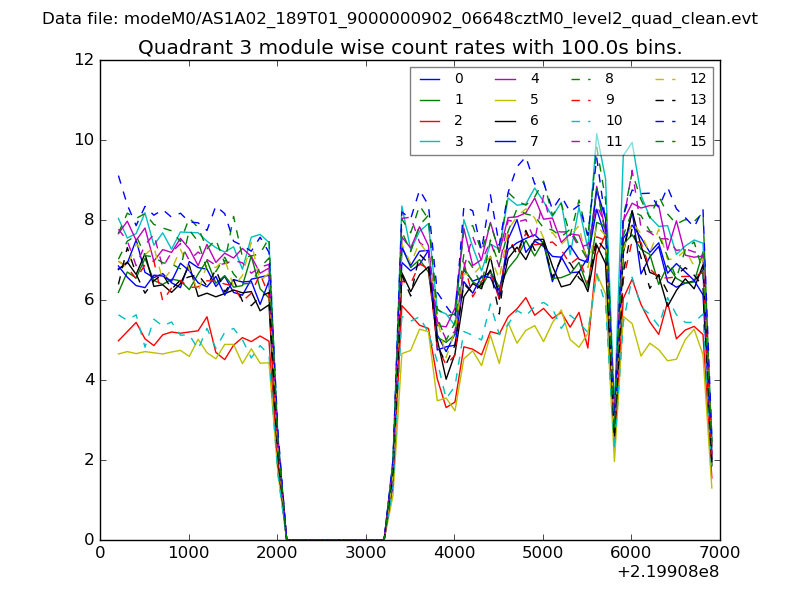
| Module-wise count rates for Quadrant C Data is divided into 100 sec bins |
 |
 |
| Module-wise count rates for Quadrant D Data is divided into 100 sec bins |
 |
 |
| Parameter | Plot |
|---|---|
| CZT HV Monitor | 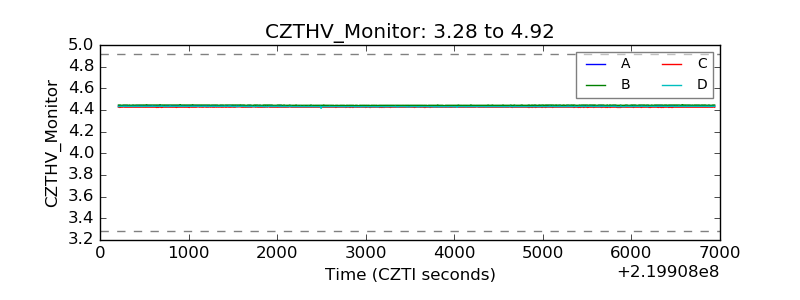 |
| D_VDD | 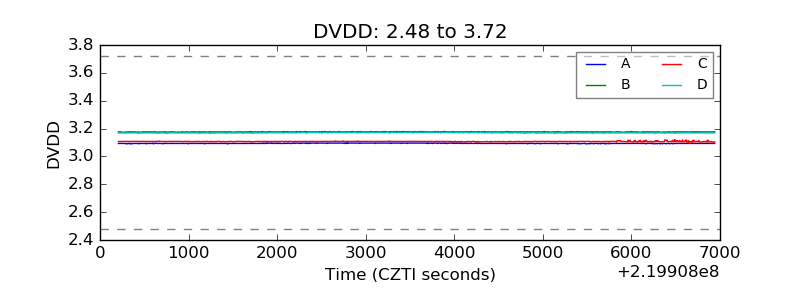 |
| Temperature 1 | 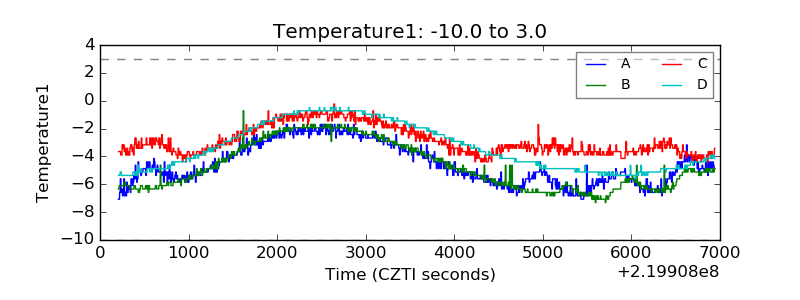 |
| Veto HV Monitor | 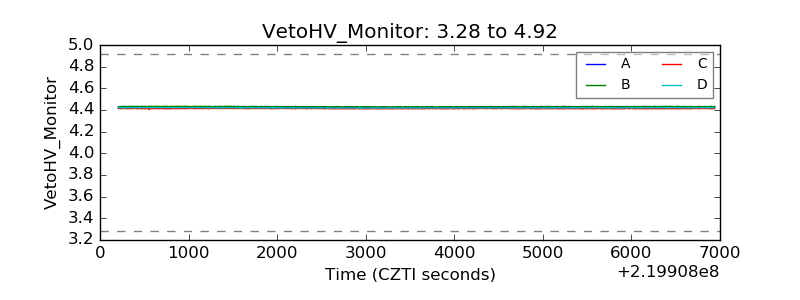 |
| Veto LLD |  |
| Alpha Counter | 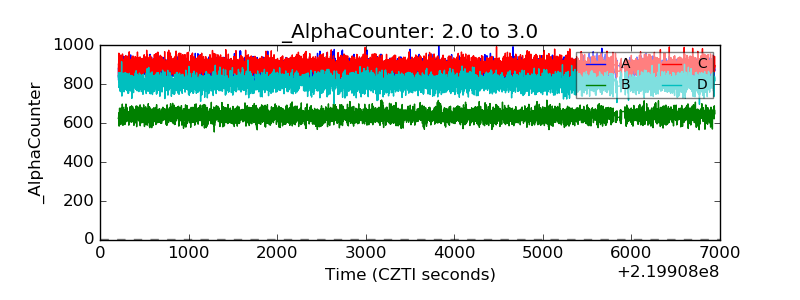 |
| _CPM_Rate | 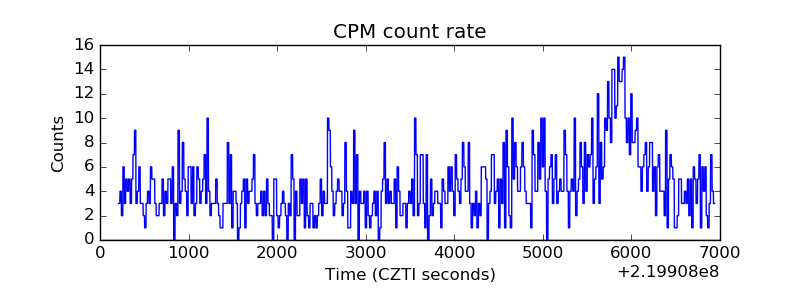 |
| CZT Counter | 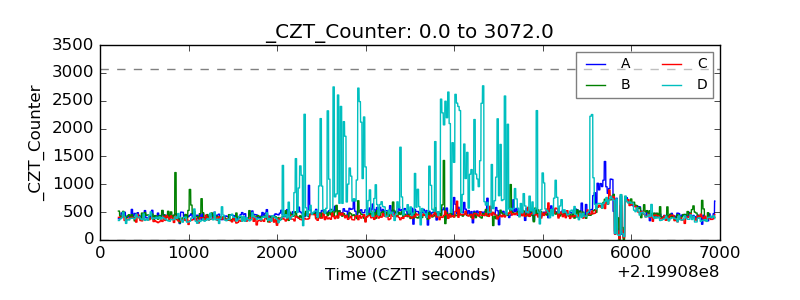 |
| +2.5 Volts monitor |  |
| +5 Volts monitor | 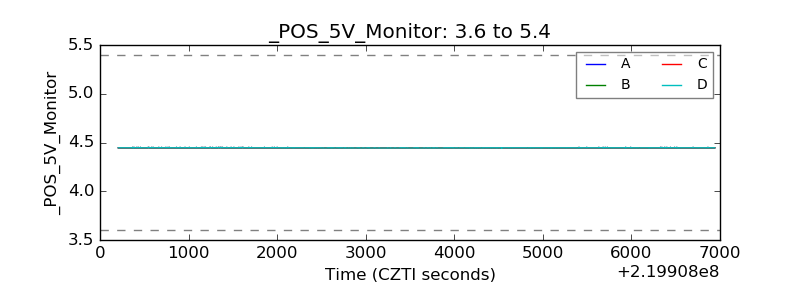 |
| _ROLL_ROT | 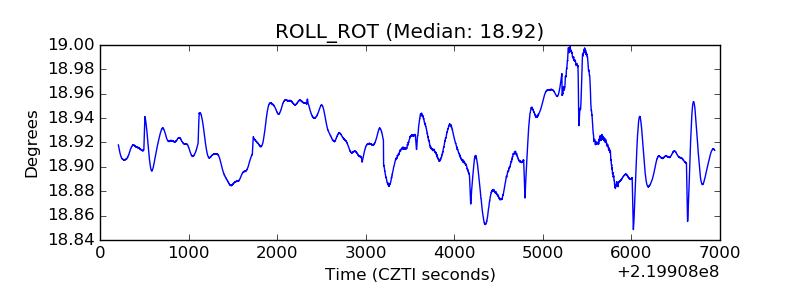 |
| _Roll_DEC | 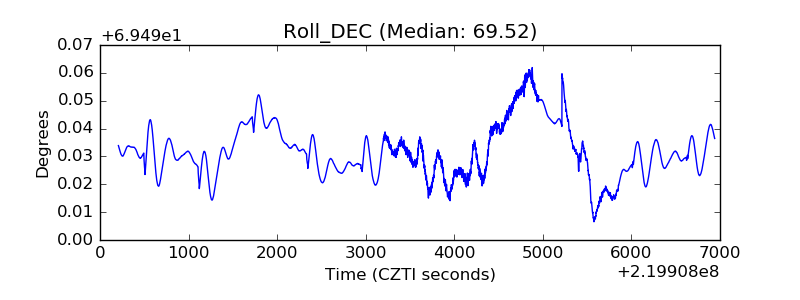 |
| _Roll_RA | 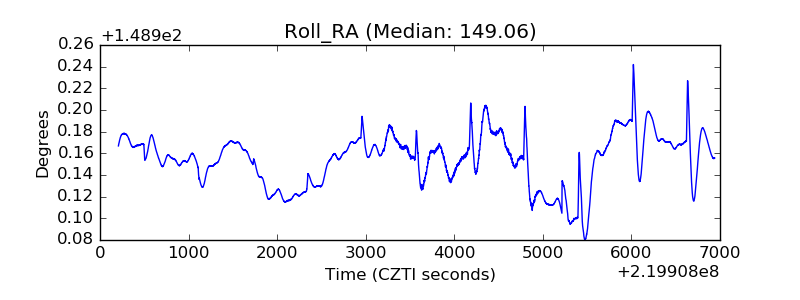 |
| Veto Counter |  |