| Param | Original file | Final file |
|---|---|---|
| Filename | modeM0/AS1A02_103T01_9000000904cztM0_level2.fits | modeM0/AS1A02_103T01_9000000904cztM0_level2_quad_clean.evt |
| Size (bytes) | 779,423,040 | 793,987,200 |
| Size | 743.3 MB | 757.2 MB |
| Events in quadrant A | 4,665,830 | 4,734,926 |
| Events in quadrant B | 4,615,018 | 4,872,470 |
| Events in quadrant C | 4,670,050 | 4,556,747 |
| Events in quadrant D | 3,708,872 | 3,944,863 |
| Mode M0 | |||
|---|---|---|---|
| Quadrant | BADHDUFLAG | Total packets | Discarded packets |
| A | 0 | 193624 | 0 |
| B | 0 | 182846 | 0 |
| C | 0 | 193875 | 0 |
| D | 0 | 298005 | 0 |
| Mode M9 | |||
|---|---|---|---|
| Quadrant | BADHDUFLAG | Total packets | Discarded packets |
| A | 0 | 121 | 0 |
| B | 0 | 121 | 0 |
| C | 0 | 121 | 0 |
| D | 0 | 121 | 0 |
| Mode SS | |||
|---|---|---|---|
| Quadrant | BADHDUFLAG | Total packets | Discarded packets |
| A | 0 | 1762 | 0 |
| B | 0 | 1762 | 0 |
| C | 0 | 1762 | 0 |
| D | 0 | 1762 | 0 |
| Quadrant | Total seconds | Saturated seconds | Saturation percentage |
|---|---|---|---|
| A | 86611 | 3005 | 3.469536% |
| B | 86612 | 1418 | 1.637187% |
| C | 86611 | 2030 | 2.343813% |
| D | 86607 | 12691 | 14.653550% |
Noise dominated data is calculated using 1-second bins in cleaned event files. If a bin has >2000 counts, and if more than 50% of those come from <1% of pixels, then it is considered to be noise-dominated and hence unusable.
| Quadrant | # 1 sec bins | Bins with >0 counts | Bins with >2000 counts | High rate bins dominated by noise | Noise dominated (total time) | Noise dominated (detector-on time) | Marked lightcurve |
|---|---|---|---|---|---|---|---|
| A | 98193 | 86616 | 0 | 0 | 0.00% | 0.00% | 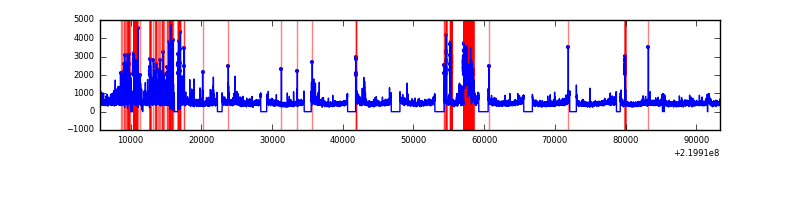 |
| B | 98193 | 86619 | 0 | 0 | 0.00% | 0.00% | 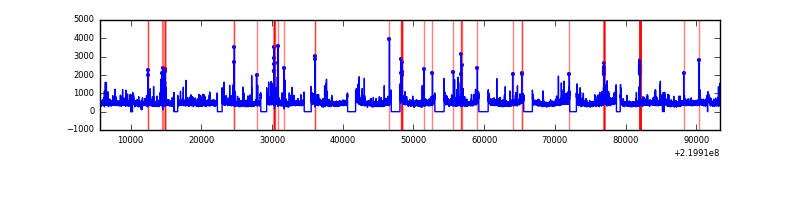 |
| C | 98193 | 86595 | 0 | 0 | 0.00% | 0.00% | 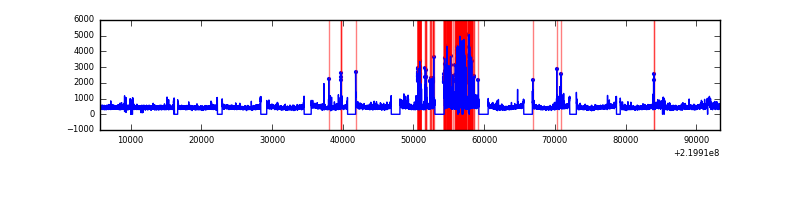 |
| D | 98193 | 86196 | 0 | 0 | 0.00% | 0.00% | 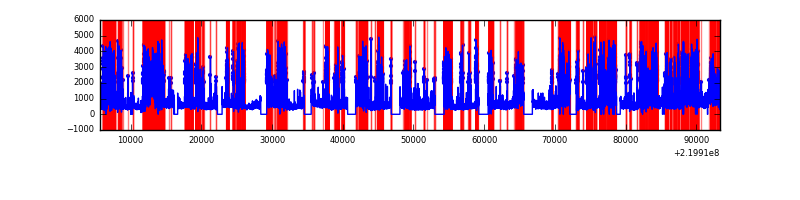 |
Top three noisy pixels from each quadrant. If the there are fewer than three noisy pixels in the level2.evt file, extra rows are filled as -1
| Pixel properties | Quadrant properties | ||||||
|---|---|---|---|---|---|---|---|
| Quadrant | DetID | PixID | Counts | Sigma | Mean | Median | Sigma |
| A | 0 | 29 | 4681 | 11.49 | 1214 | 1130 | 309.1 |
| A | 7 | 110 | 4013 | 9.33 | 1214 | 1130 | 309.1 |
| A | 0 | 30 | 3549 | 7.83 | 1214 | 1130 | 309.1 |
| B | 2 | 9 | 3979 | 11.49 | 1215 | 1153 | 245.9 |
| B | 12 | 226 | 3181 | 8.25 | 1215 | 1153 | 245.9 |
| B | 14 | 254 | 3102 | 7.93 | 1215 | 1153 | 245.9 |
| C | 1 | 80 | 3457 | 7.04 | 1231 | 1133 | 330.3 |
| C | 1 | 81 | 3360 | 6.74 | 1231 | 1133 | 330.3 |
| C | 12 | 241 | 3218 | 6.31 | 1231 | 1133 | 330.3 |
| D | 6 | 231 | 2711 | 6.04 | 1058 | 956 | 290.6 |
| D | 7 | 5 | 2700 | 6.0 | 1058 | 956 | 290.6 |
| D | 3 | 14 | 2695 | 5.98 | 1058 | 956 | 290.6 |
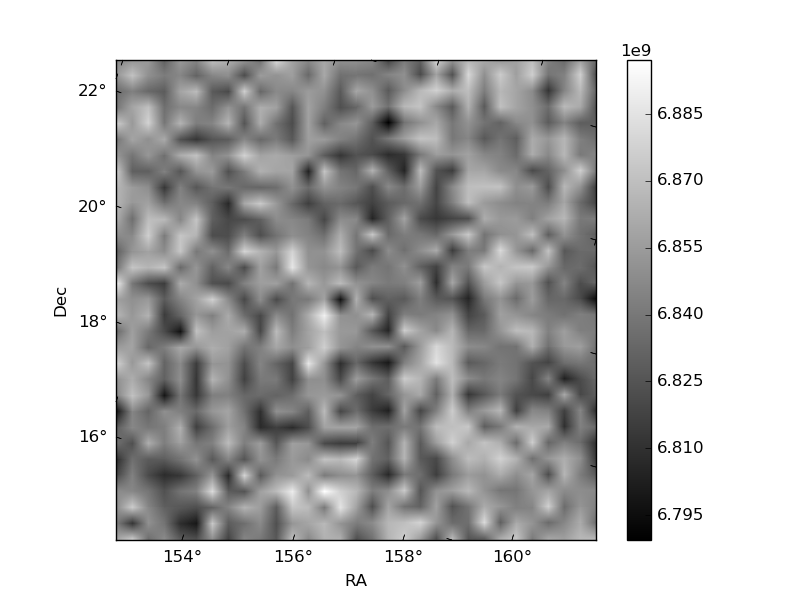
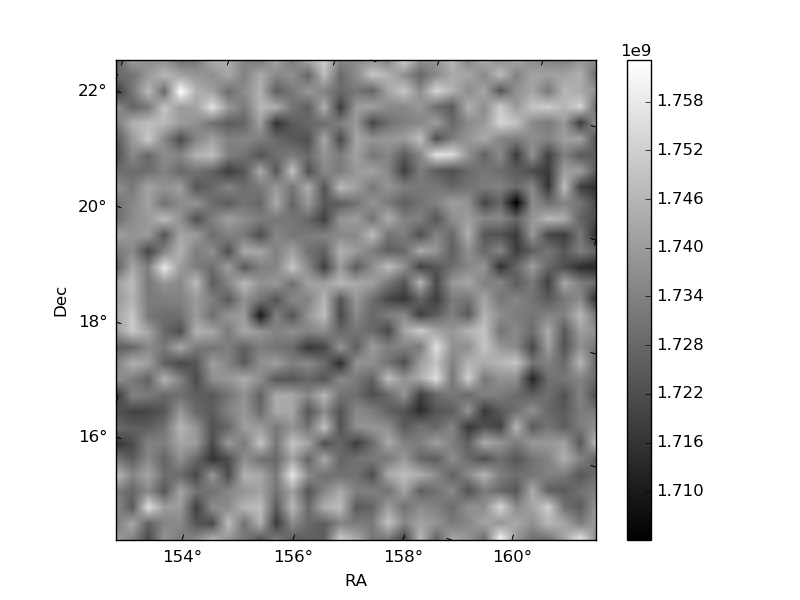
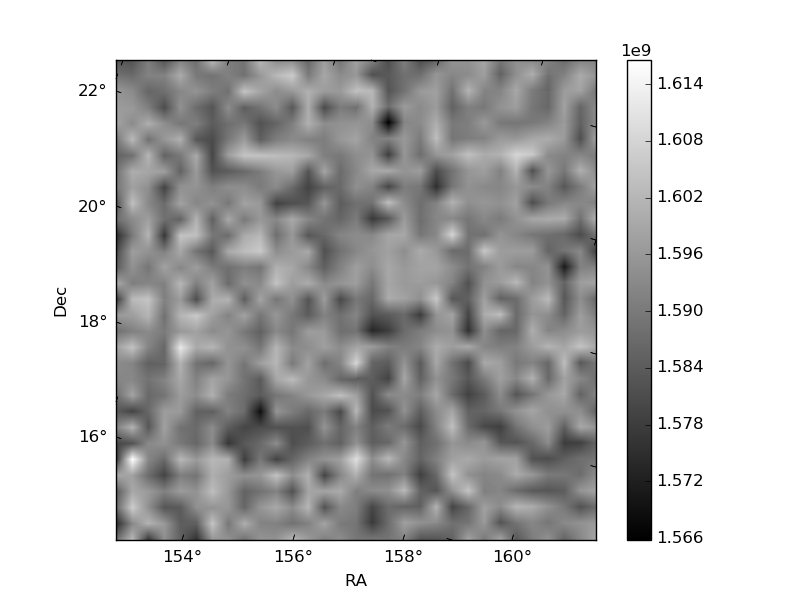
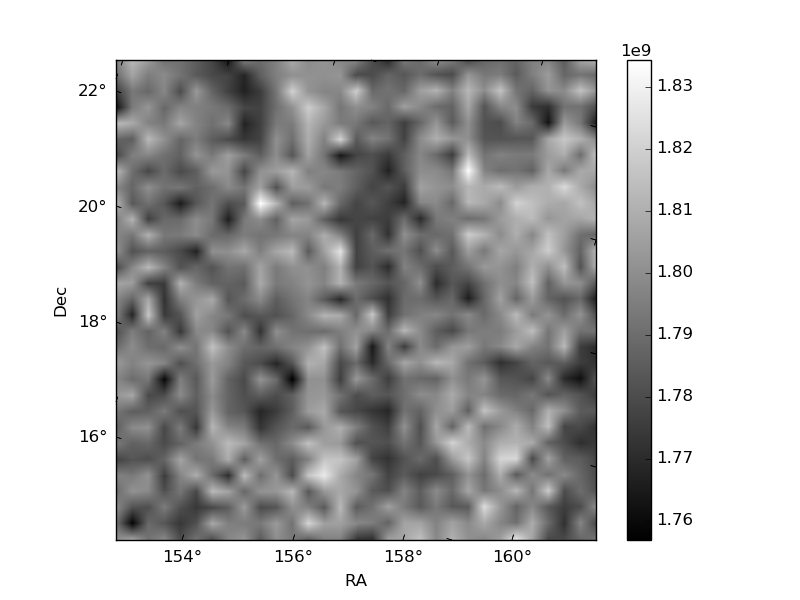
Histogram calculated using DETX and DETY for each event in the final _common_clean file
| Quadrant A | 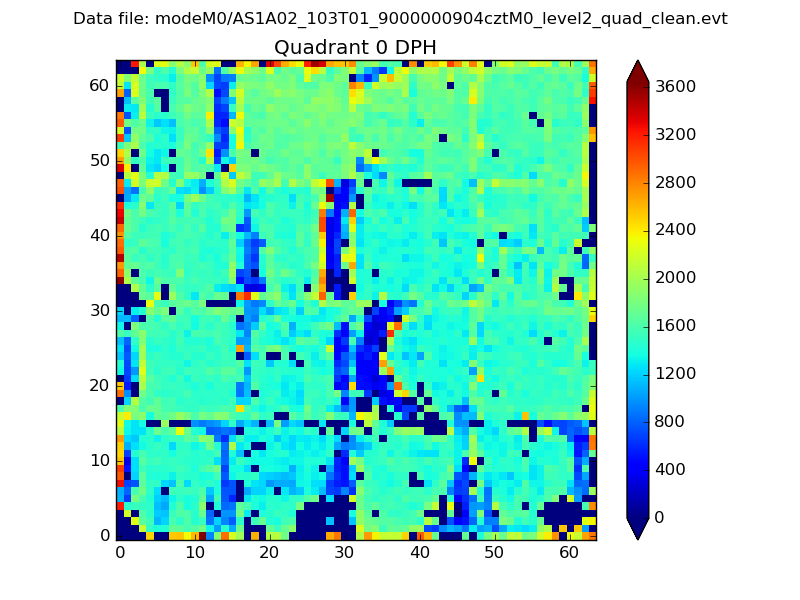 |
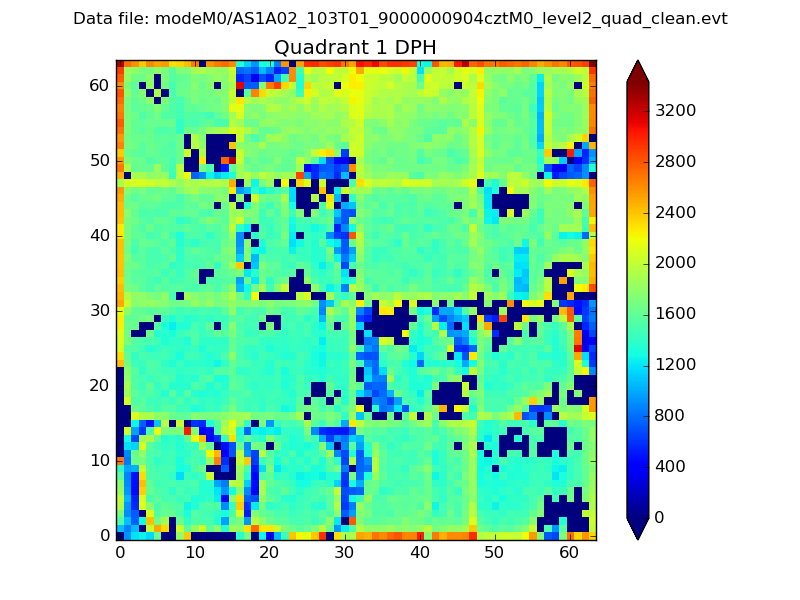 |
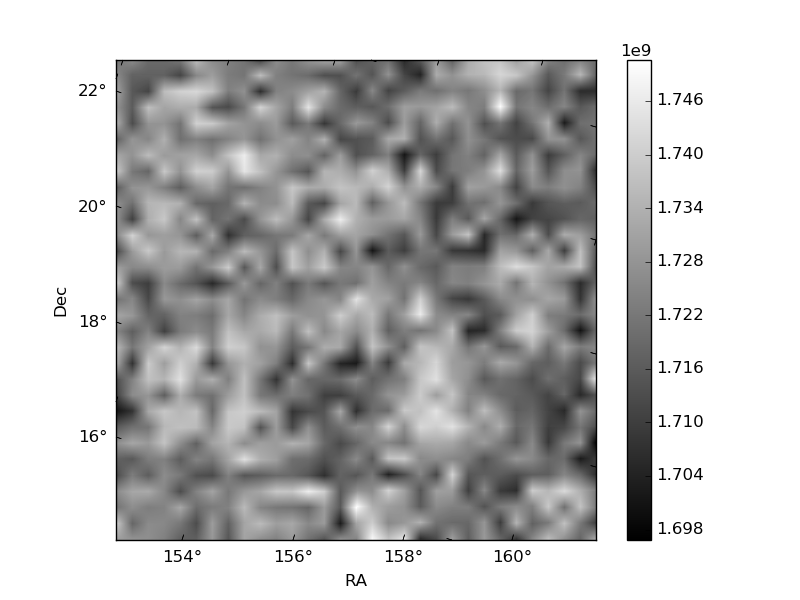
Quadrant B |
|---|---|---|---|
| Quadrant D | 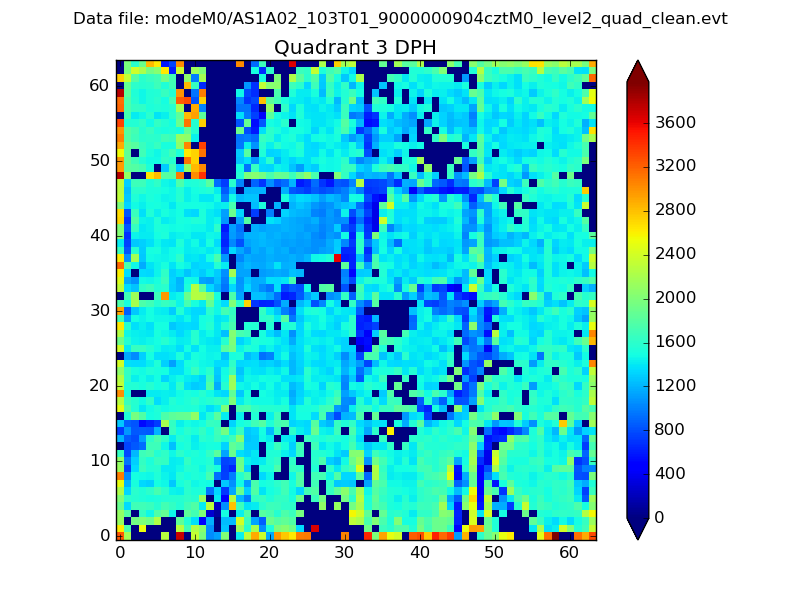 |
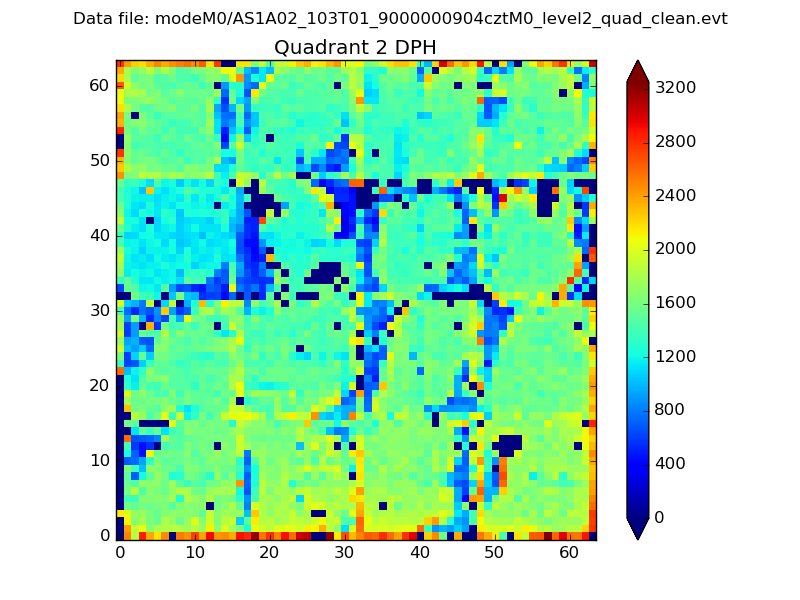 |
Quadrant C |
| Plot type | Count rate plots | Images |
|---|---|---|
| Comparison with Poisson distribution Blue bars denote a histogram of data divided into 1 sec bins. Red curve is a Poisson curve with rate = median count rate of data. |
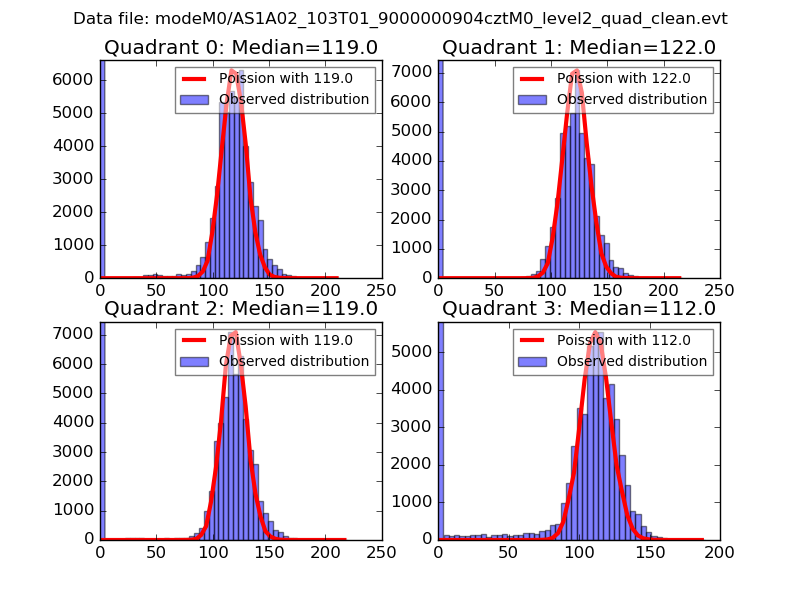 |
 |
| Quadrant-wise count rates Data is divided into 100 sec bins |
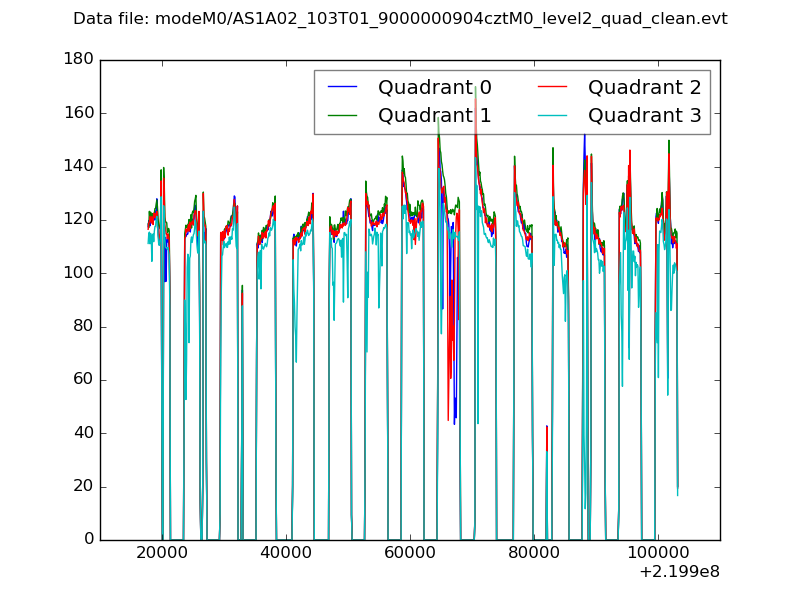 |
|
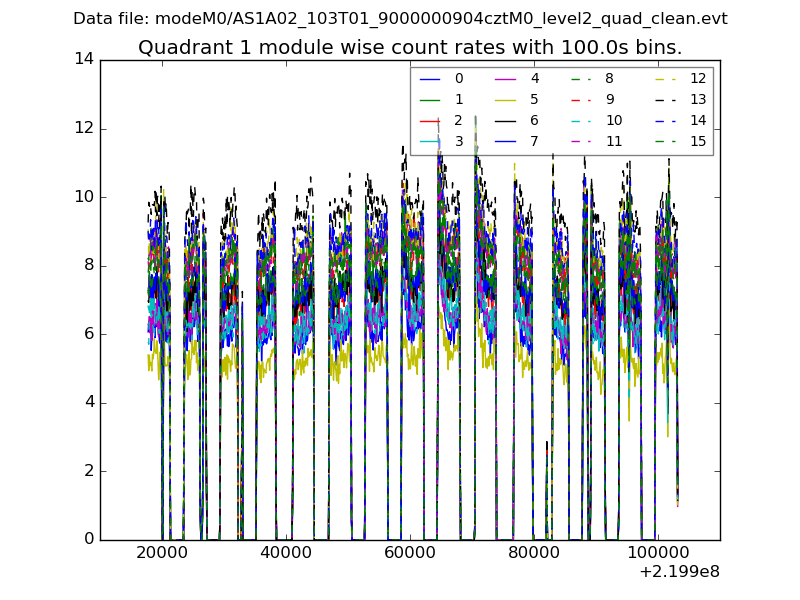
| Module-wise count rates for Quadrant A Data is divided into 100 sec bins |
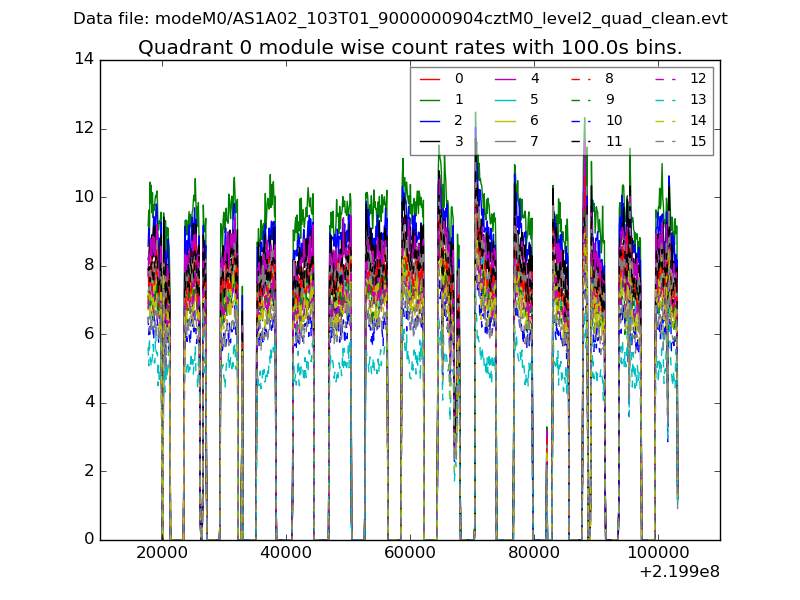 |
 |
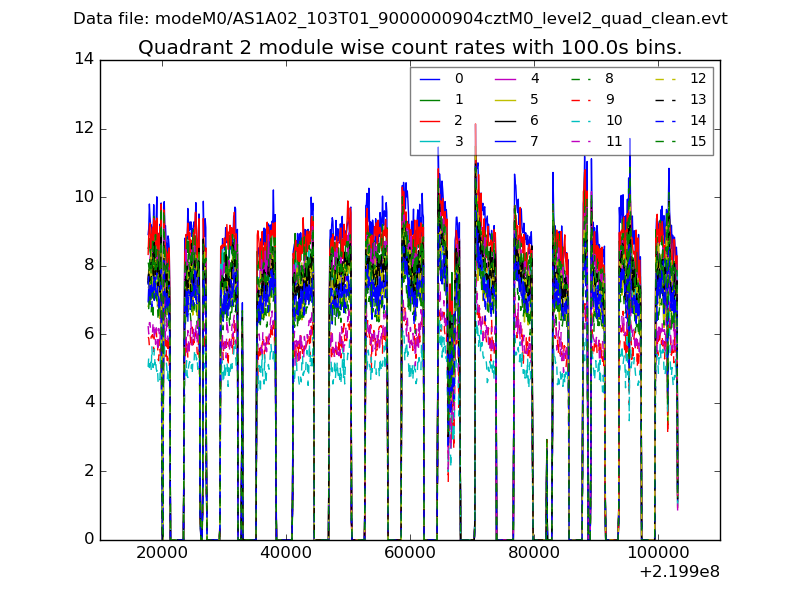
| Module-wise count rates for Quadrant B Data is divided into 100 sec bins |
 |
 |
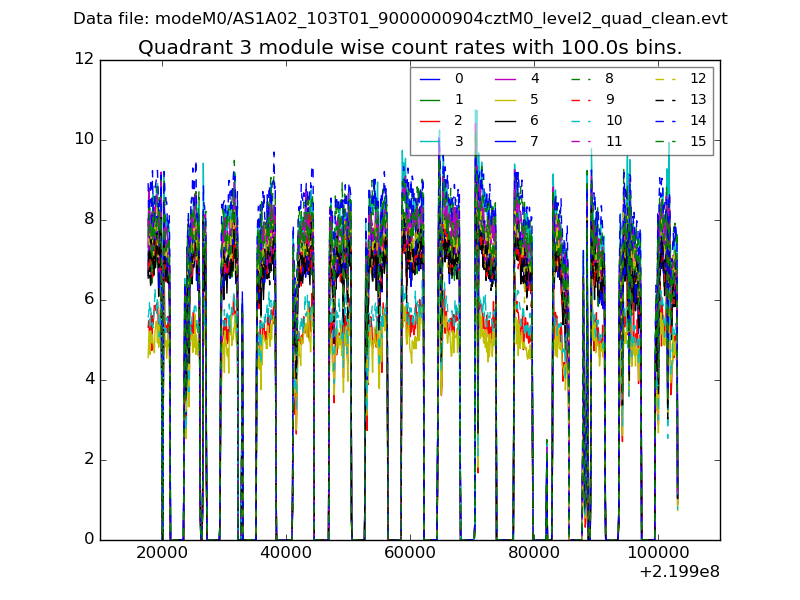
| Module-wise count rates for Quadrant C Data is divided into 100 sec bins |
 |
 |
| Module-wise count rates for Quadrant D Data is divided into 100 sec bins |
 |
 |
| Parameter | Plot |
|---|---|
| CZT HV Monitor | 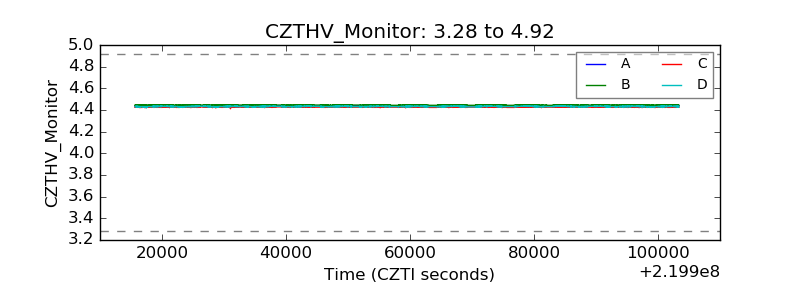 |
| D_VDD | 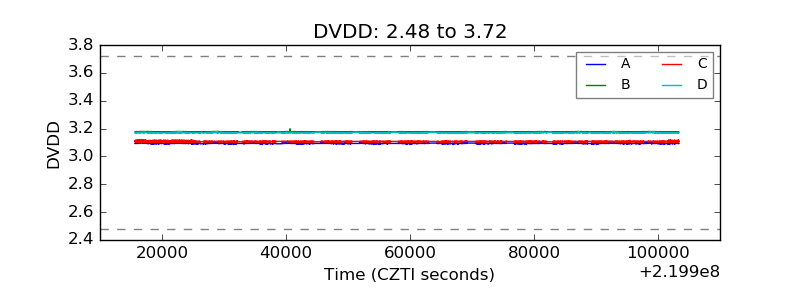 |
| Temperature 1 | 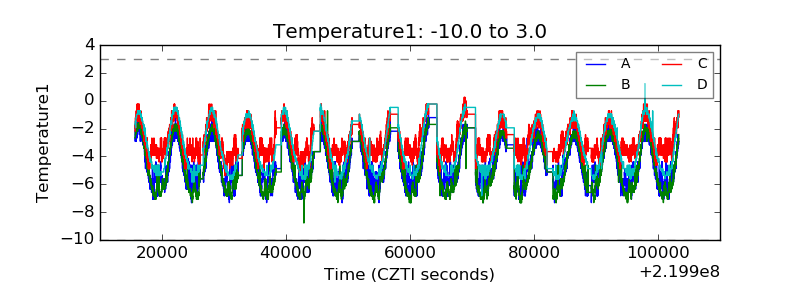 |
| Veto HV Monitor | 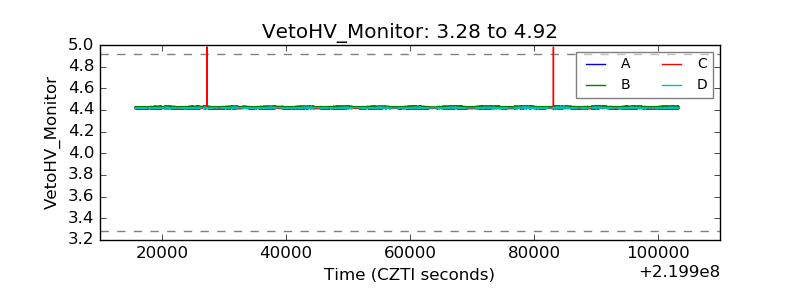 |
| Veto LLD | 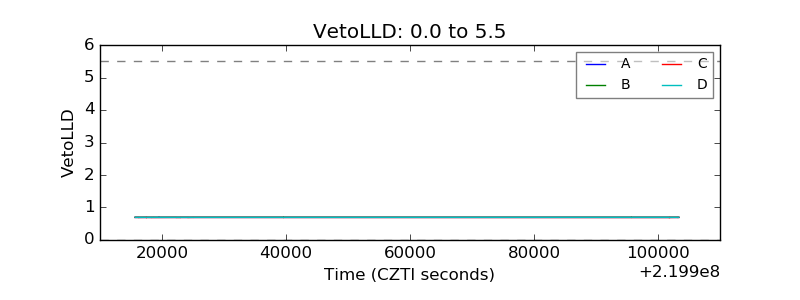 |
| Alpha Counter | 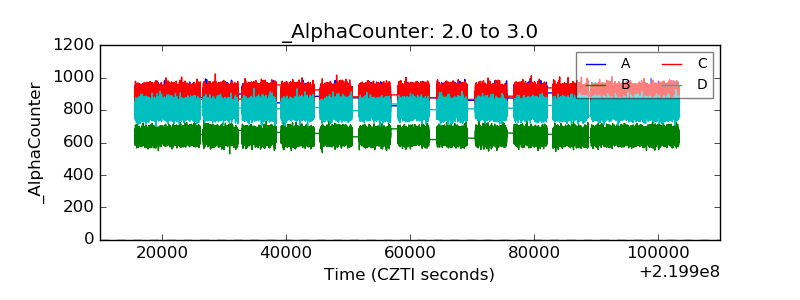 |
| _CPM_Rate | 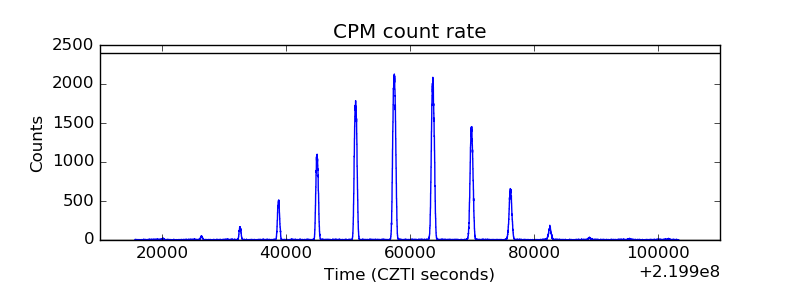 |
| CZT Counter | 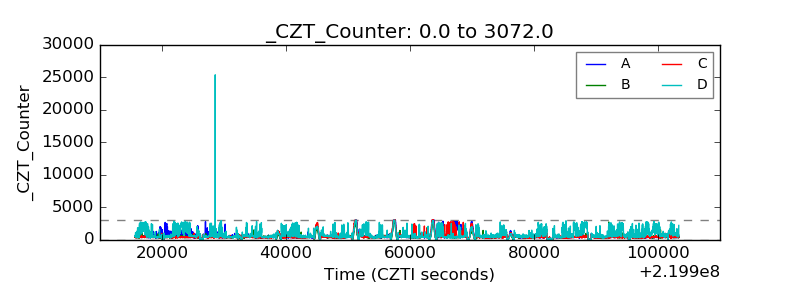 |
| +2.5 Volts monitor | 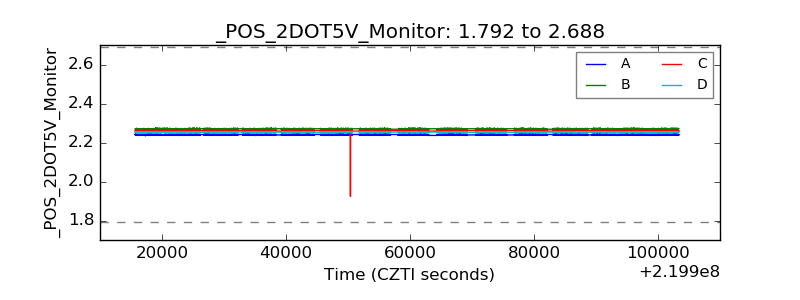 |
| +5 Volts monitor |  |
| _ROLL_ROT | 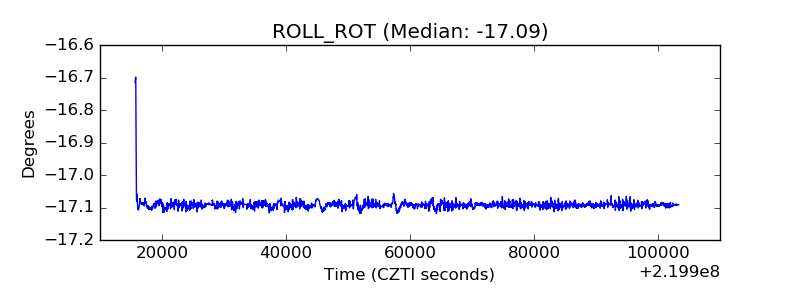 |
| _Roll_DEC | 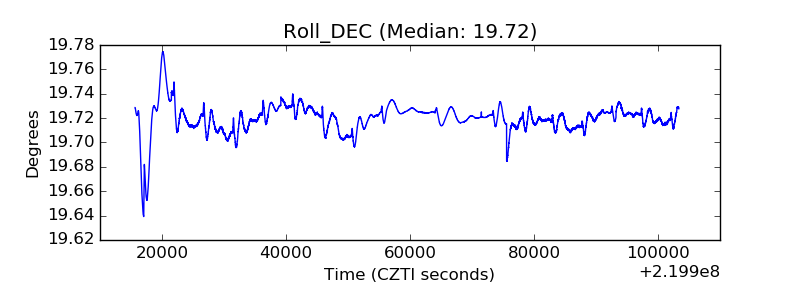 |
| _Roll_RA | 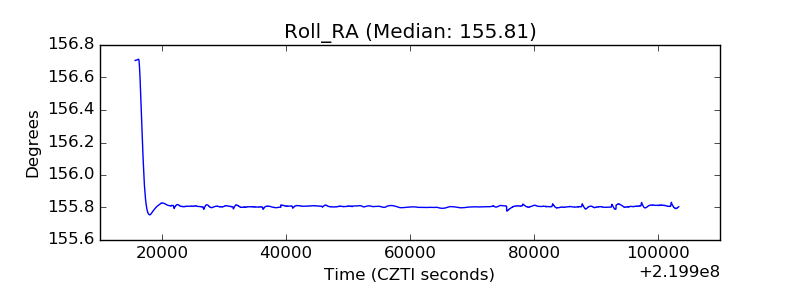 |
| Veto Counter | 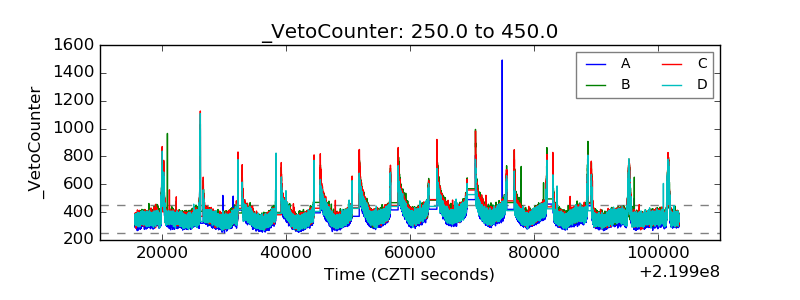 |