| Param | Original file | Final file |
|---|---|---|
| Filename | modeM0/AS1A02_103T01_9000000904_06649cztM0_level2.evt | modeM0/AS1A02_103T01_9000000904_06649cztM0_level2_quad_clean.evt |
| Size (bytes) | 507,274,560 | 65,698,560 |
| Size | 483.8 MB | 62.7 MB |
| Events in quadrant A | 3,680,415 | 386,913 |
| Events in quadrant B | 2,897,638 | 406,103 |
| Events in quadrant C | 2,707,891 | 396,803 |
| Events in quadrant D | 5,668,523 | 379,611 |
| Mode M0 | |||
|---|---|---|---|
| Quadrant | BADHDUFLAG | Total packets | Discarded packets |
| A | 0 | 14522 | 17 |
| B | 0 | 12449 | 13 |
| C | 0 | 12300 | 15 |
| D | 0 | 20958 | 47 |
| Mode M9 | |||
|---|---|---|---|
| Quadrant | BADHDUFLAG | Total packets | Discarded packets |
| A | 0 | 2 | 0 |
| B | 0 | 2 | 0 |
| C | 0 | 2 | 0 |
| D | 0 | 2 | 0 |
| Mode SS | |||
|---|---|---|---|
| Quadrant | BADHDUFLAG | Total packets | Discarded packets |
| A | 0 | 124 | 0 |
| B | 0 | 124 | 0 |
| C | 0 | 124 | 0 |
| D | 0 | 124 | 0 |
| Quadrant | Total seconds | Saturated seconds | Saturation percentage |
|---|---|---|---|
| A | 6001 | 329 | 5.482420% |
| B | 6002 | 128 | 2.132622% |
| C | 6001 | 119 | 1.983003% |
| D | 5997 | 1220 | 20.343505% |
Noise dominated data is calculated using 1-second bins in cleaned event files. If a bin has >2000 counts, and if more than 50% of those come from <1% of pixels, then it is considered to be noise-dominated and hence unusable.
| Quadrant | # 1 sec bins | Bins with >0 counts | Bins with >2000 counts | High rate bins dominated by noise | Noise dominated (total time) | Noise dominated (detector-on time) | Marked lightcurve |
|---|---|---|---|---|---|---|---|
| A | 6263 | 6009 | 117 | 117 | 1.87% | 1.95% | 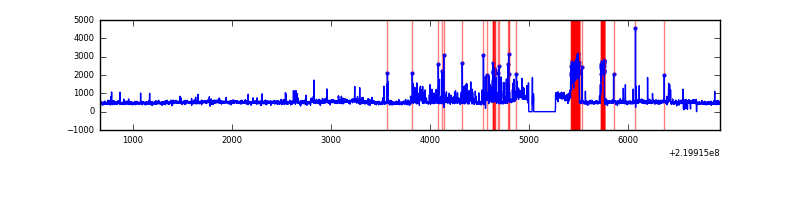 |
| B | 6263 | 6010 | 0 | 0 | 0.00% | 0.00% | 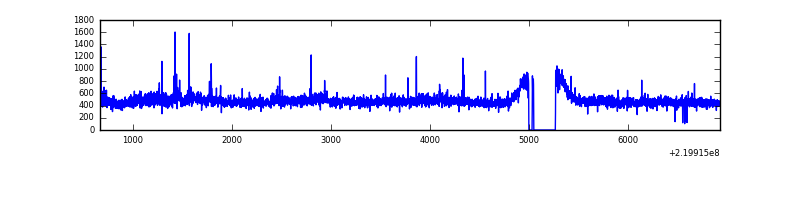 |
| C | 6263 | 6010 | 0 | 0 | 0.00% | 0.00% | 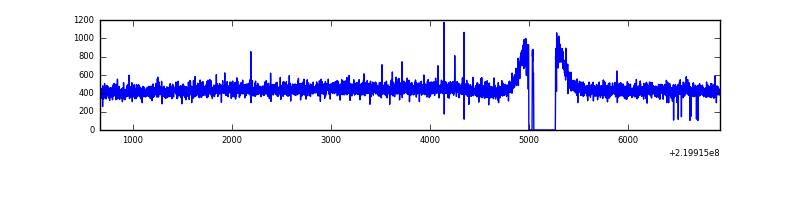 |
| D | 6263 | 6010 | 867 | 867 | 13.84% | 14.43% | 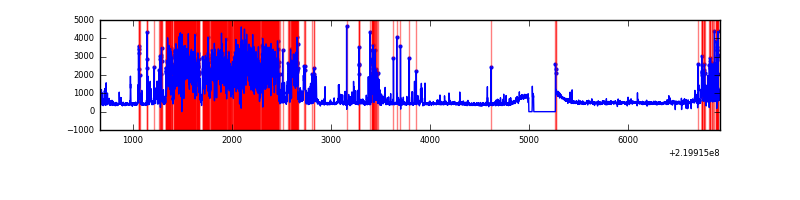 |
Top three noisy pixels from each quadrant. If the there are fewer than three noisy pixels in the level2.evt file, extra rows are filled as -1
| Pixel properties | Quadrant properties | ||||||
|---|---|---|---|---|---|---|---|
| Quadrant | DetID | PixID | Counts | Sigma | Mean | Median | Sigma |
| A | 8 | 15 | 721062 | 4914.46 | 700 | 682 | 146.6 |
| A | 15 | 236 | 245055 | 1667.12 | 700 | 682 | 146.6 |
| A | 3 | 1 | 9223 | 58.27 | 700 | 682 | 146.6 |
| B | 15 | 204 | 47182 | 331.09 | 713 | 694 | 140.4 |
| B | 0 | 214 | 29576 | 205.7 | 713 | 694 | 140.4 |
| B | 4 | 80 | 24386 | 168.73 | 713 | 694 | 140.4 |
| C | 8 | 128 | 14636 | 86.41 | 687 | 688 | 161.4 |
| C | 8 | 112 | 7272 | 40.79 | 687 | 688 | 161.4 |
| C | 8 | 144 | 5502 | 29.82 | 687 | 688 | 161.4 |
| D | 2 | 33 | 2922025 | 18876.34 | 627 | 606 | 154.8 |
| D | 12 | 221 | 102215 | 656.53 | 627 | 606 | 154.8 |
| D | 8 | 195 | 86083 | 552.29 | 627 | 606 | 154.8 |
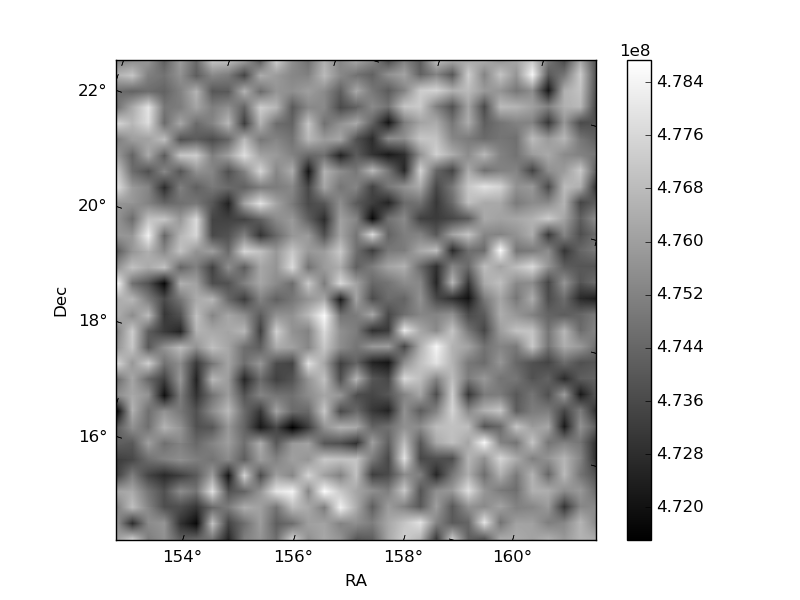
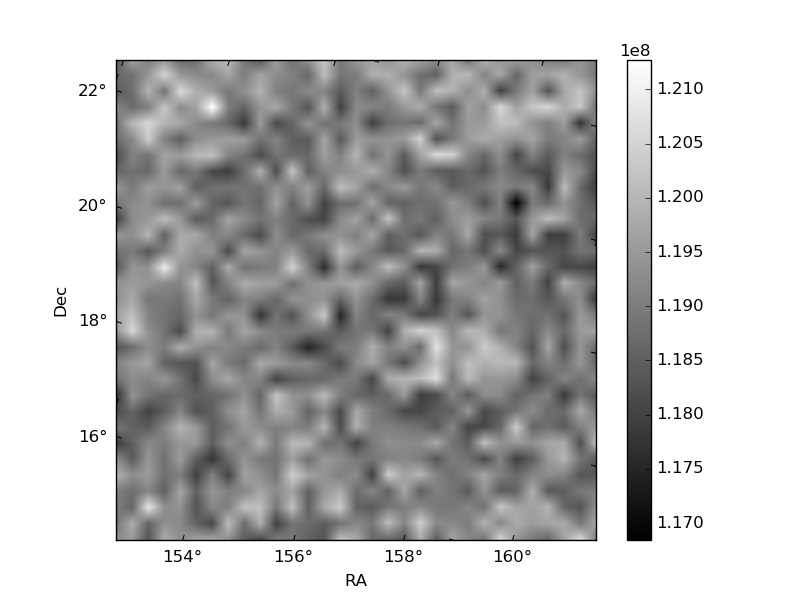
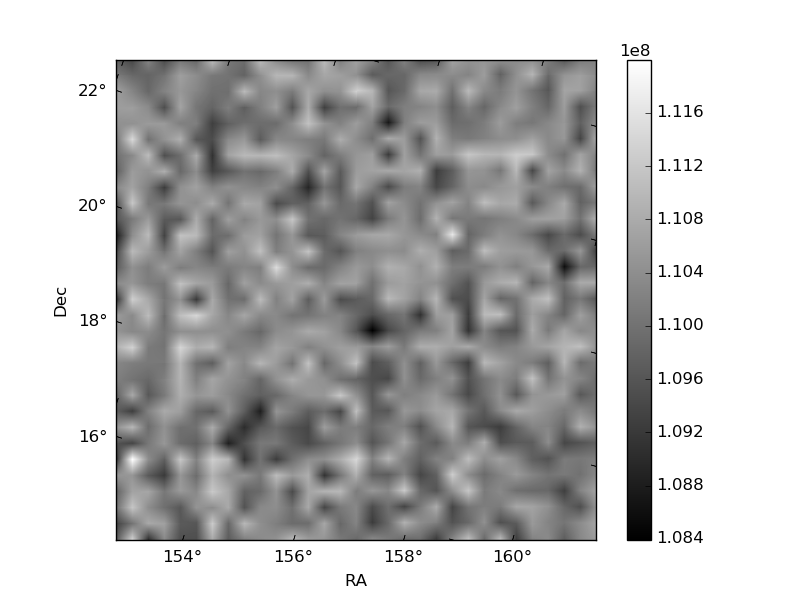
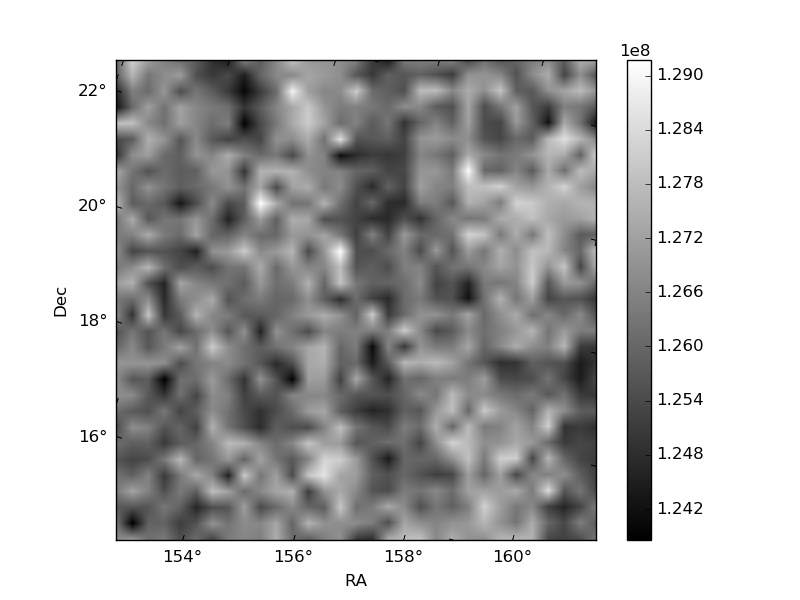
Histogram calculated using DETX and DETY for each event in the final _common_clean file
| Quadrant A | 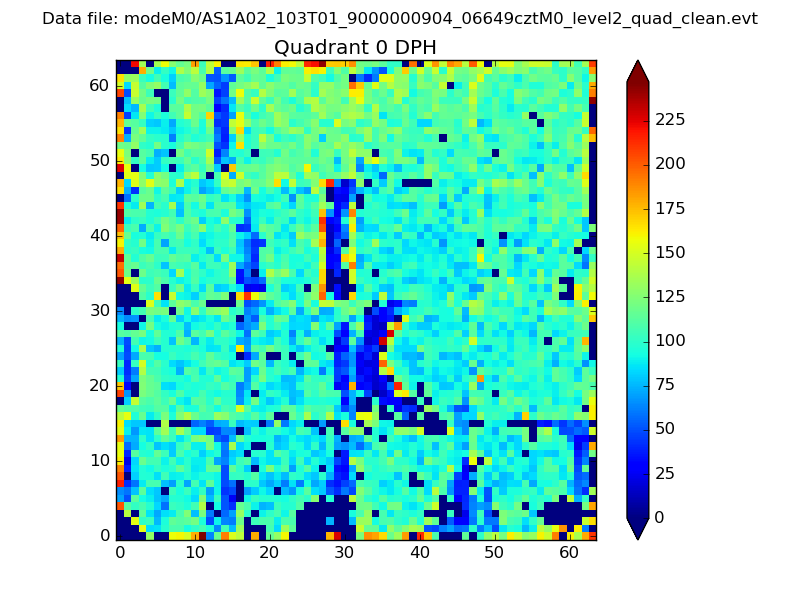 |
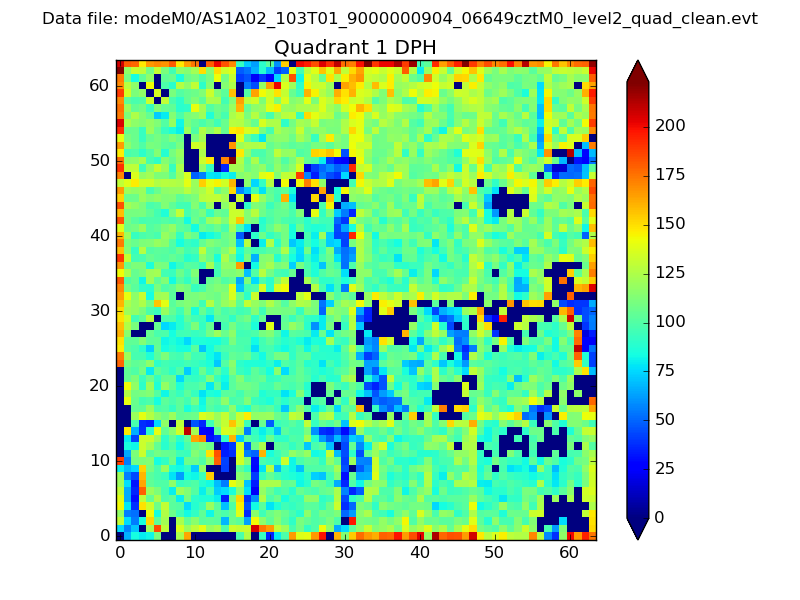 |
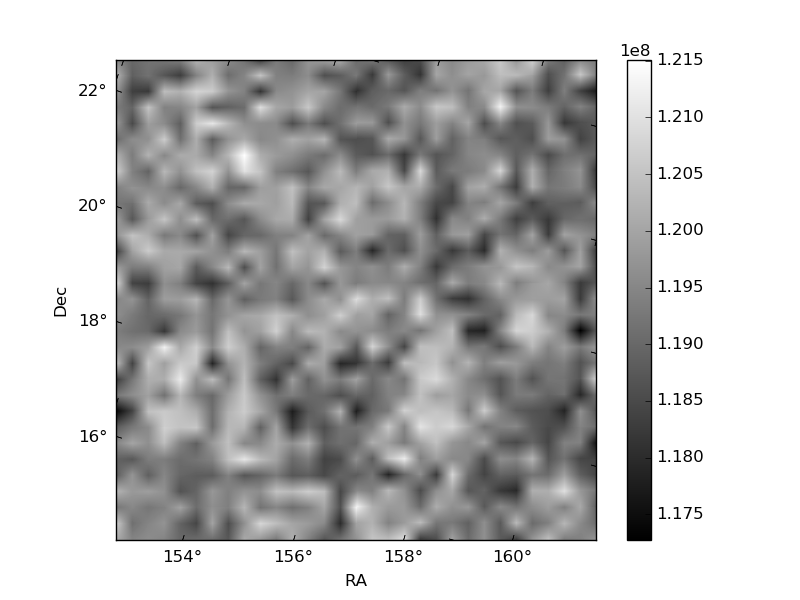
Quadrant B |
|---|---|---|---|
| Quadrant D | 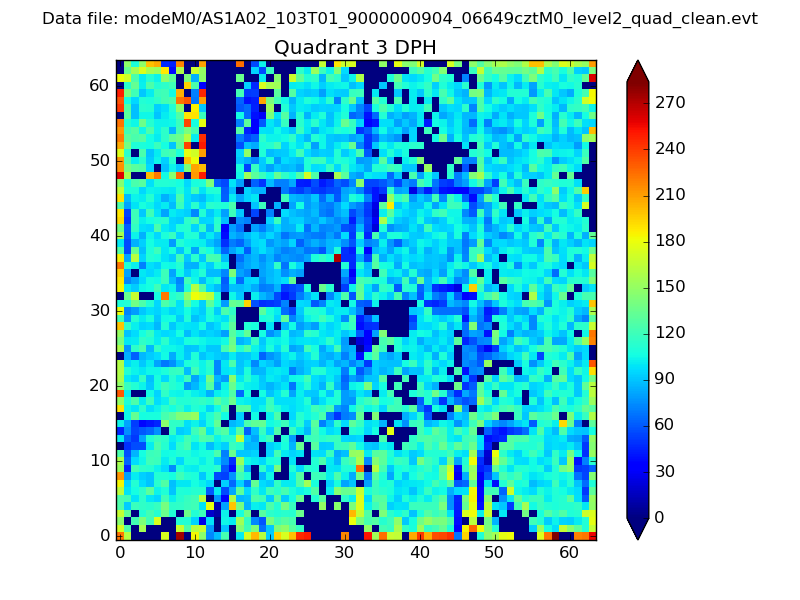 |
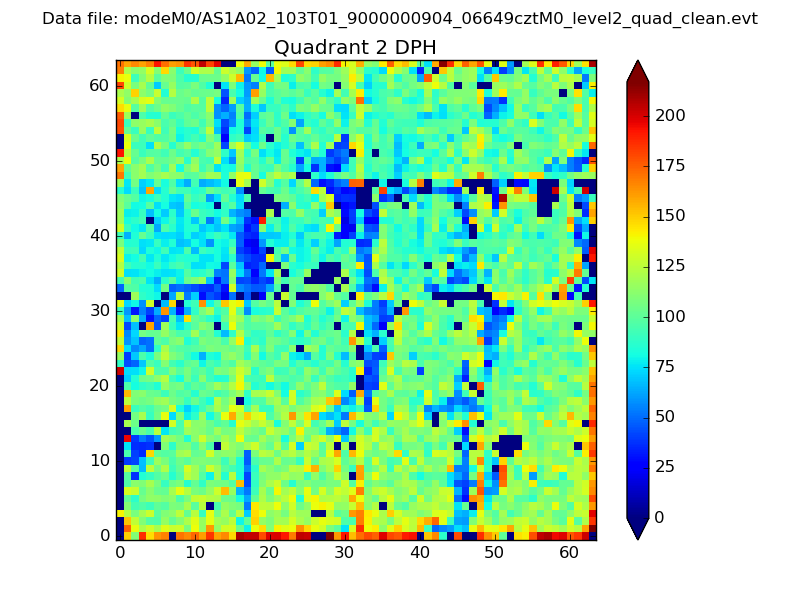 |
Quadrant C |
| Plot type | Count rate plots | Images |
|---|---|---|
| Comparison with Poisson distribution Blue bars denote a histogram of data divided into 1 sec bins. Red curve is a Poisson curve with rate = median count rate of data. |
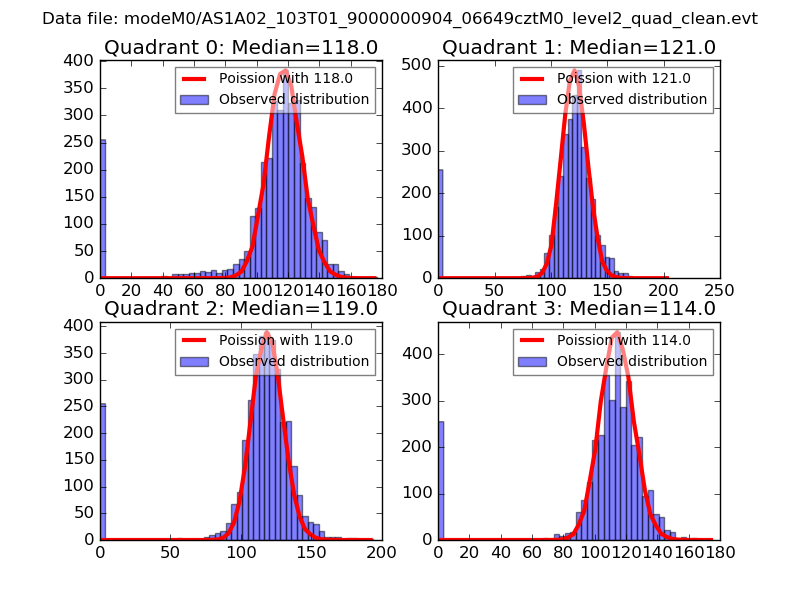 |
 |
| Quadrant-wise count rates Data is divided into 100 sec bins |
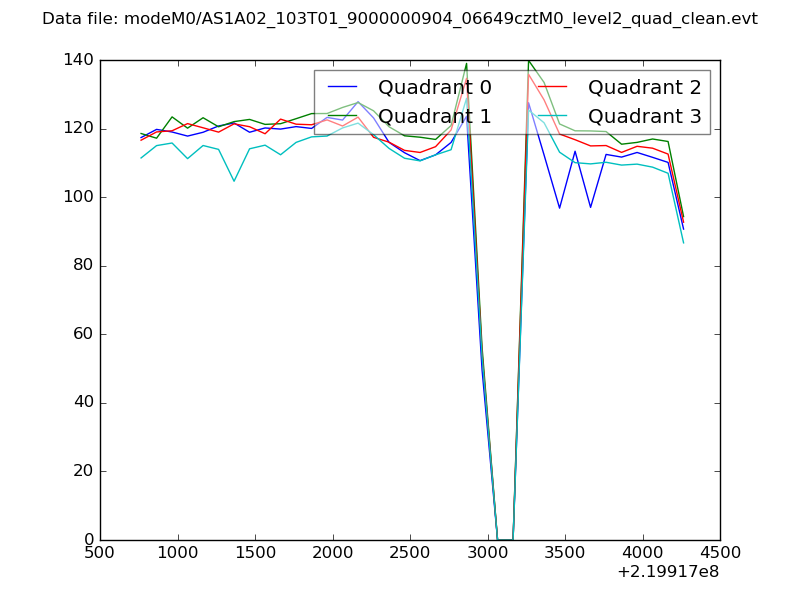 |
|
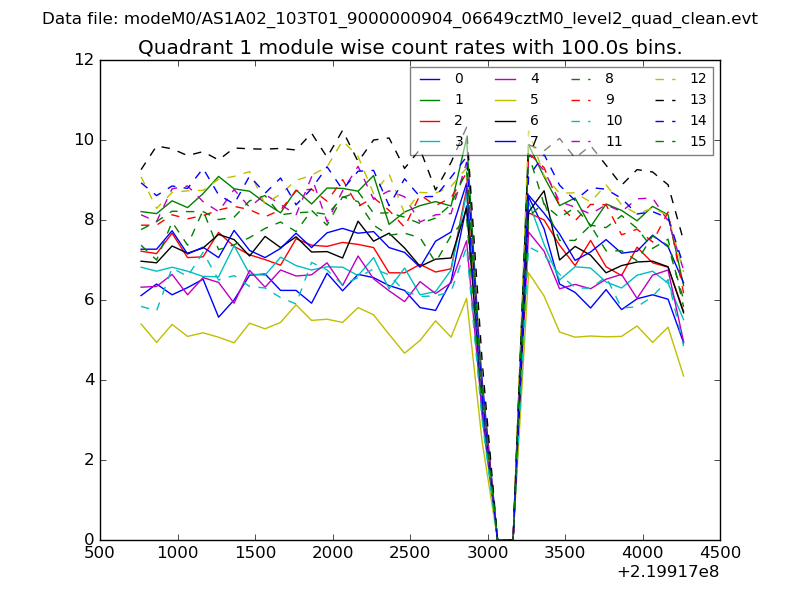
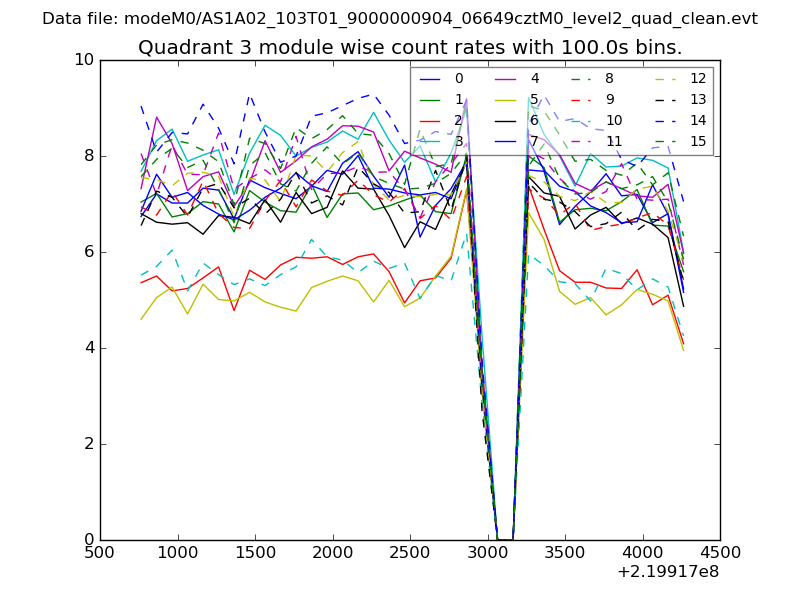
| Module-wise count rates for Quadrant A Data is divided into 100 sec bins |
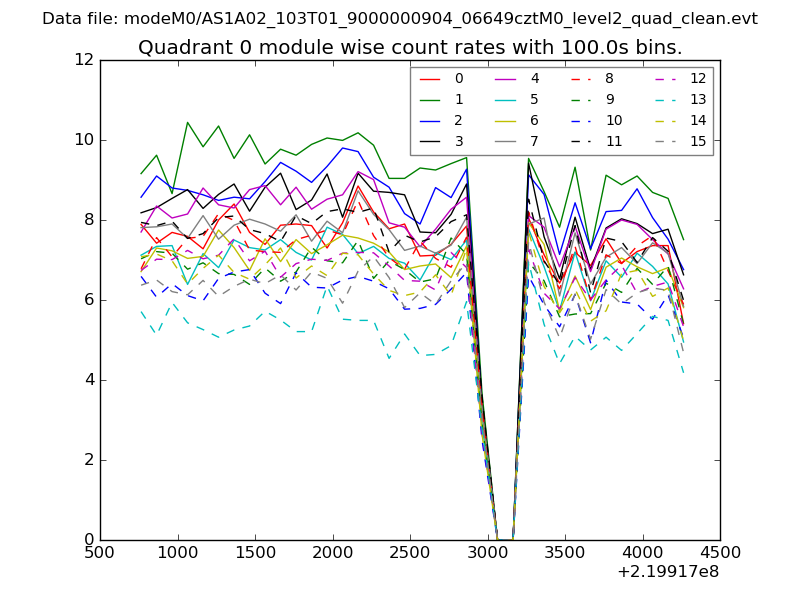 |
 |
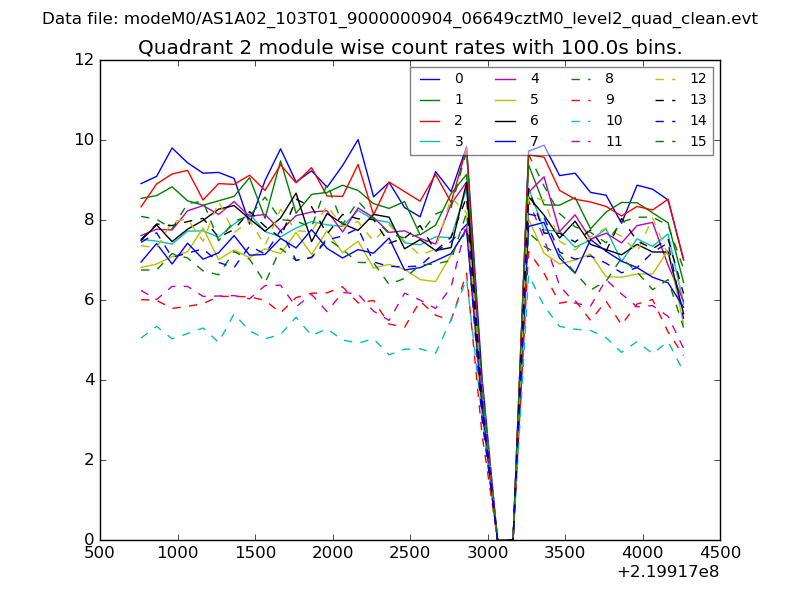
| Module-wise count rates for Quadrant B Data is divided into 100 sec bins |
 |
 |
| Module-wise count rates for Quadrant C Data is divided into 100 sec bins |
 |
 |
| Module-wise count rates for Quadrant D Data is divided into 100 sec bins |
 |
 |
| Parameter | Plot |
|---|---|
| CZT HV Monitor | 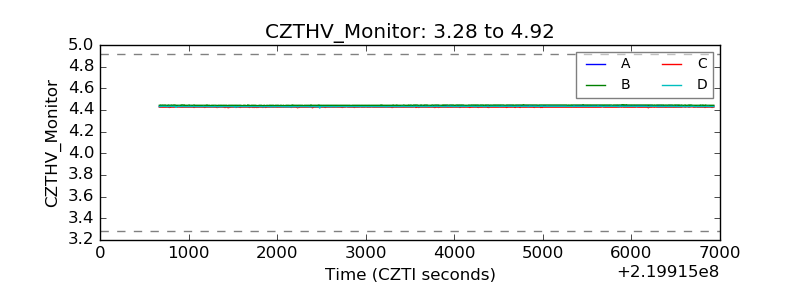 |
| D_VDD | 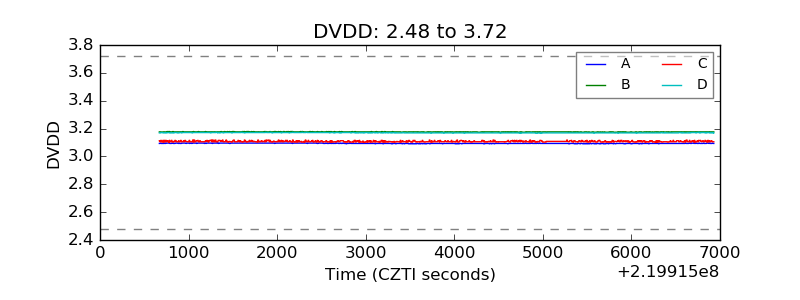 |
| Temperature 1 | 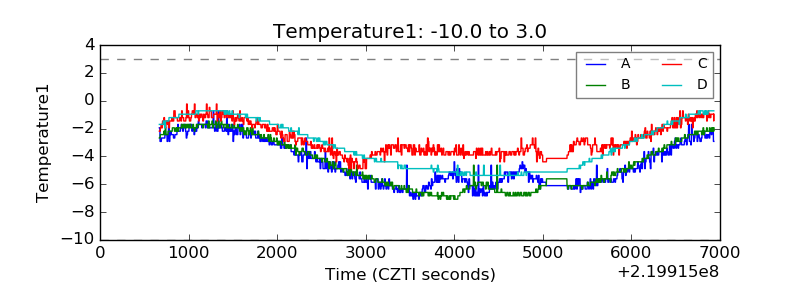 |
| Veto HV Monitor | 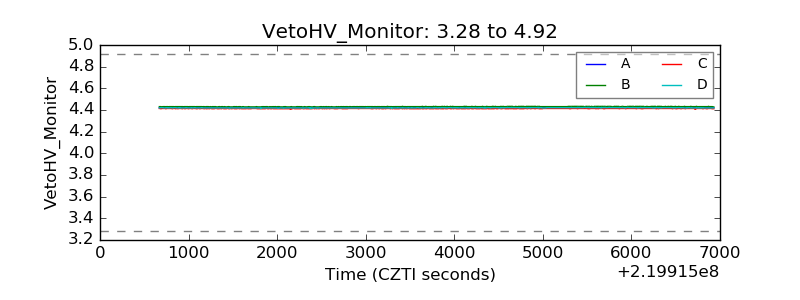 |
| Veto LLD | 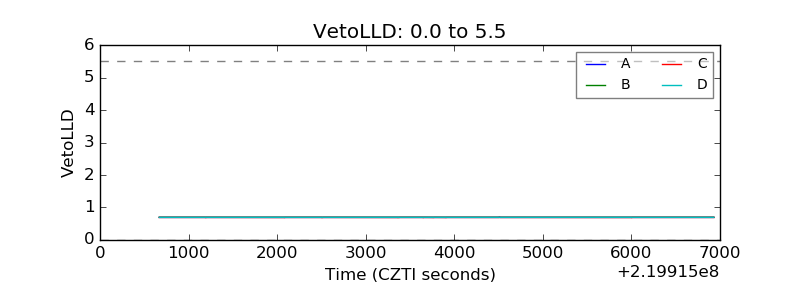 |
| Alpha Counter | 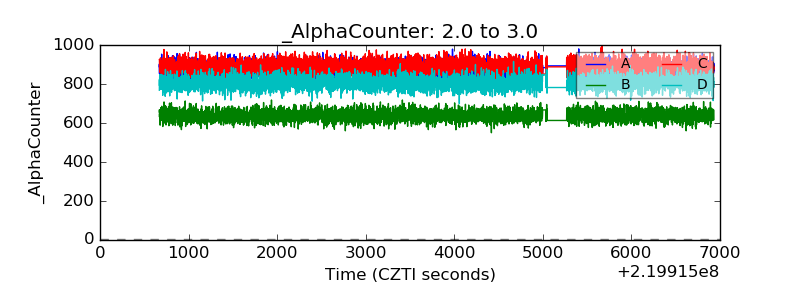 |
| _CPM_Rate | 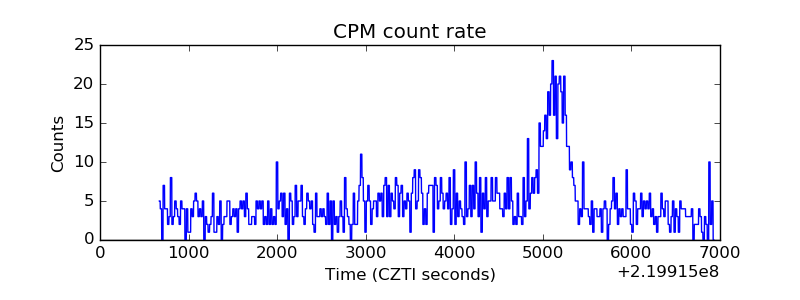 |
| CZT Counter | 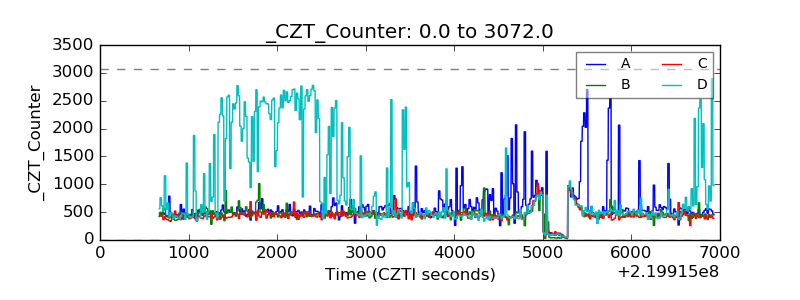 |
| +2.5 Volts monitor |  |
| +5 Volts monitor |  |
| _ROLL_ROT | 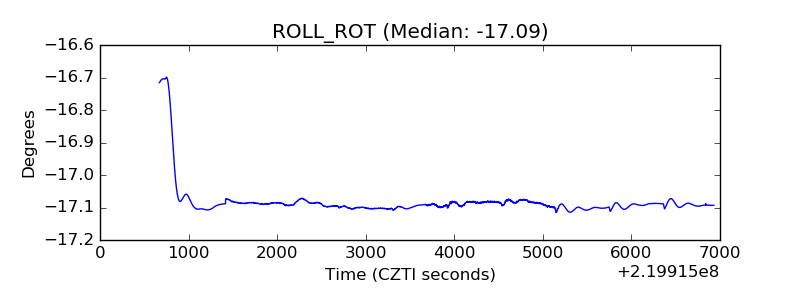 |
| _Roll_DEC | 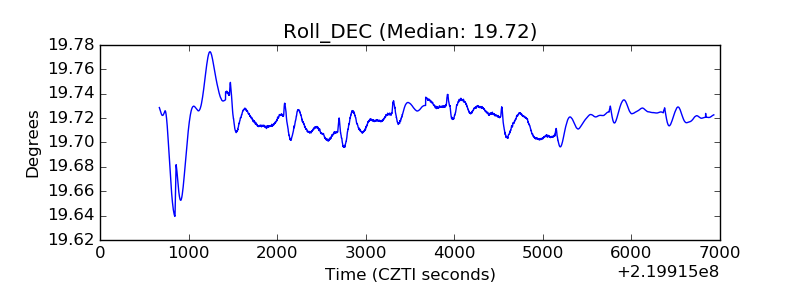 |
| _Roll_RA | 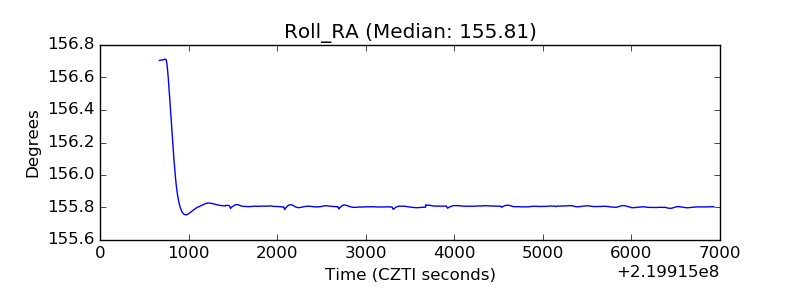 |
| Veto Counter | 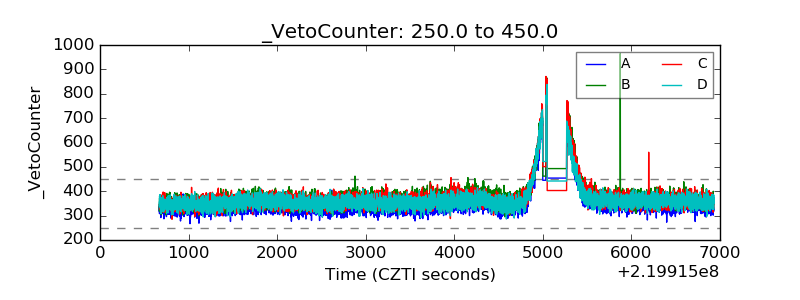 |