| Param | Original file | Final file |
|---|---|---|
| Filename | modeM0/AS1A02_103T01_9000000904_06652cztM0_level2.evt | modeM0/AS1A02_103T01_9000000904_06652cztM0_level2_quad_clean.evt |
| Size (bytes) | 1,422,316,800 | 187,312,320 |
| Size | 1.3 GB | 178.6 MB |
| Events in quadrant A | 9,542,103 | 1,124,612 |
| Events in quadrant B | 8,628,764 | 1,142,204 |
| Events in quadrant C | 7,925,629 | 1,127,432 |
| Events in quadrant D | 15,772,194 | 1,046,697 |
| Mode M0 | |||
|---|---|---|---|
| Quadrant | BADHDUFLAG | Total packets | Discarded packets |
| A | 0 | 39642 | 4 |
| B | 0 | 37307 | 3 |
| C | 0 | 36250 | 3 |
| D | 0 | 58668 | 3 |
| Mode M9 | |||
|---|---|---|---|
| Quadrant | BADHDUFLAG | Total packets | Discarded packets |
| A | 0 | 21 | 0 |
| B | 0 | 21 | 0 |
| C | 0 | 21 | 0 |
| D | 0 | 21 | 0 |
| Mode SS | |||
|---|---|---|---|
| Quadrant | BADHDUFLAG | Total packets | Discarded packets |
| A | 0 | 362 | 0 |
| B | 0 | 362 | 0 |
| C | 0 | 362 | 0 |
| D | 0 | 362 | 0 |
| Quadrant | Total seconds | Saturated seconds | Saturation percentage |
|---|---|---|---|
| A | 17868 | 307 | 1.718155% |
| B | 17868 | 213 | 1.192075% |
| C | 17868 | 168 | 0.940228% |
| D | 17868 | 2158 | 12.077457% |
Noise dominated data is calculated using 1-second bins in cleaned event files. If a bin has >2000 counts, and if more than 50% of those come from <1% of pixels, then it is considered to be noise-dominated and hence unusable.
| Quadrant | # 1 sec bins | Bins with >0 counts | Bins with >2000 counts | High rate bins dominated by noise | Noise dominated (total time) | Noise dominated (detector-on time) | Marked lightcurve |
|---|---|---|---|---|---|---|---|
| A | 19868 | 17872 | 66 | 66 | 0.33% | 0.37% | 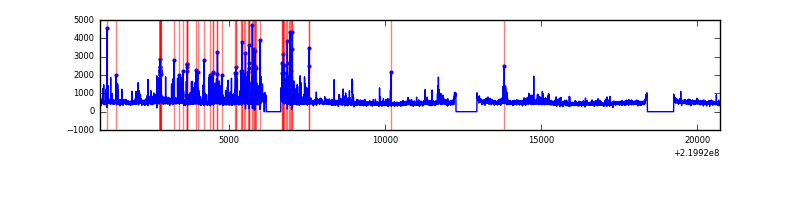 |
| B | 19868 | 17872 | 18 | 18 | 0.09% | 0.10% | 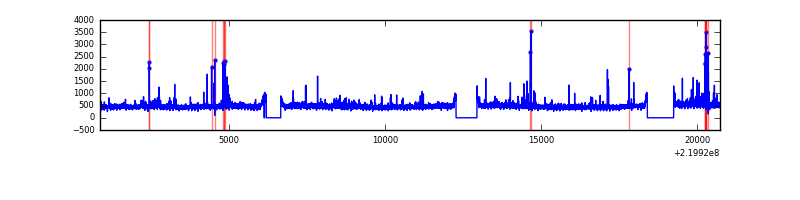 |
| C | 19868 | 17872 | 0 | 0 | 0.00% | 0.00% | 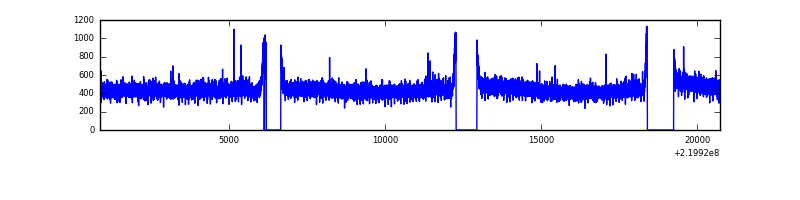 |
| D | 19868 | 17872 | 1595 | 1595 | 8.03% | 8.92% | 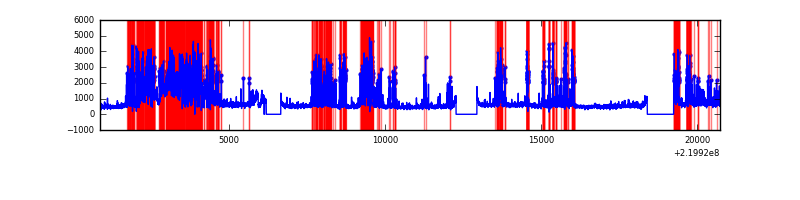 |
Top three noisy pixels from each quadrant. If the there are fewer than three noisy pixels in the level2.evt file, extra rows are filled as -1
| Pixel properties | Quadrant properties | ||||||
|---|---|---|---|---|---|---|---|
| Quadrant | DetID | PixID | Counts | Sigma | Mean | Median | Sigma |
| A | 8 | 15 | 1299831 | 3063.69 | 2079 | 2035 | 423.6 |
| A | 15 | 236 | 135298 | 314.59 | 2079 | 2035 | 423.6 |
| A | 13 | 248 | 47675 | 107.74 | 2079 | 2035 | 423.6 |
| B | 0 | 214 | 108406 | 264.27 | 2100 | 2044 | 402.5 |
| B | 4 | 80 | 94191 | 228.95 | 2100 | 2044 | 402.5 |
| B | 4 | 48 | 84714 | 205.4 | 2100 | 2044 | 402.5 |
| C | 13 | 61 | 15807 | 29.26 | 2027 | 2033 | 470.7 |
| C | 8 | 128 | 11495 | 20.1 | 2027 | 2033 | 470.7 |
| C | 8 | 112 | 6456 | 9.4 | 2027 | 2033 | 470.7 |
| D | 2 | 33 | 4750402 | 9955.74 | 1937 | 1878 | 477.0 |
| D | 12 | 221 | 2455177 | 5143.58 | 1937 | 1878 | 477.0 |
| D | 8 | 195 | 379329 | 791.36 | 1937 | 1878 | 477.0 |
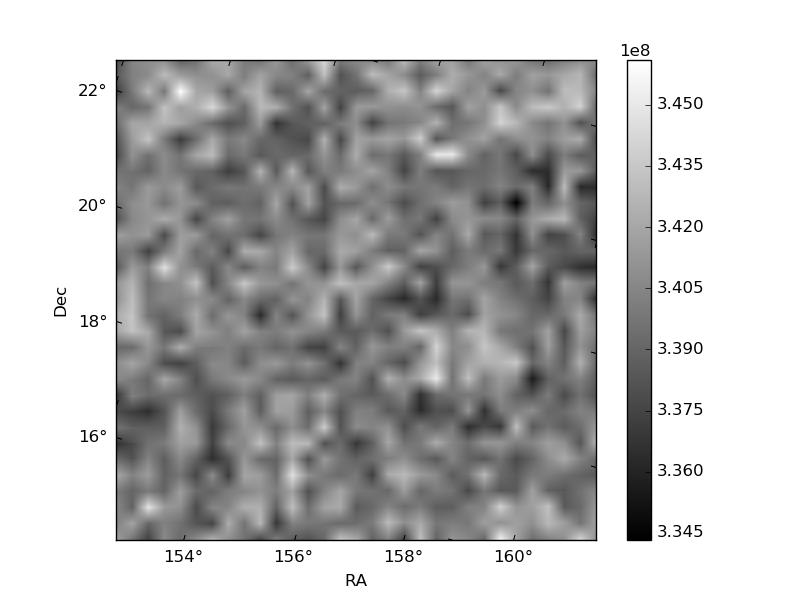
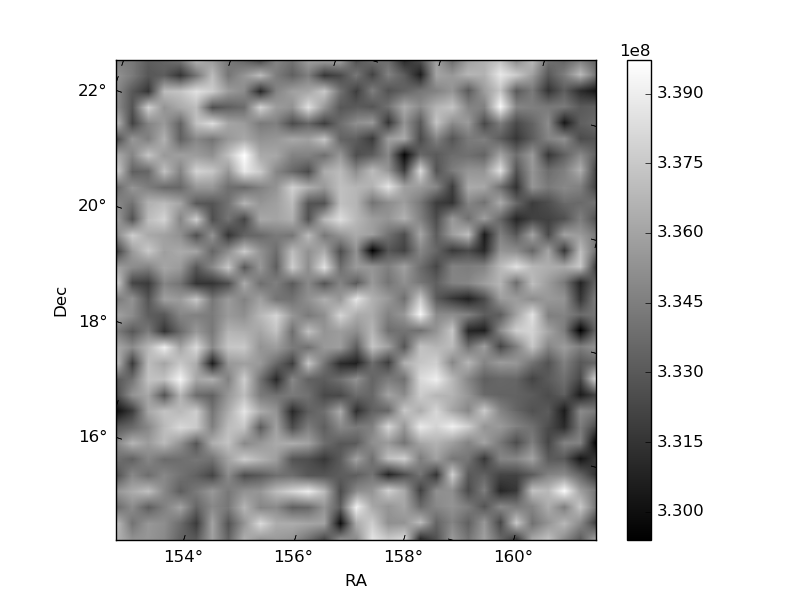
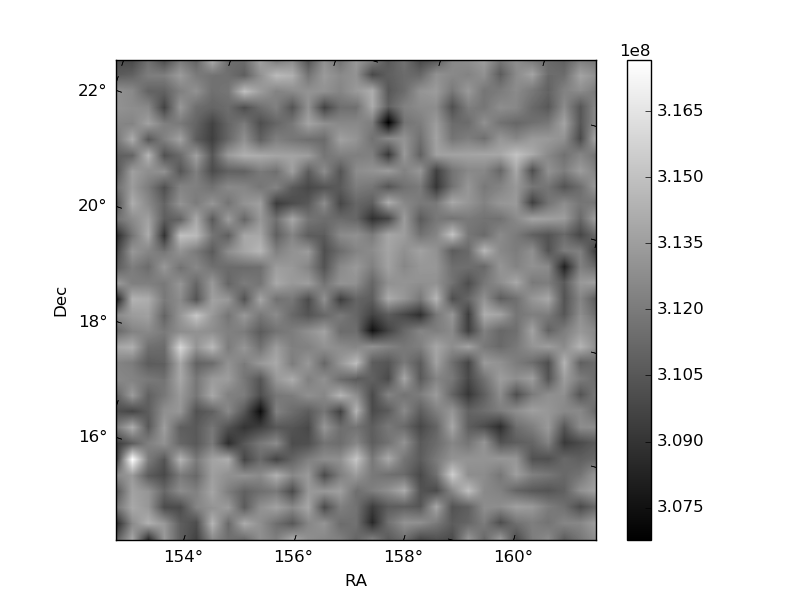
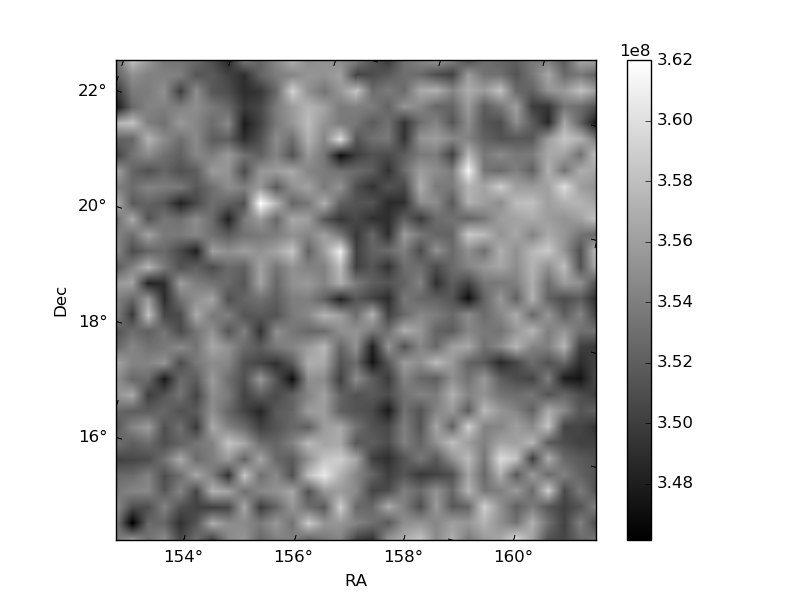
Histogram calculated using DETX and DETY for each event in the final _common_clean file
| Quadrant A | 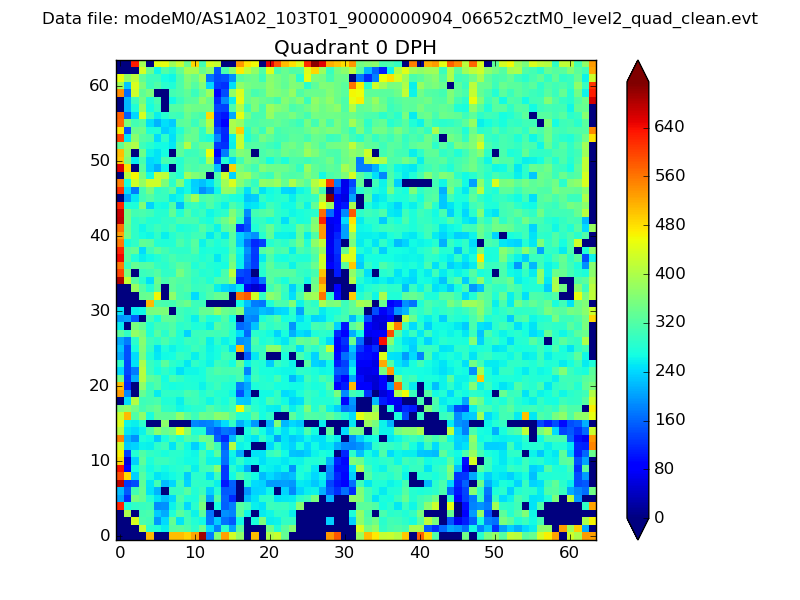 |
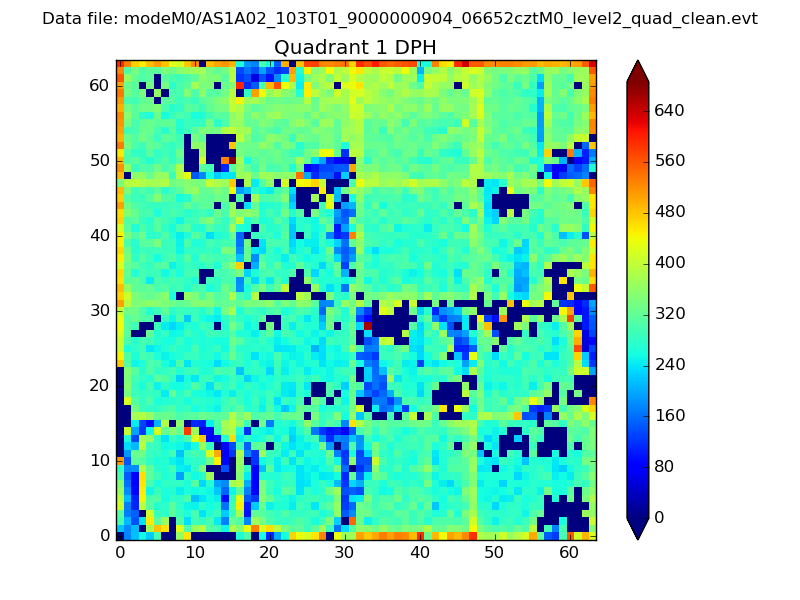 |
Quadrant B |
|---|---|---|---|
| Quadrant D | 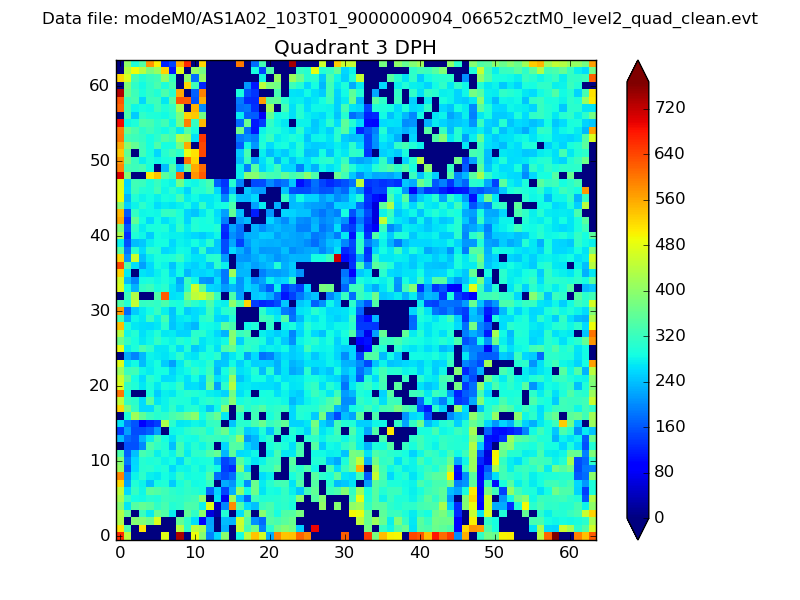 |
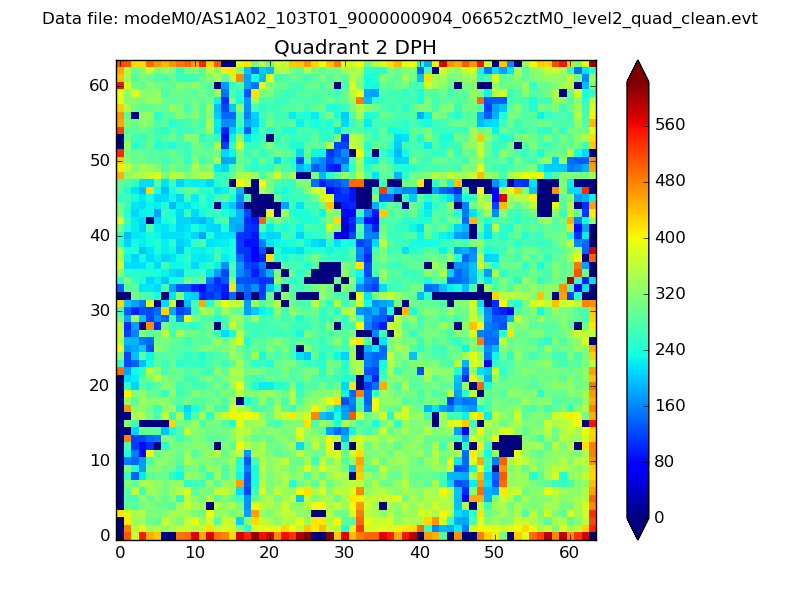 |
Quadrant C |
| Plot type | Count rate plots | Images |
|---|---|---|
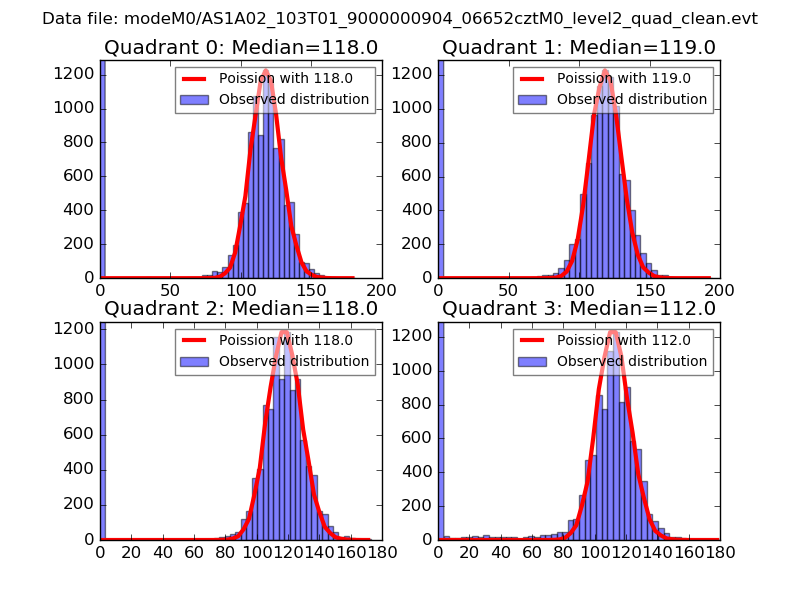
| Comparison with Poisson distribution Blue bars denote a histogram of data divided into 1 sec bins. Red curve is a Poisson curve with rate = median count rate of data. |
 |
 |
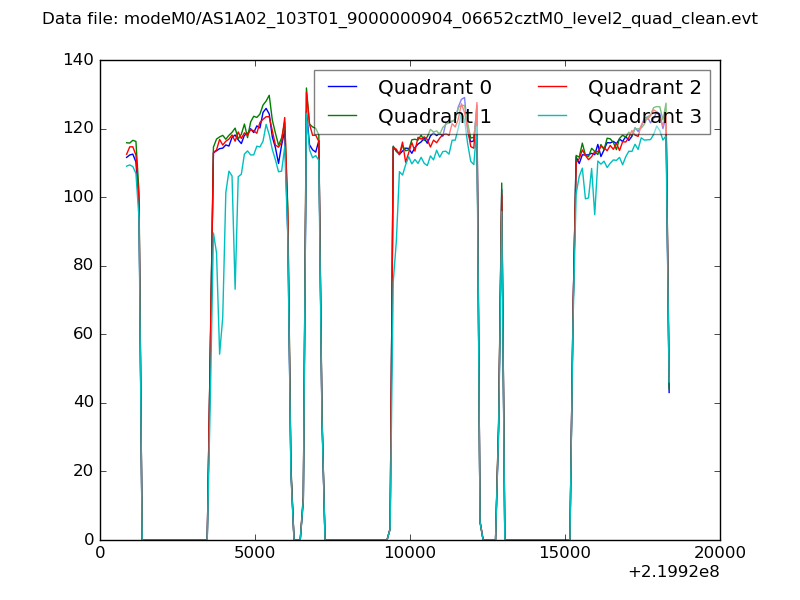
| Quadrant-wise count rates Data is divided into 100 sec bins |
 |
|
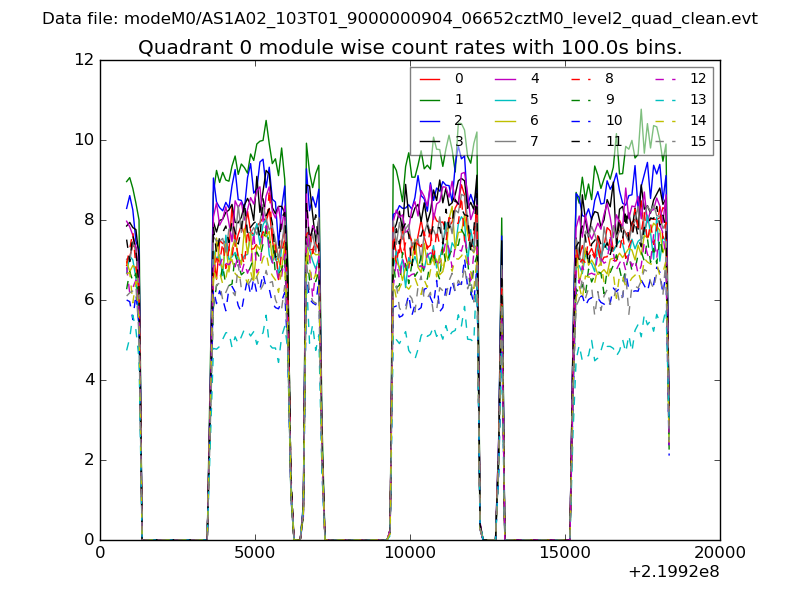
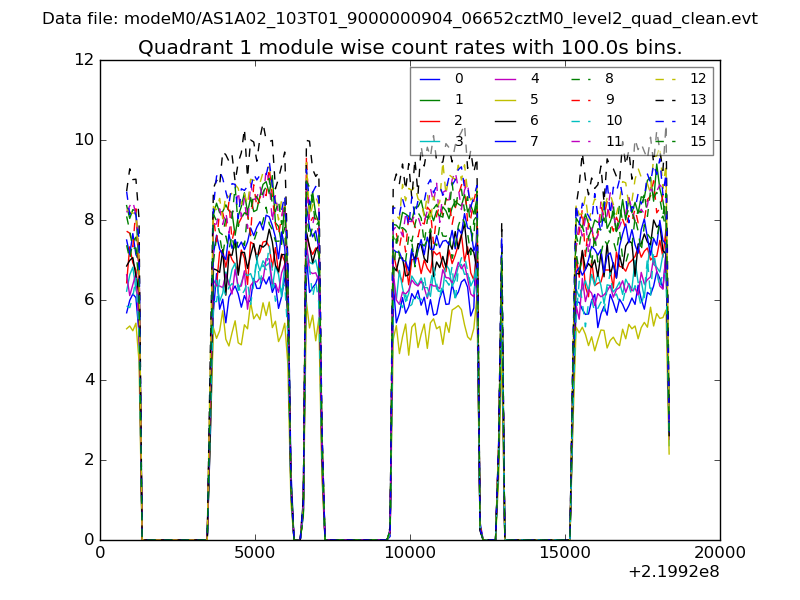
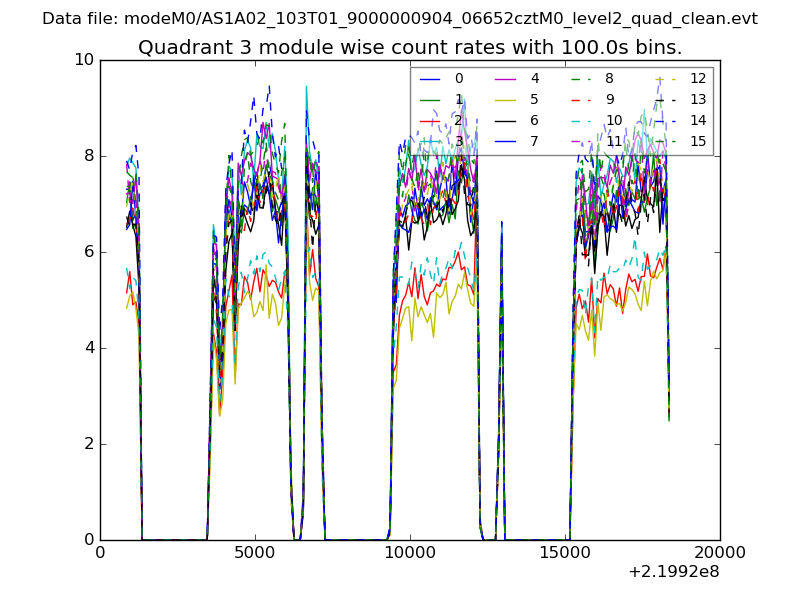
| Module-wise count rates for Quadrant A Data is divided into 100 sec bins |
 |
 |
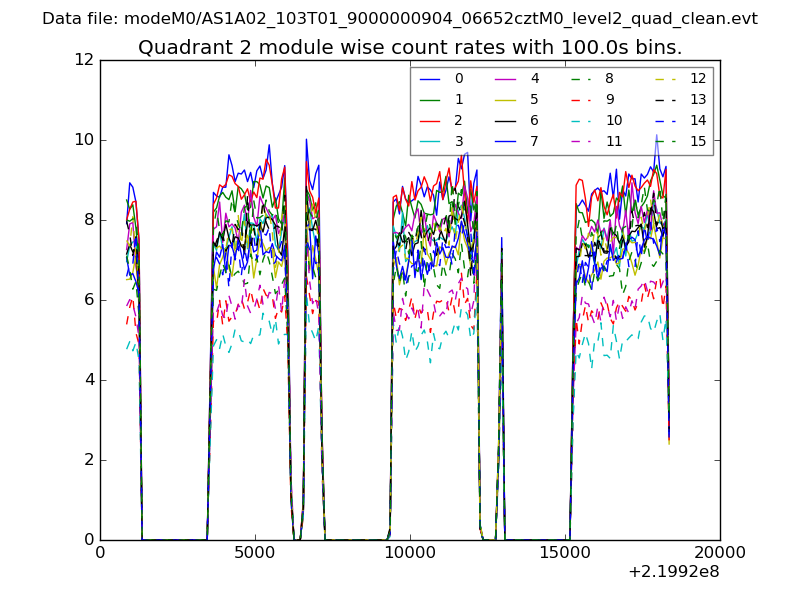
| Module-wise count rates for Quadrant B Data is divided into 100 sec bins |
 |
 |
| Module-wise count rates for Quadrant C Data is divided into 100 sec bins |
 |
 |
| Module-wise count rates for Quadrant D Data is divided into 100 sec bins |
 |
 |
| Parameter | Plot |
|---|---|
| CZT HV Monitor | 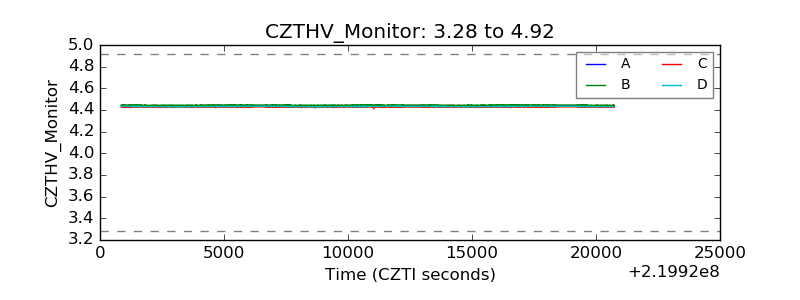 |
| D_VDD | 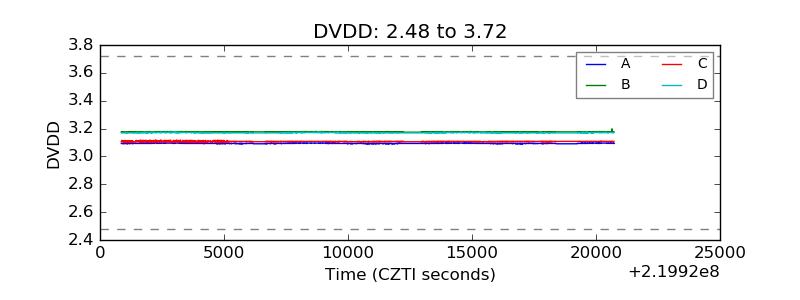 |
| Temperature 1 | 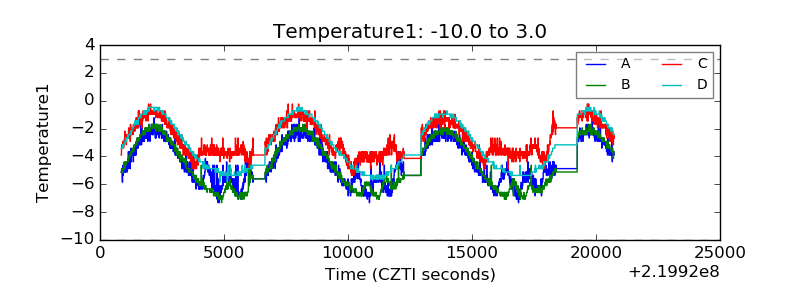 |
| Veto HV Monitor | 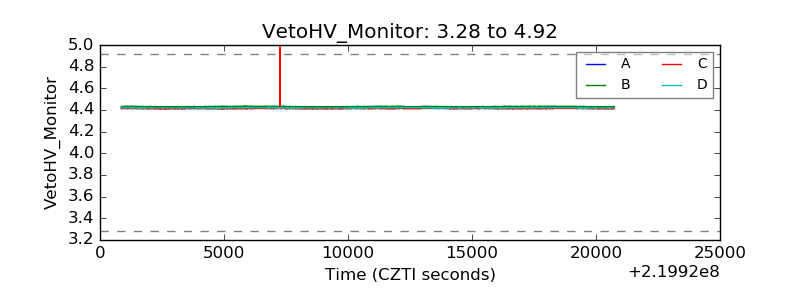 |
| Veto LLD | 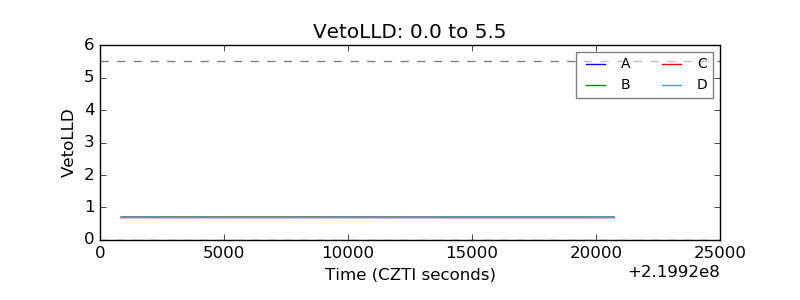 |
| Alpha Counter | 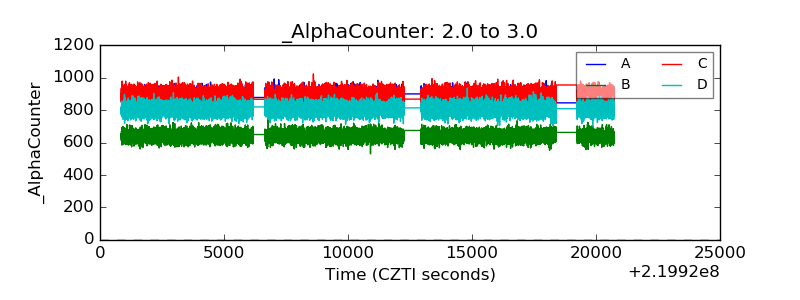 |
| _CPM_Rate | 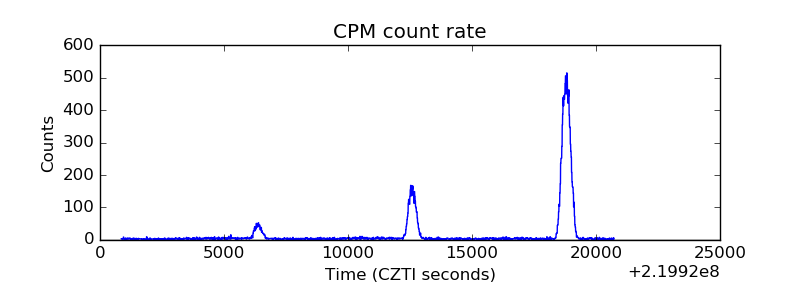 |
| CZT Counter | 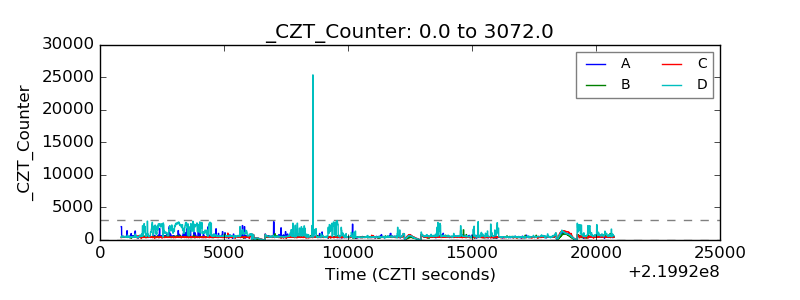 |
| +2.5 Volts monitor | 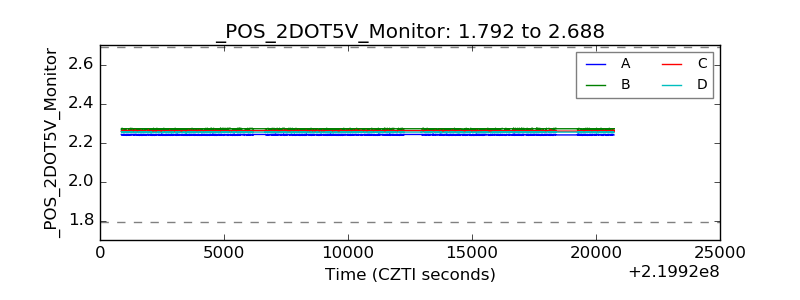 |
| +5 Volts monitor |  |
| _ROLL_ROT | 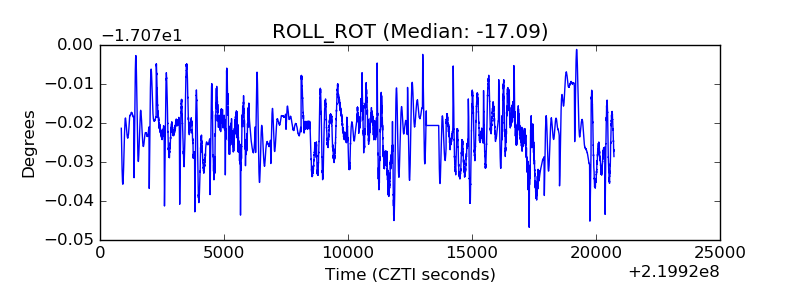 |
| _Roll_DEC | 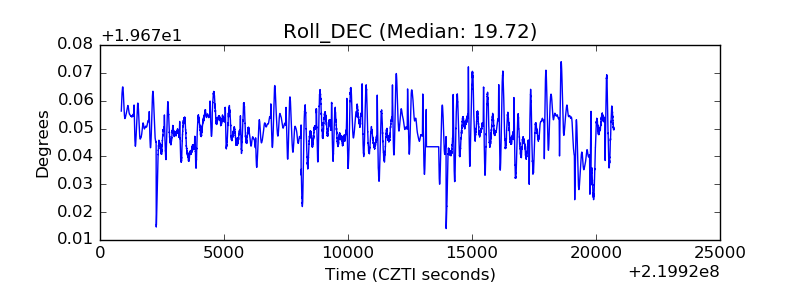 |
| _Roll_RA | 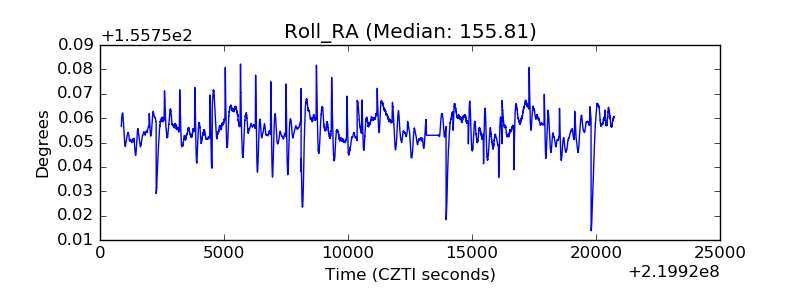 |
| Veto Counter | 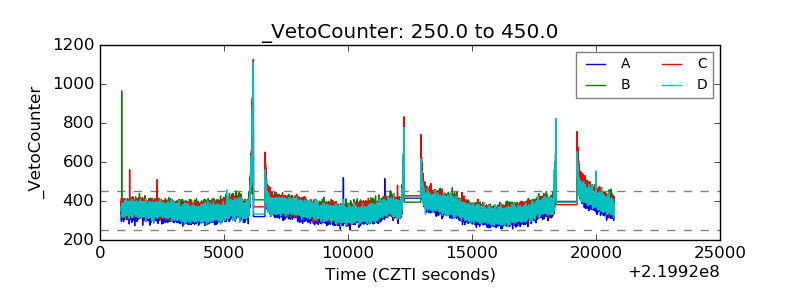 |