| Param | Original file | Final file |
|---|---|---|
| Filename | modeM0/AS1A02_103T01_9000000904_06655cztM0_level2.evt | modeM0/AS1A02_103T01_9000000904_06655cztM0_level2_quad_clean.evt |
| Size (bytes) | 550,687,680 | 81,786,240 |
| Size | 525.2 MB | 78.0 MB |
| Events in quadrant A | 3,366,005 | 508,670 |
| Events in quadrant B | 3,429,859 | 518,005 |
| Events in quadrant C | 3,332,565 | 510,156 |
| Events in quadrant D | 6,086,881 | 464,411 |
| Mode M0 | |||
|---|---|---|---|
| Quadrant | BADHDUFLAG | Total packets | Discarded packets |
| A | 0 | 14609 | 3 |
| B | 0 | 14787 | 2 |
| C | 0 | 14434 | 2 |
| D | 0 | 22938 | 2 |
| Mode M9 | |||
|---|---|---|---|
| Quadrant | BADHDUFLAG | Total packets | Discarded packets |
| A | 0 | 22 | 0 |
| B | 0 | 22 | 0 |
| C | 0 | 22 | 0 |
| D | 0 | 22 | 0 |
| Mode SS | |||
|---|---|---|---|
| Quadrant | BADHDUFLAG | Total packets | Discarded packets |
| A | 0 | 138 | 0 |
| B | 0 | 138 | 0 |
| C | 0 | 138 | 0 |
| D | 0 | 138 | 0 |
| Quadrant | Total seconds | Saturated seconds | Saturation percentage |
|---|---|---|---|
| A | 6827 | 80 | 1.171818% |
| B | 6827 | 65 | 0.952102% |
| C | 6827 | 61 | 0.893511% |
| D | 6827 | 660 | 9.667497% |
Noise dominated data is calculated using 1-second bins in cleaned event files. If a bin has >2000 counts, and if more than 50% of those come from <1% of pixels, then it is considered to be noise-dominated and hence unusable.
| Quadrant | # 1 sec bins | Bins with >0 counts | Bins with >2000 counts | High rate bins dominated by noise | Noise dominated (total time) | Noise dominated (detector-on time) | Marked lightcurve |
|---|---|---|---|---|---|---|---|
| A | 8972 | 6829 | 5 | 5 | 0.06% | 0.07% | 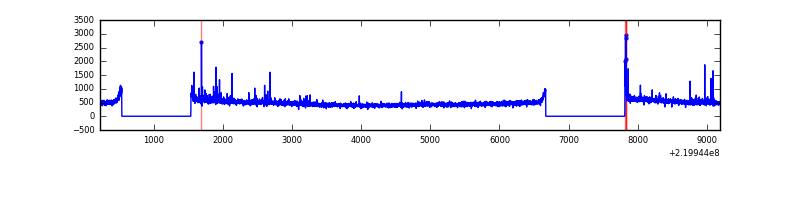 |
| B | 8972 | 6829 | 2 | 2 | 0.02% | 0.03% | 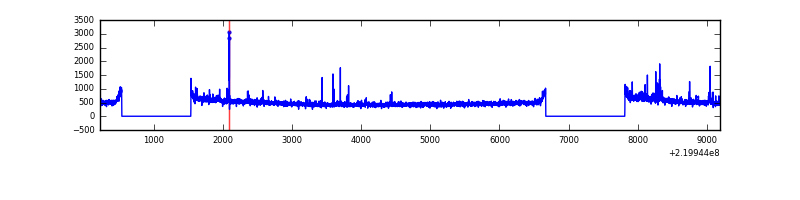 |
| C | 8972 | 6829 | 5 | 5 | 0.06% | 0.07% | 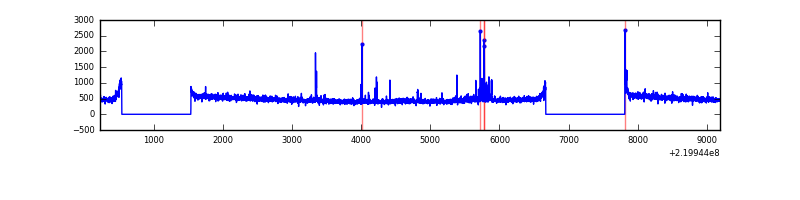 |
| D | 8972 | 6829 | 520 | 520 | 5.80% | 7.61% | 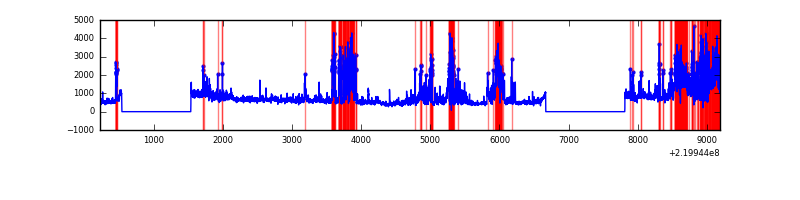 |
Top three noisy pixels from each quadrant. If the there are fewer than three noisy pixels in the level2.evt file, extra rows are filled as -1
| Pixel properties | Quadrant properties | ||||||
|---|---|---|---|---|---|---|---|
| Quadrant | DetID | PixID | Counts | Sigma | Mean | Median | Sigma |
| A | 8 | 15 | 90211 | 521.69 | 835 | 817 | 171.4 |
| A | 15 | 239 | 30816 | 175.07 | 835 | 817 | 171.4 |
| A | 14 | 111 | 11884 | 64.59 | 835 | 817 | 171.4 |
| B | 4 | 81 | 24902 | 148.12 | 844 | 824 | 162.6 |
| B | 4 | 48 | 20775 | 122.73 | 844 | 824 | 162.6 |
| B | 0 | 214 | 19381 | 114.16 | 844 | 824 | 162.6 |
| C | 9 | 247 | 114072 | 594.38 | 817 | 823 | 190.5 |
| C | 4 | 254 | 26232 | 133.36 | 817 | 823 | 190.5 |
| C | 1 | 16 | 6865 | 31.71 | 817 | 823 | 190.5 |
| D | 2 | 33 | 1758460 | 8991.53 | 789 | 765 | 195.5 |
| D | 12 | 221 | 520619 | 2659.33 | 789 | 765 | 195.5 |
| D | 8 | 195 | 373184 | 1905.12 | 789 | 765 | 195.5 |
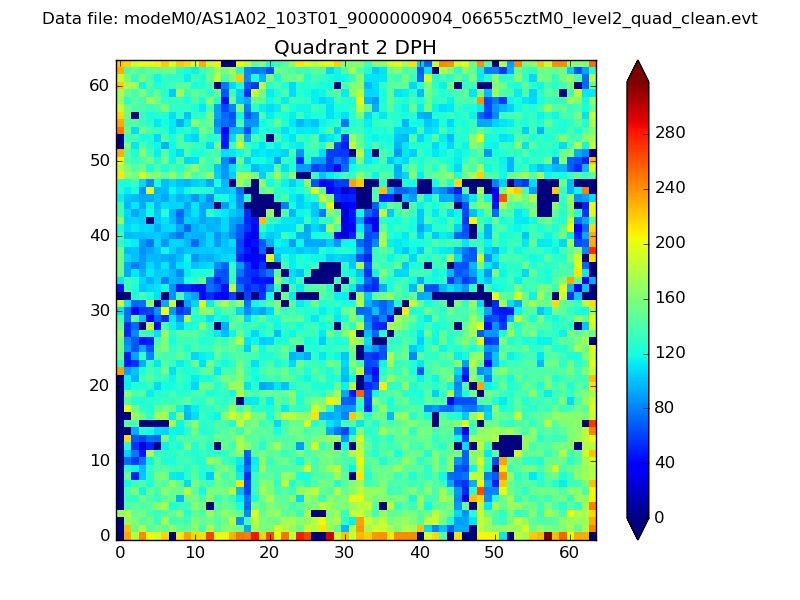
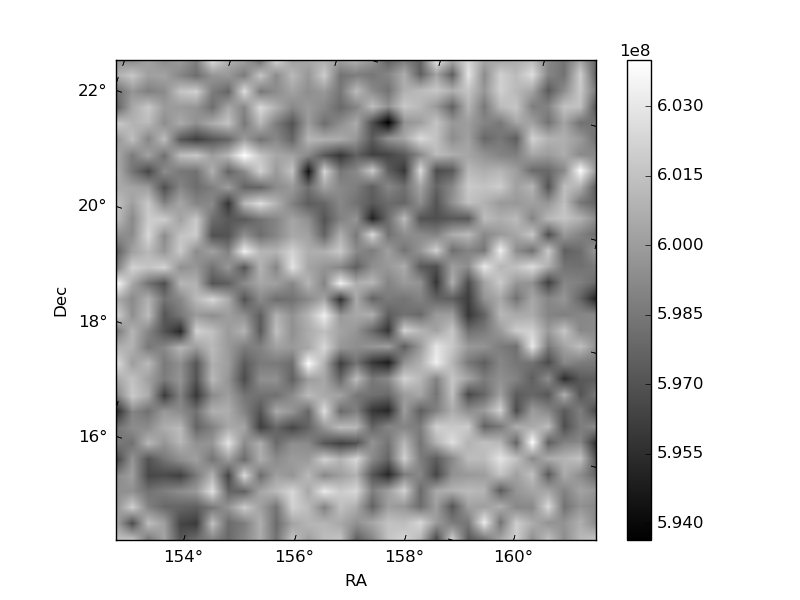
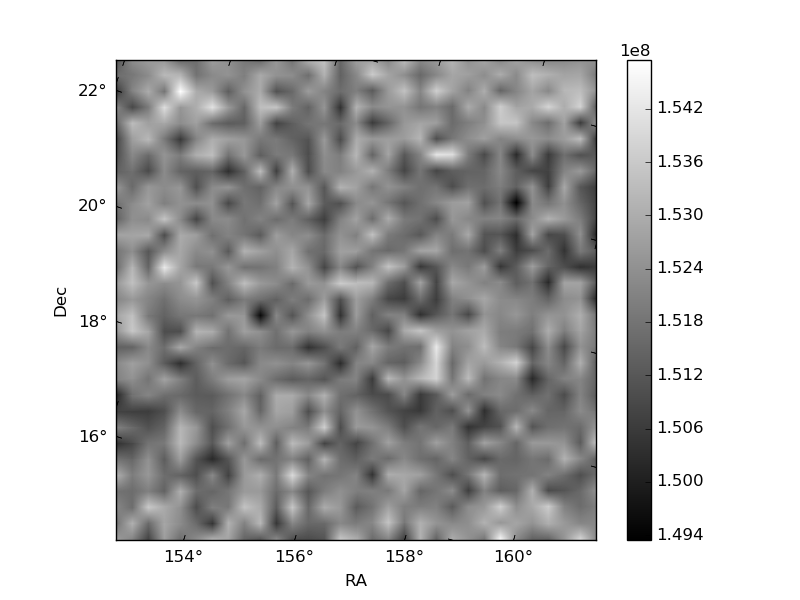
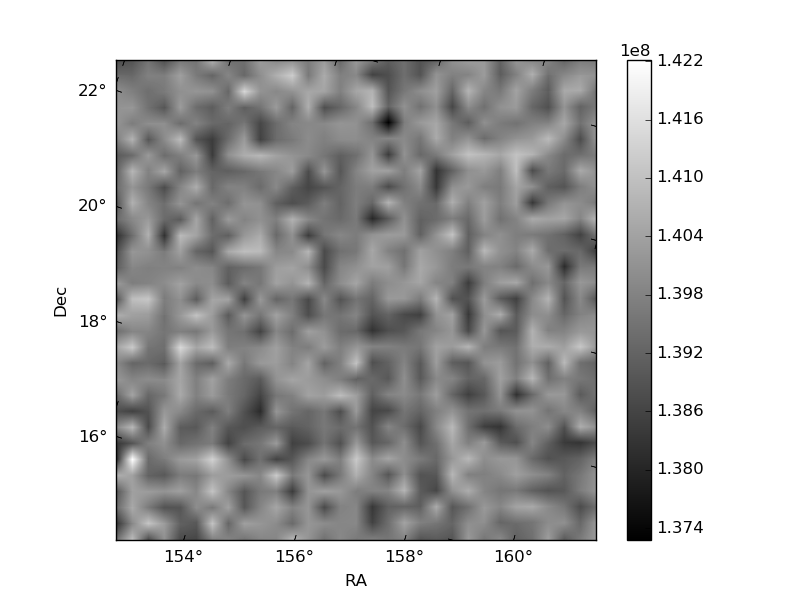
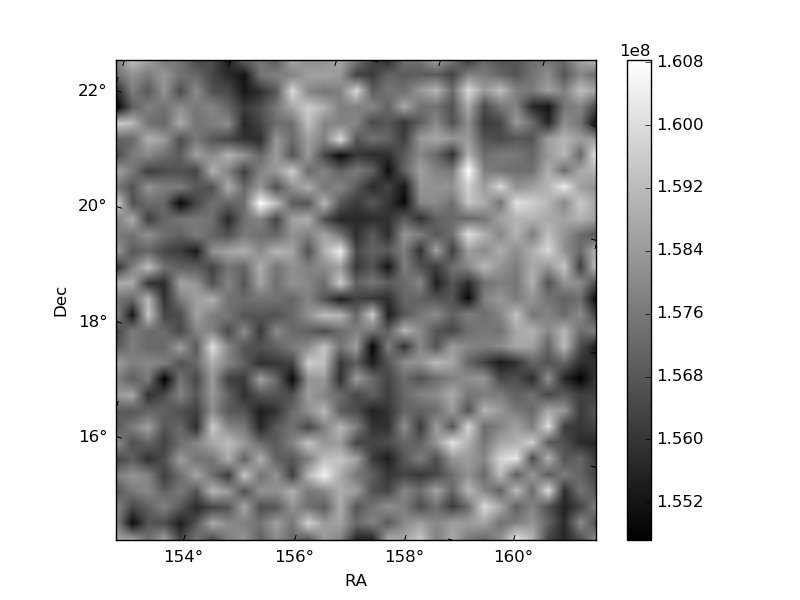
Histogram calculated using DETX and DETY for each event in the final _common_clean file
| Quadrant A | 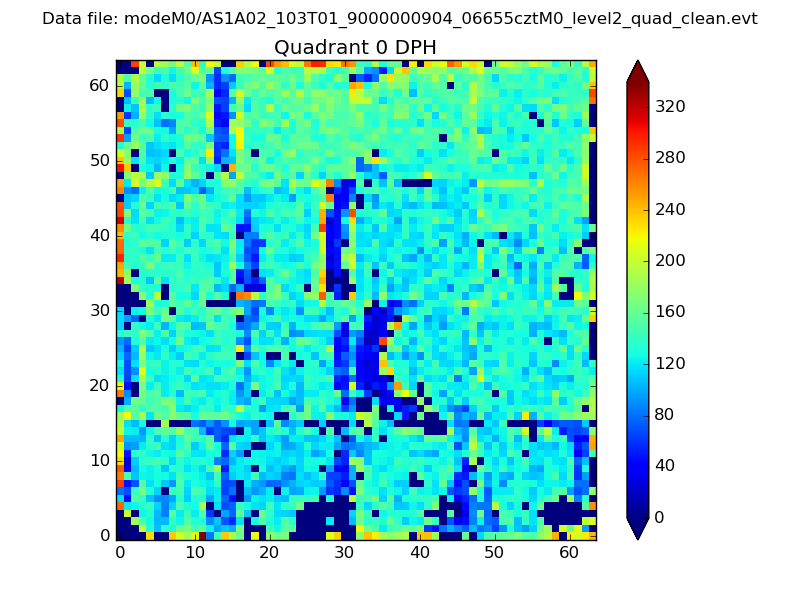 |
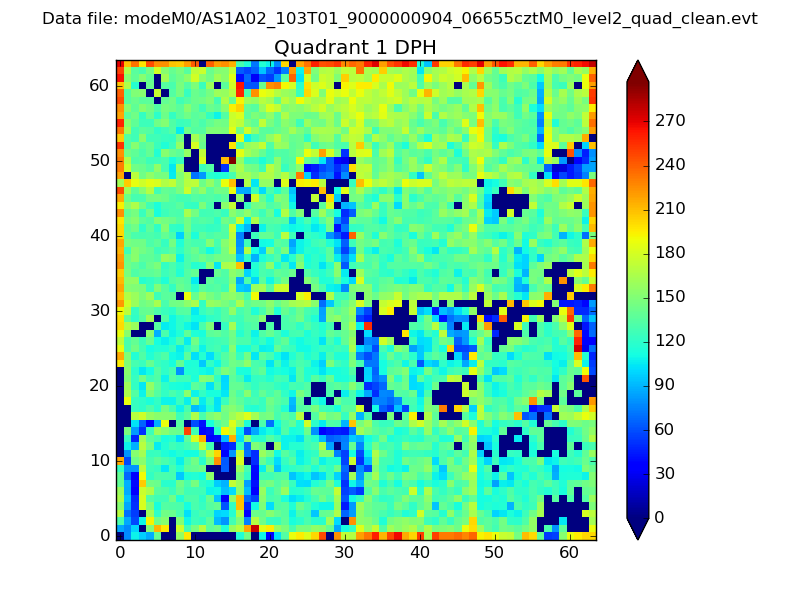 |
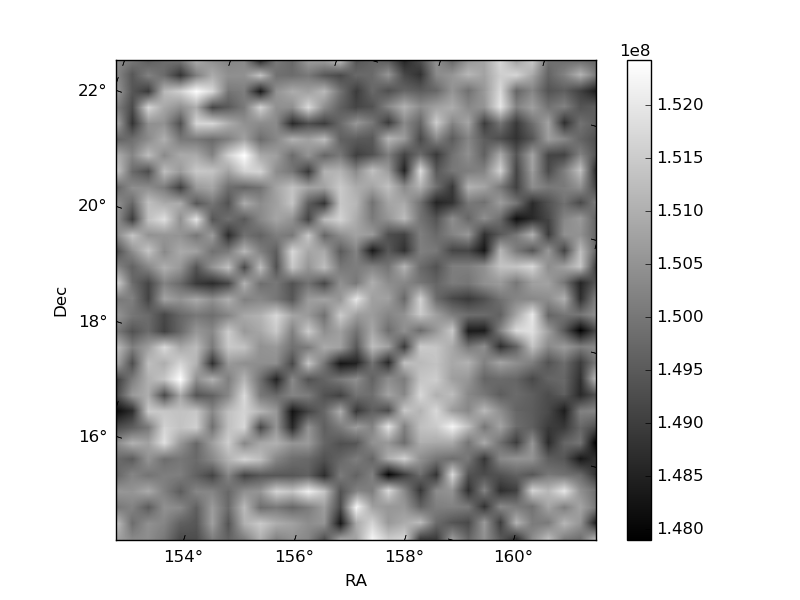
Quadrant B |
|---|---|---|---|
| Quadrant D | 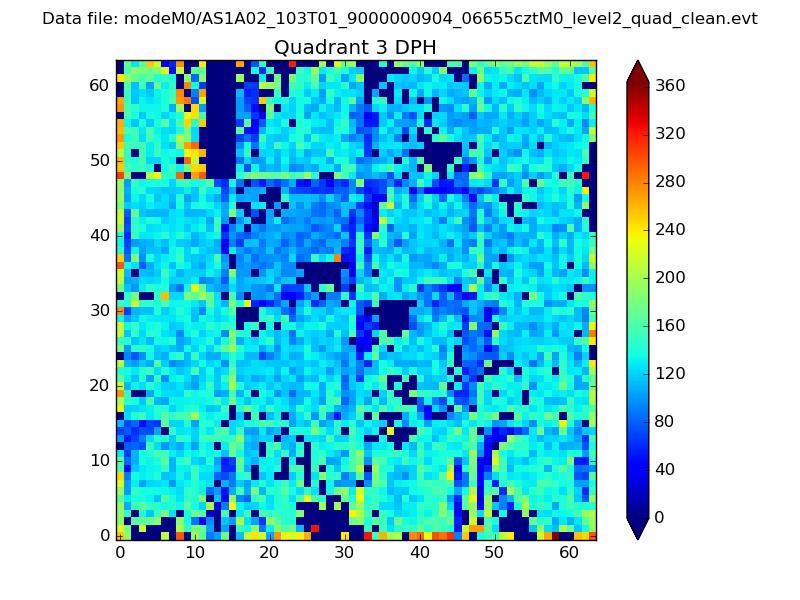 |
 |
Quadrant C |
| Plot type | Count rate plots | Images |
|---|---|---|
| Comparison with Poisson distribution Blue bars denote a histogram of data divided into 1 sec bins. Red curve is a Poisson curve with rate = median count rate of data. |
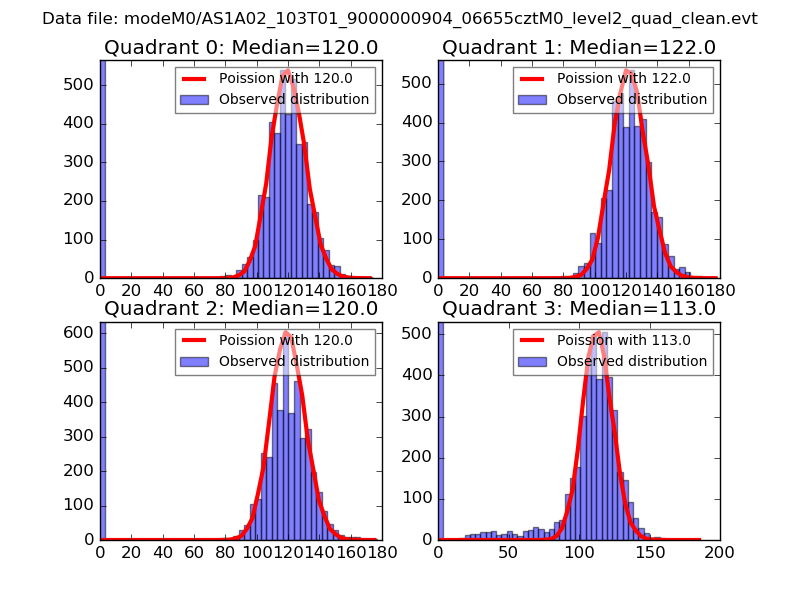 |
 |
| Quadrant-wise count rates Data is divided into 100 sec bins |
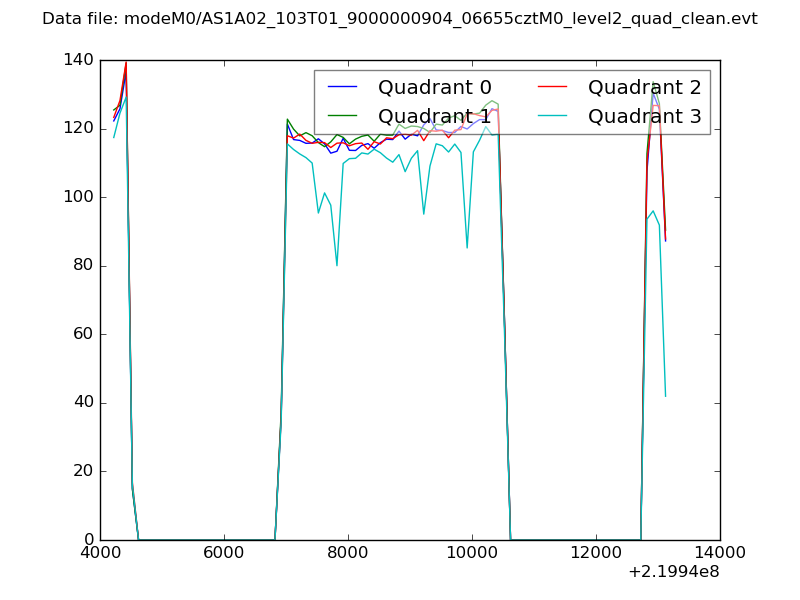 |
|
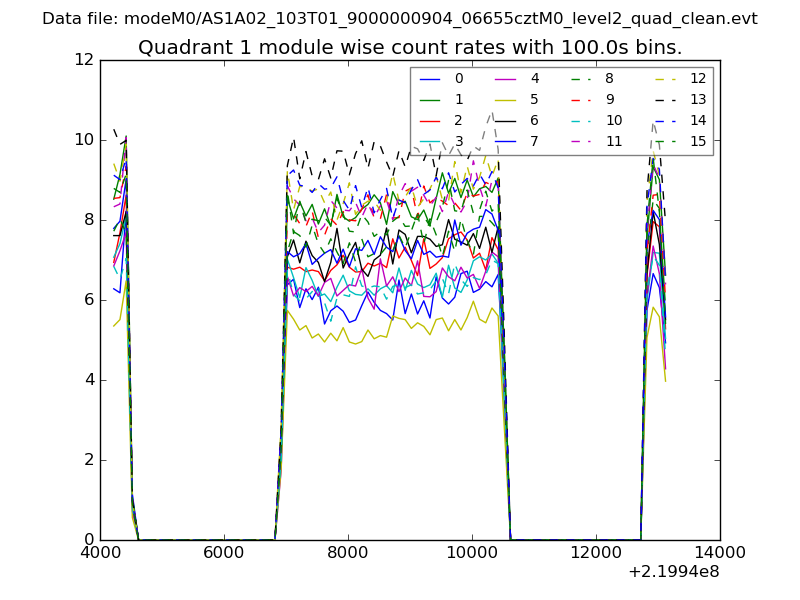
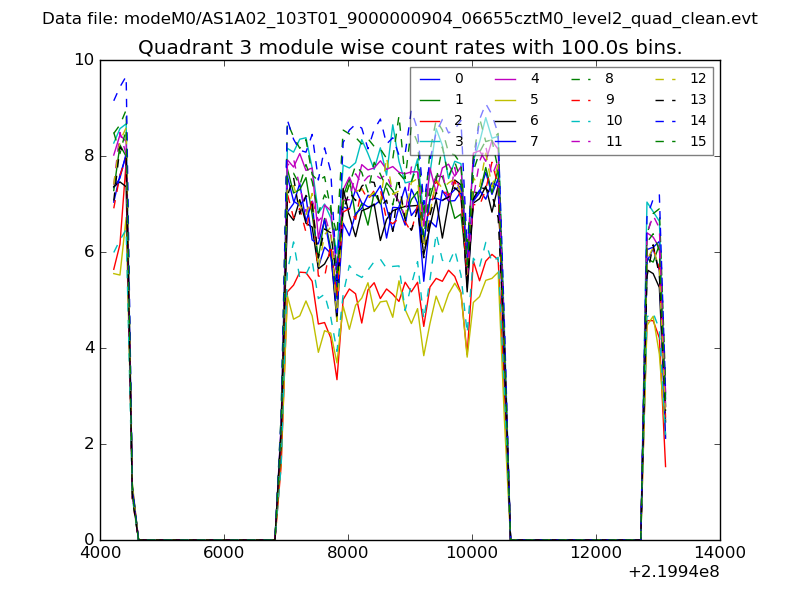
| Module-wise count rates for Quadrant A Data is divided into 100 sec bins |
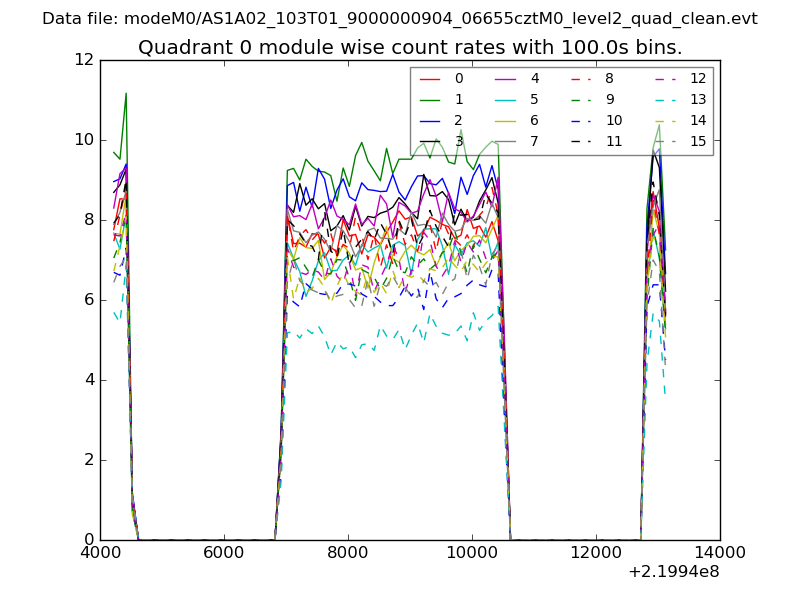 |
 |
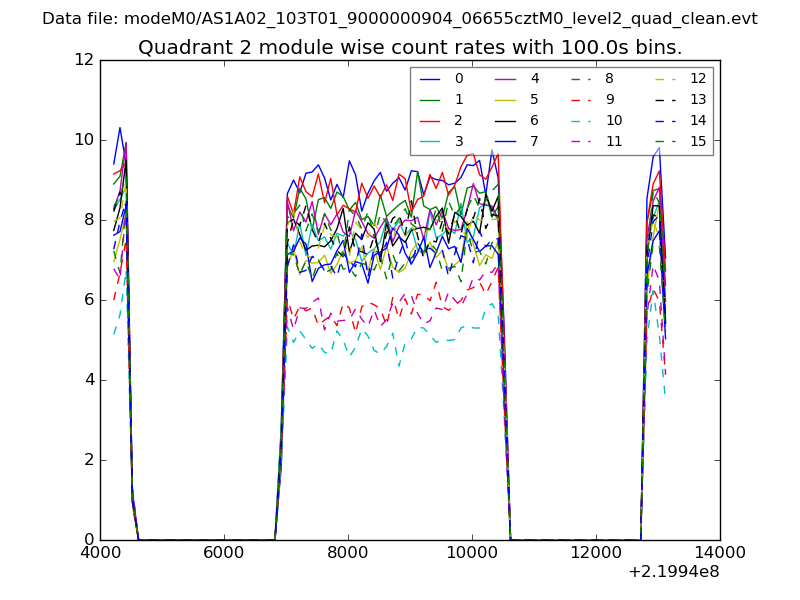
| Module-wise count rates for Quadrant B Data is divided into 100 sec bins |
 |
 |
| Module-wise count rates for Quadrant C Data is divided into 100 sec bins |
 |
 |
| Module-wise count rates for Quadrant D Data is divided into 100 sec bins |
 |
 |
| Parameter | Plot |
|---|---|
| CZT HV Monitor | 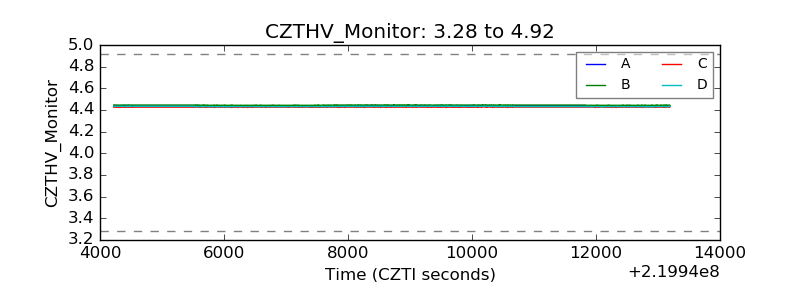 |
| D_VDD | 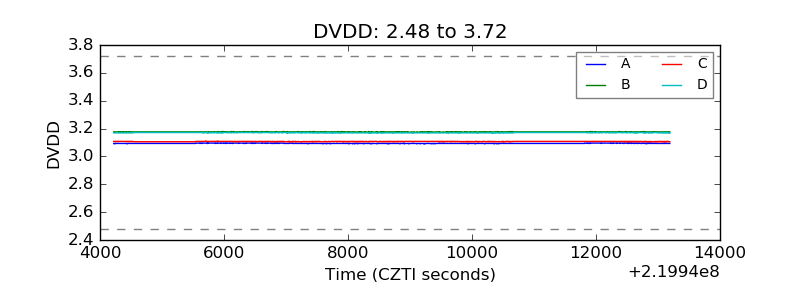 |
| Temperature 1 | 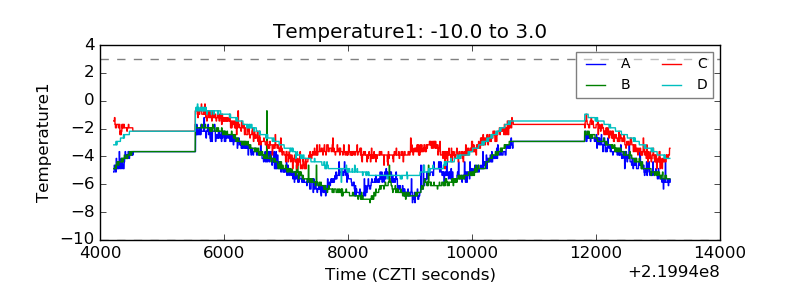 |
| Veto HV Monitor | 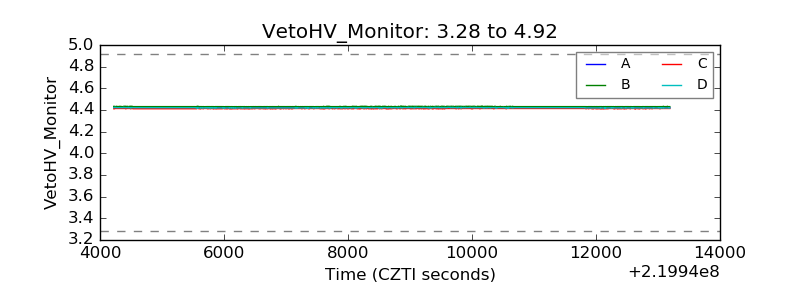 |
| Veto LLD | 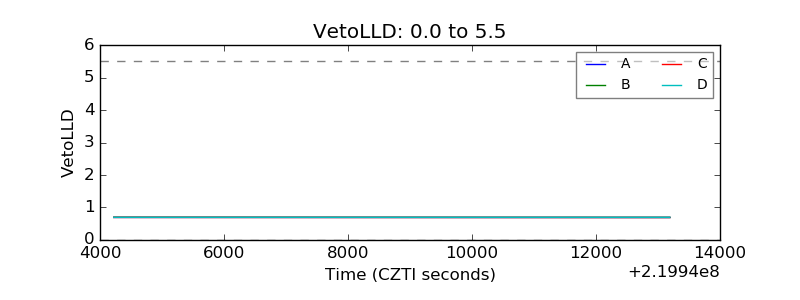 |
| Alpha Counter | 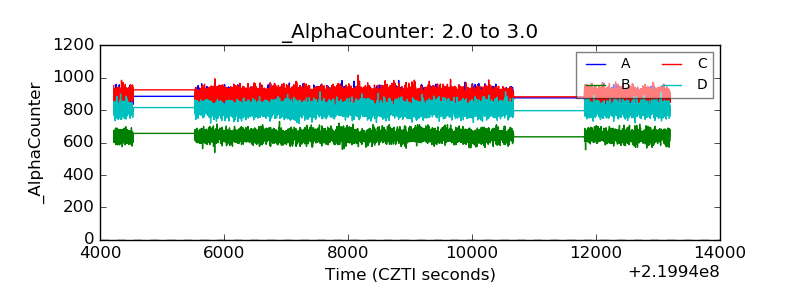 |
| _CPM_Rate | 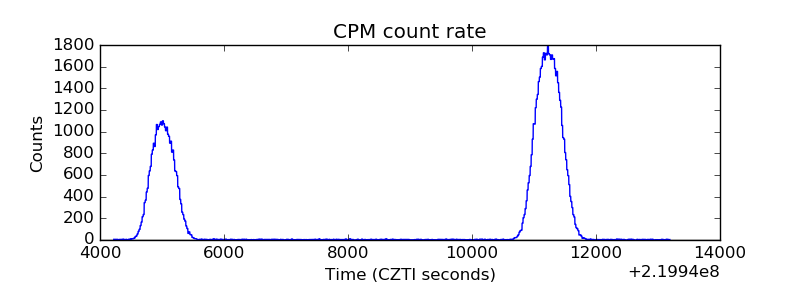 |
| CZT Counter | 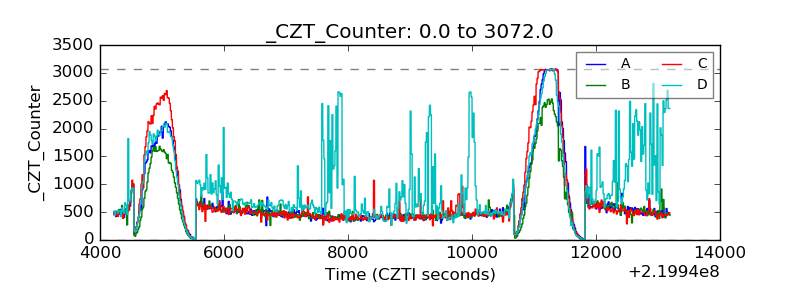 |
| +2.5 Volts monitor | 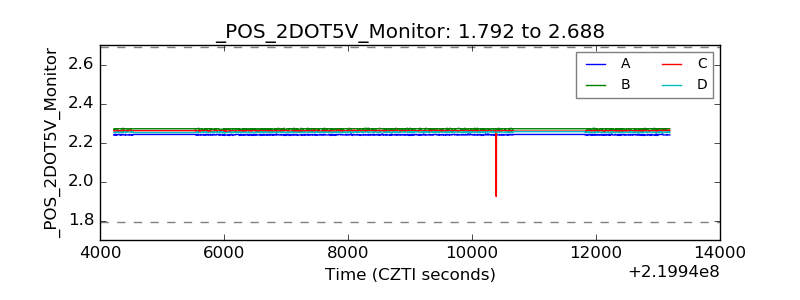 |
| +5 Volts monitor |  |
| _ROLL_ROT | 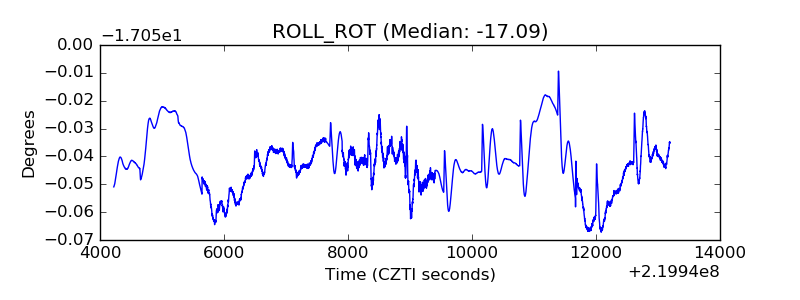 |
| _Roll_DEC | 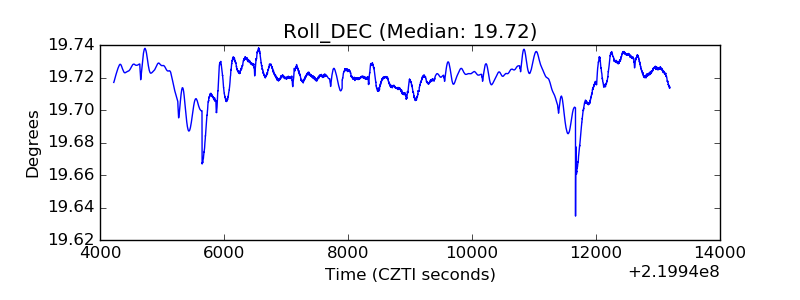 |
| _Roll_RA | 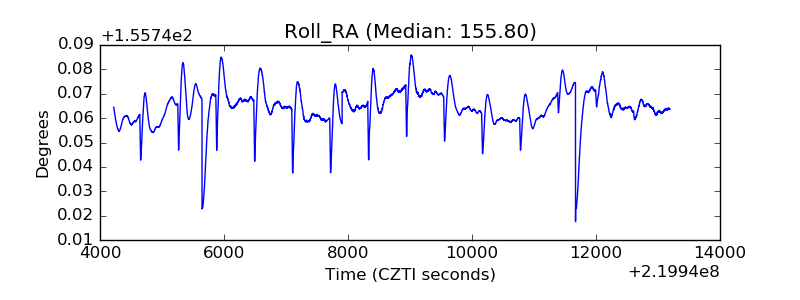 |
| Veto Counter | 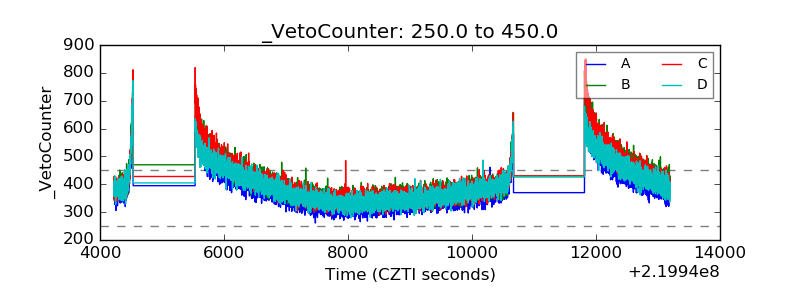 |