| Param | Original file | Final file |
|---|---|---|
| Filename | modeM0/AS1A02_103T01_9000000904_06656cztM0_level2.evt | modeM0/AS1A02_103T01_9000000904_06656cztM0_level2_quad_clean.evt |
| Size (bytes) | 506,856,960 | 83,116,800 |
| Size | 483.4 MB | 79.3 MB |
| Events in quadrant A | 3,187,790 | 527,284 |
| Events in quadrant B | 3,270,175 | 539,777 |
| Events in quadrant C | 3,154,200 | 528,867 |
| Events in quadrant D | 5,308,942 | 479,587 |
| Mode M0 | |||
|---|---|---|---|
| Quadrant | BADHDUFLAG | Total packets | Discarded packets |
| A | 0 | 13608 | 3 |
| B | 0 | 14007 | 2 |
| C | 0 | 13509 | 2 |
| D | 0 | 20177 | 2 |
| Mode M9 | |||
|---|---|---|---|
| Quadrant | BADHDUFLAG | Total packets | Discarded packets |
| A | 0 | 24 | 0 |
| B | 0 | 24 | 0 |
| C | 0 | 24 | 0 |
| D | 0 | 24 | 0 |
| Mode SS | |||
|---|---|---|---|
| Quadrant | BADHDUFLAG | Total packets | Discarded packets |
| A | 0 | 130 | 0 |
| B | 0 | 130 | 0 |
| C | 0 | 130 | 0 |
| D | 0 | 130 | 0 |
| Quadrant | Total seconds | Saturated seconds | Saturation percentage |
|---|---|---|---|
| A | 6325 | 75 | 1.185771% |
| B | 6325 | 79 | 1.249012% |
| C | 6325 | 54 | 0.853755% |
| D | 6325 | 643 | 10.166008% |
Noise dominated data is calculated using 1-second bins in cleaned event files. If a bin has >2000 counts, and if more than 50% of those come from <1% of pixels, then it is considered to be noise-dominated and hence unusable.
| Quadrant | # 1 sec bins | Bins with >0 counts | Bins with >2000 counts | High rate bins dominated by noise | Noise dominated (total time) | Noise dominated (detector-on time) | Marked lightcurve |
|---|---|---|---|---|---|---|---|
| A | 8705 | 6327 | 4 | 4 | 0.05% | 0.06% | 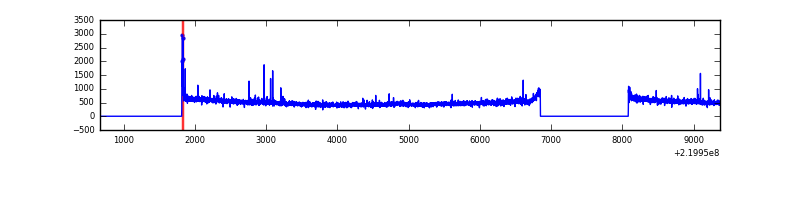 |
| B | 8705 | 6327 | 7 | 7 | 0.08% | 0.11% | 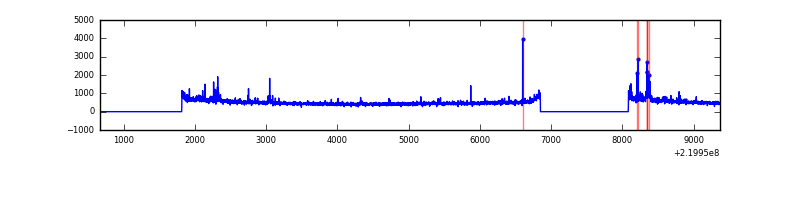 |
| C | 8705 | 6327 | 1 | 1 | 0.01% | 0.02% | 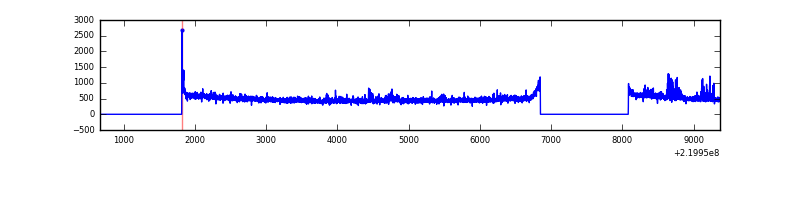 |
| D | 8705 | 6327 | 503 | 503 | 5.78% | 7.95% | 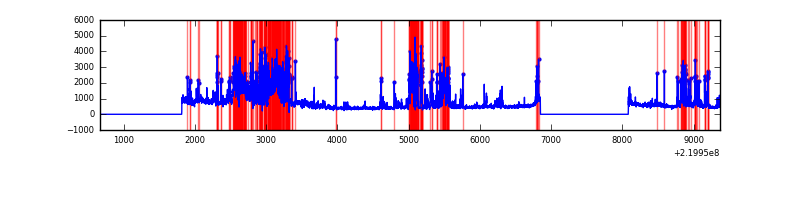 |
Top three noisy pixels from each quadrant. If the there are fewer than three noisy pixels in the level2.evt file, extra rows are filled as -1
| Pixel properties | Quadrant properties | ||||||
|---|---|---|---|---|---|---|---|
| Quadrant | DetID | PixID | Counts | Sigma | Mean | Median | Sigma |
| A | 8 | 15 | 142468 | 901.53 | 775 | 759 | 157.2 |
| A | 15 | 239 | 29065 | 180.08 | 775 | 759 | 157.2 |
| A | 13 | 248 | 14295 | 86.11 | 775 | 759 | 157.2 |
| B | 0 | 228 | 58646 | 388.16 | 788 | 770 | 149.1 |
| B | 4 | 81 | 52945 | 349.93 | 788 | 770 | 149.1 |
| B | 0 | 245 | 23591 | 153.06 | 788 | 770 | 149.1 |
| C | 9 | 247 | 110256 | 625.7 | 759 | 765 | 175.0 |
| C | 4 | 254 | 69559 | 393.13 | 759 | 765 | 175.0 |
| C | 1 | 16 | 12966 | 69.72 | 759 | 765 | 175.0 |
| D | 2 | 33 | 1948033 | 10801.96 | 729 | 707 | 180.3 |
| D | 8 | 195 | 289360 | 1601.18 | 729 | 707 | 180.3 |
| D | 12 | 221 | 132835 | 732.92 | 729 | 707 | 180.3 |
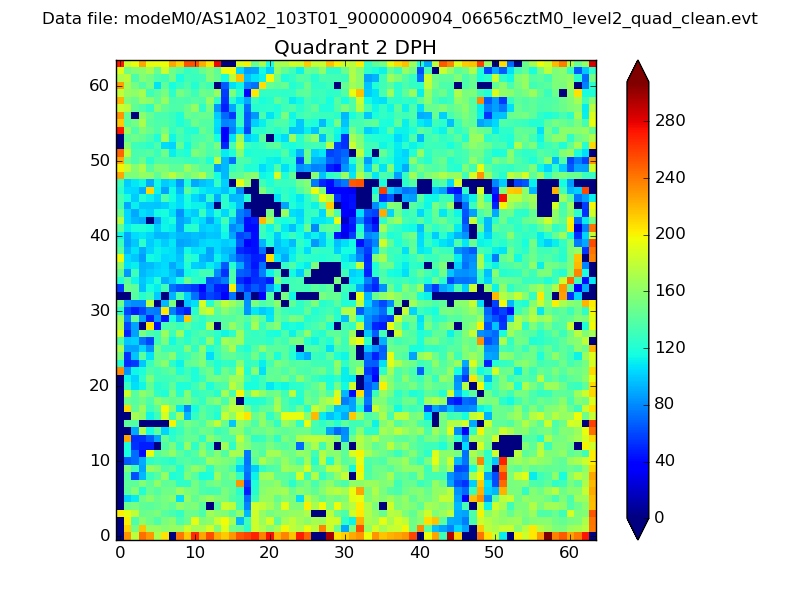
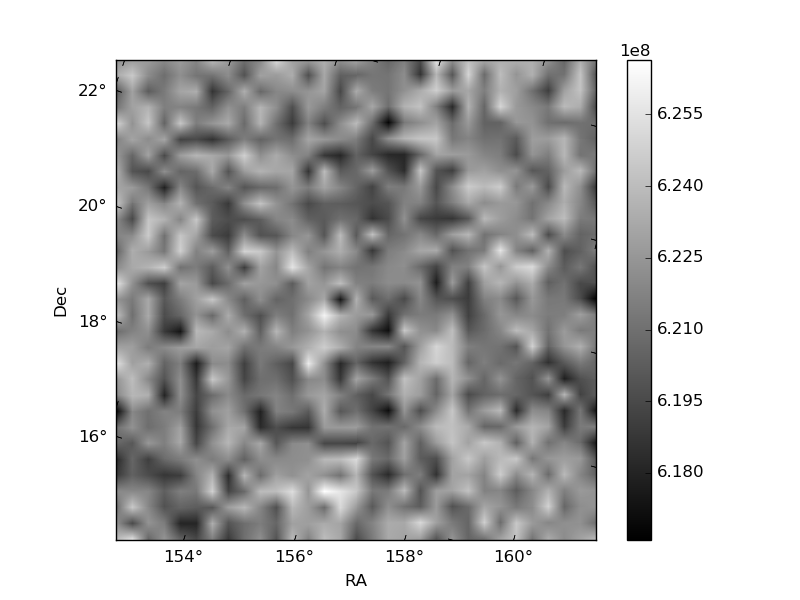
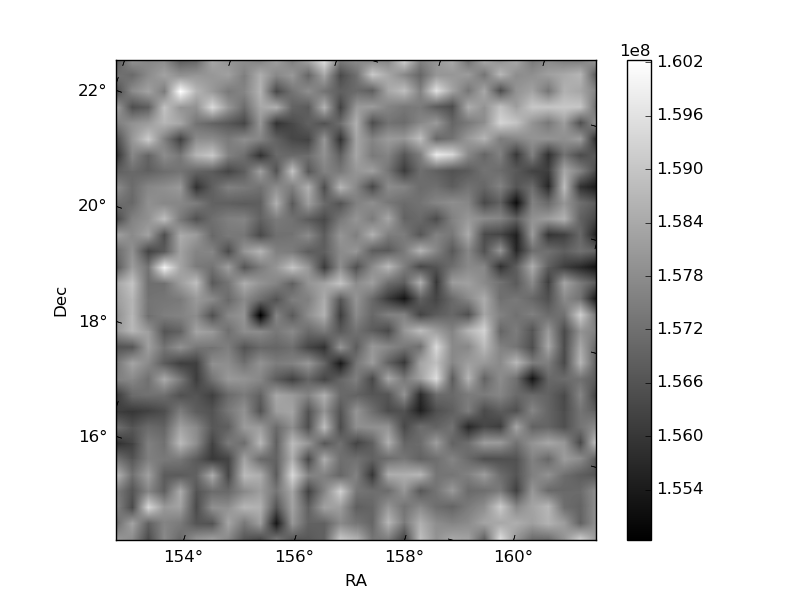
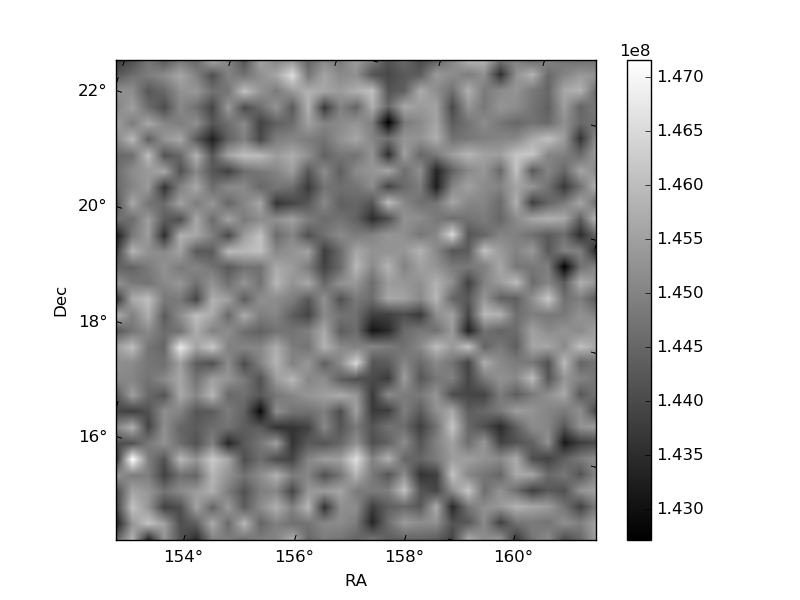
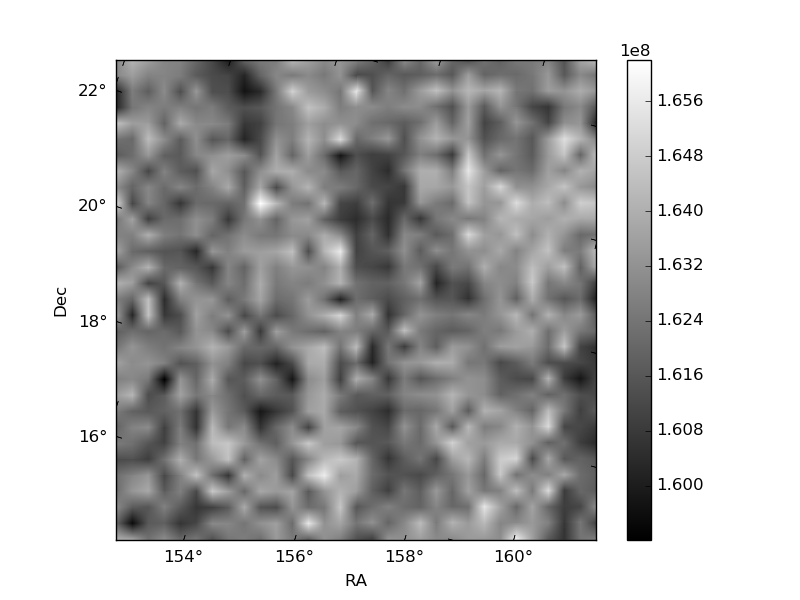
Histogram calculated using DETX and DETY for each event in the final _common_clean file
| Quadrant A | 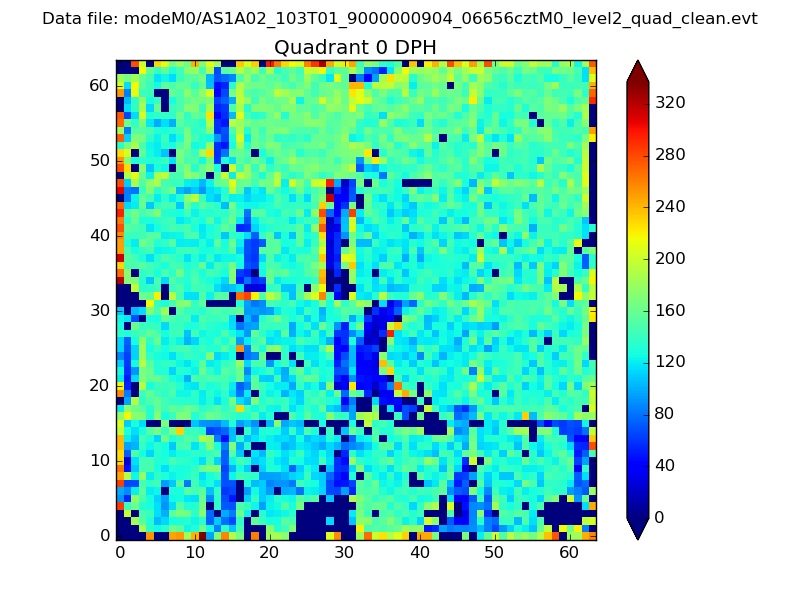 |
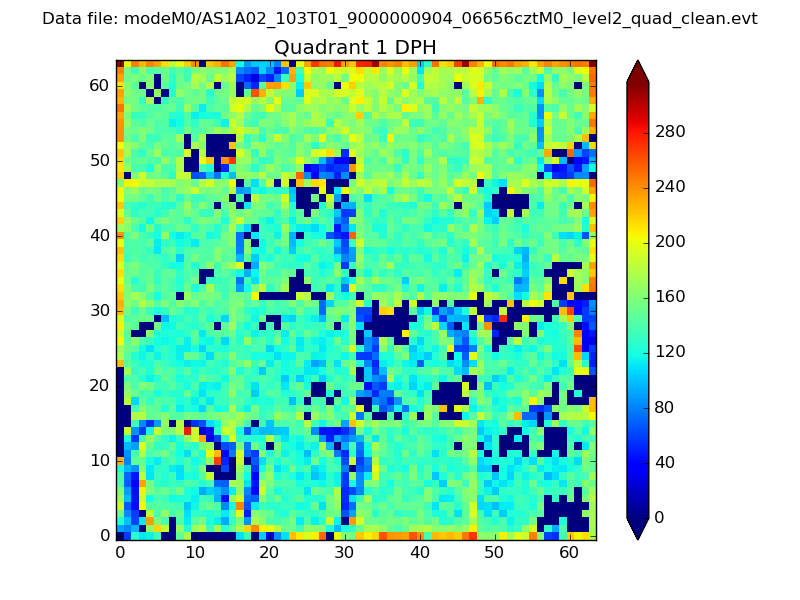 |
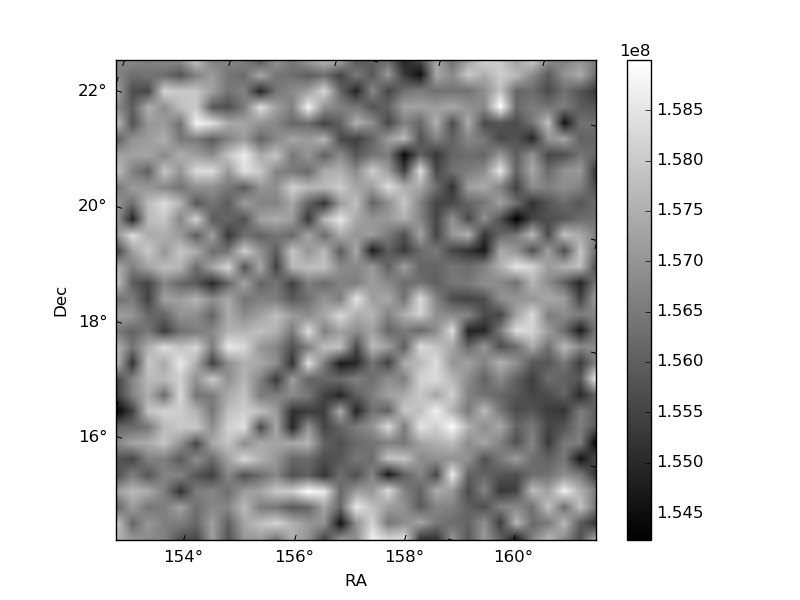
Quadrant B |
|---|---|---|---|
| Quadrant D | 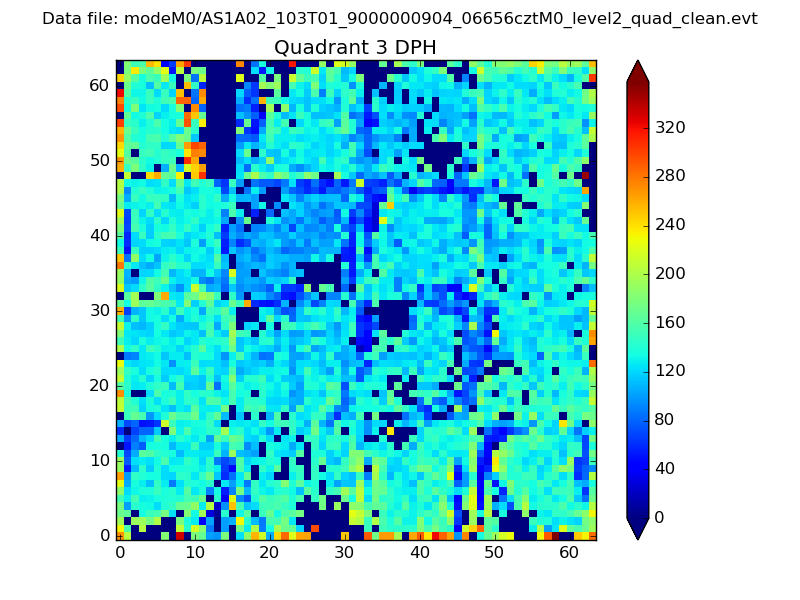 |
 |
Quadrant C |
| Plot type | Count rate plots | Images |
|---|---|---|
| Comparison with Poisson distribution Blue bars denote a histogram of data divided into 1 sec bins. Red curve is a Poisson curve with rate = median count rate of data. |
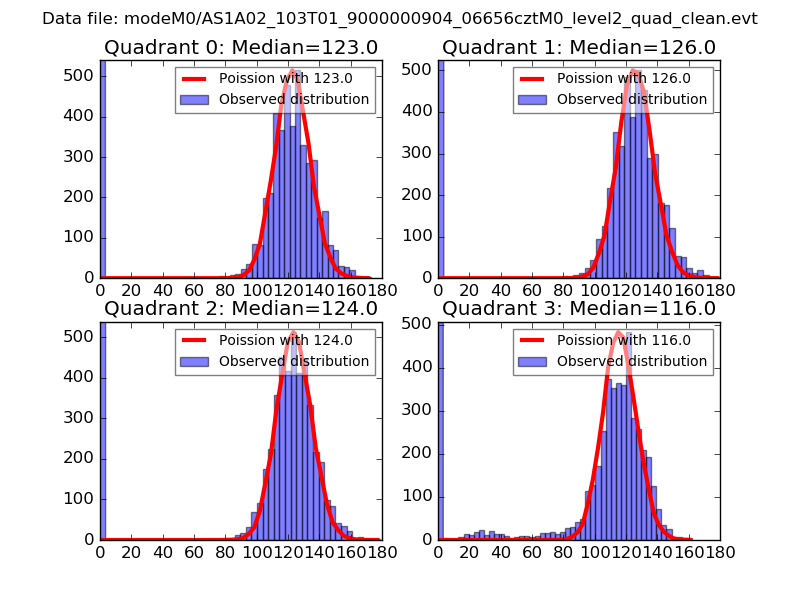 |
 |
| Quadrant-wise count rates Data is divided into 100 sec bins |
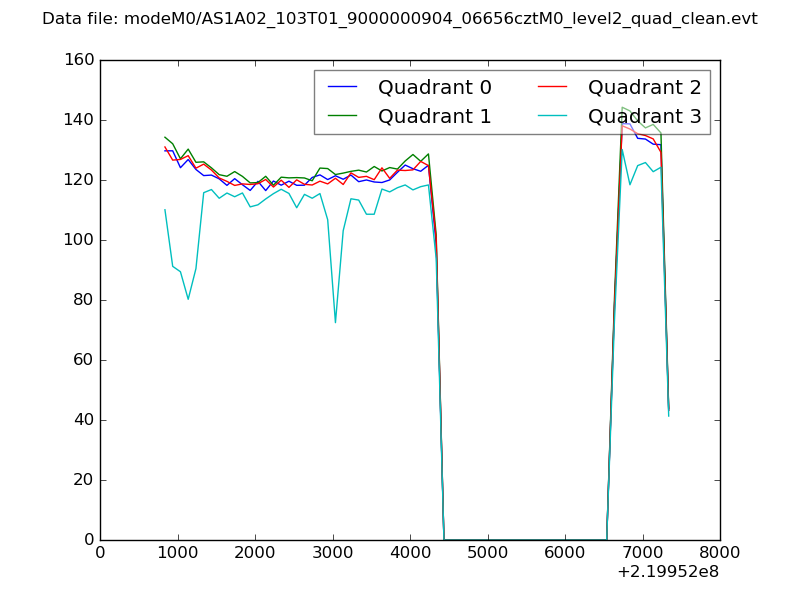 |
|
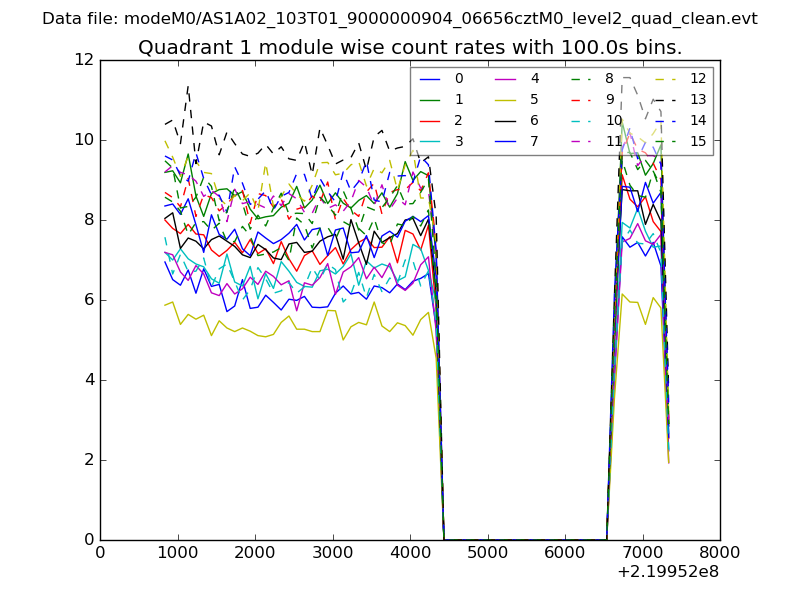
| Module-wise count rates for Quadrant A Data is divided into 100 sec bins |
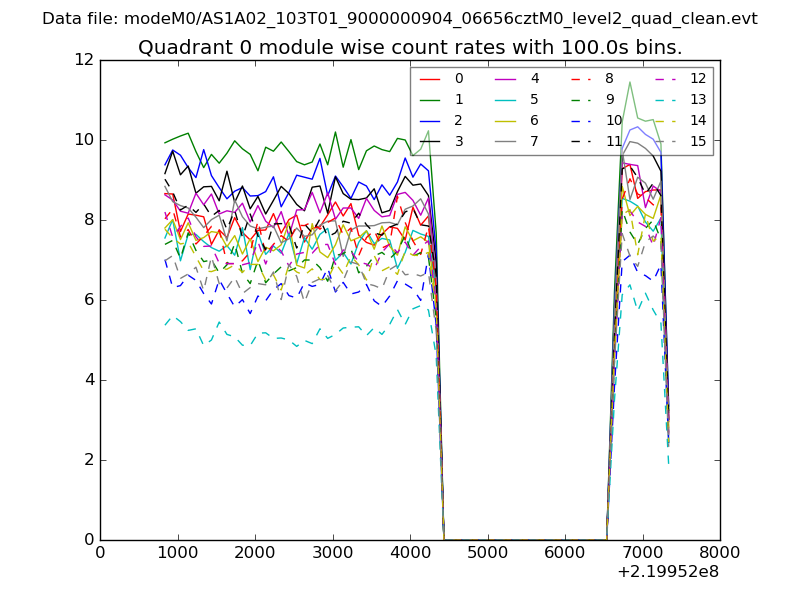 |
 |
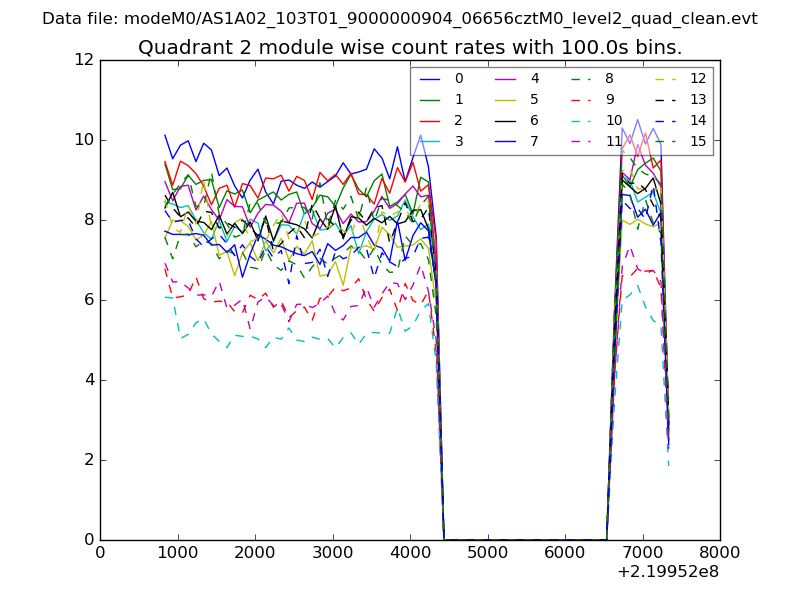
| Module-wise count rates for Quadrant B Data is divided into 100 sec bins |
 |
 |
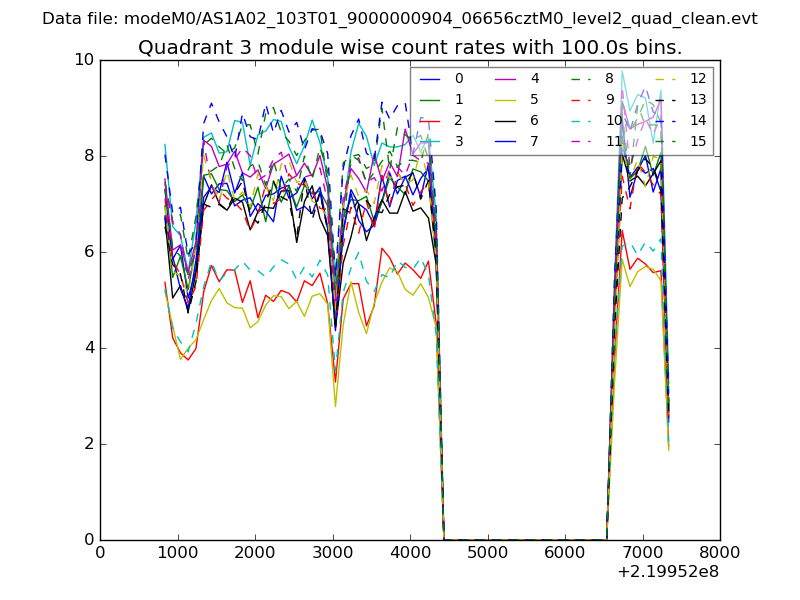
| Module-wise count rates for Quadrant C Data is divided into 100 sec bins |
 |
 |
| Module-wise count rates for Quadrant D Data is divided into 100 sec bins |
 |
 |
| Parameter | Plot |
|---|---|
| CZT HV Monitor | 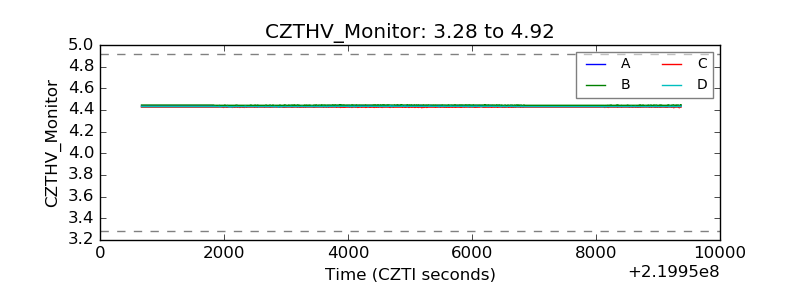 |
| D_VDD | 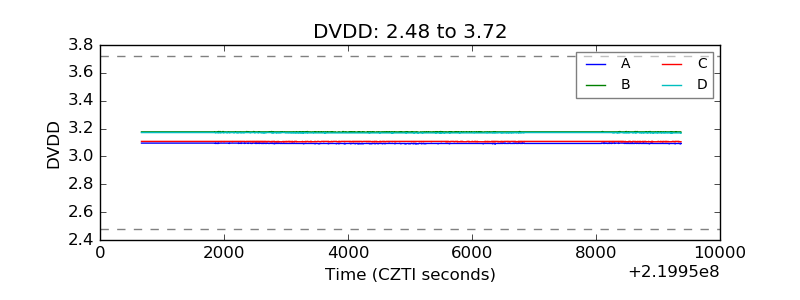 |
| Temperature 1 | 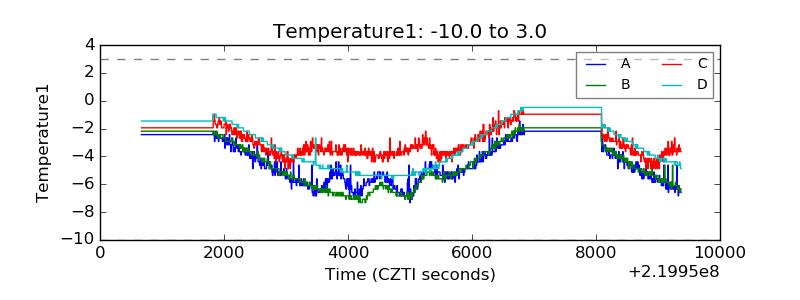 |
| Veto HV Monitor | 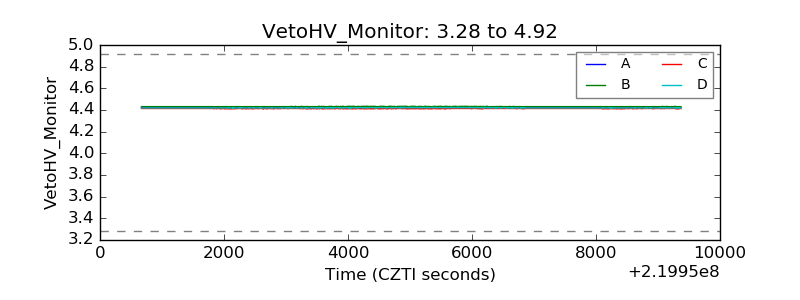 |
| Veto LLD | 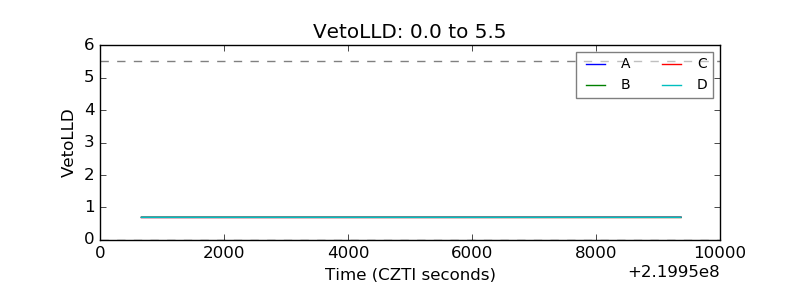 |
| Alpha Counter | 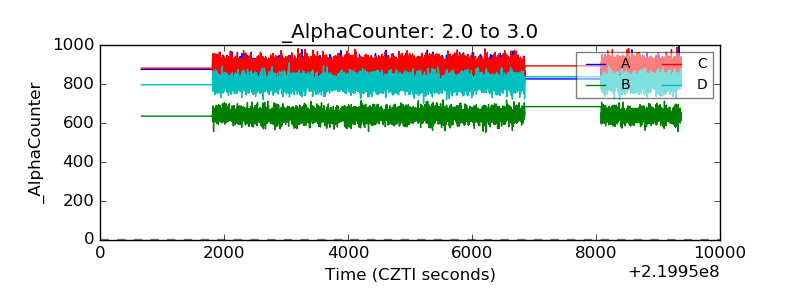 |
| _CPM_Rate | 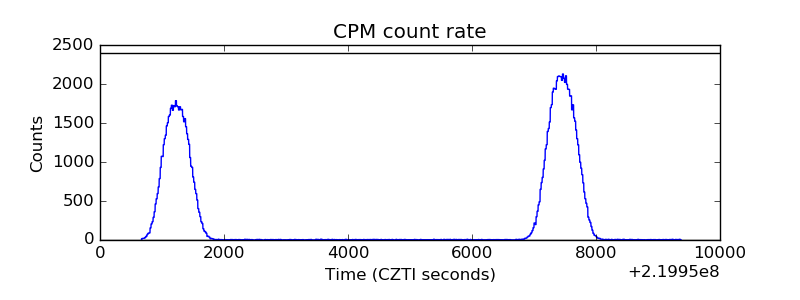 |
| CZT Counter | 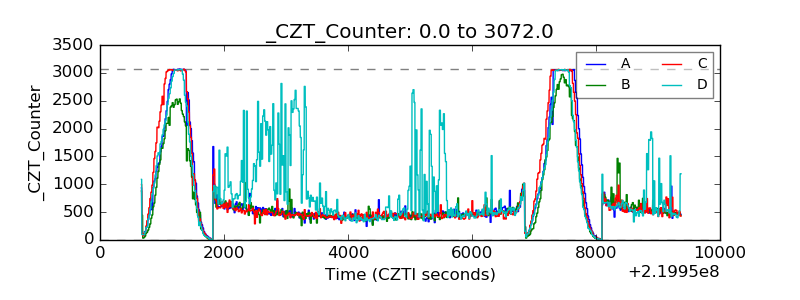 |
| +2.5 Volts monitor | 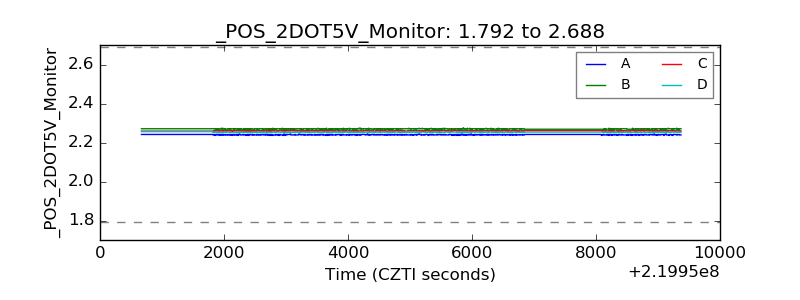 |
| +5 Volts monitor |  |
| _ROLL_ROT | 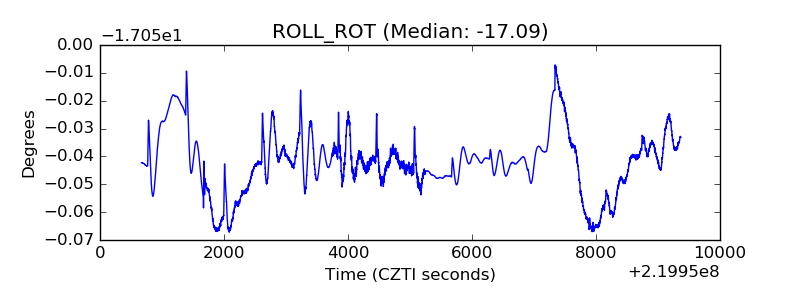 |
| _Roll_DEC | 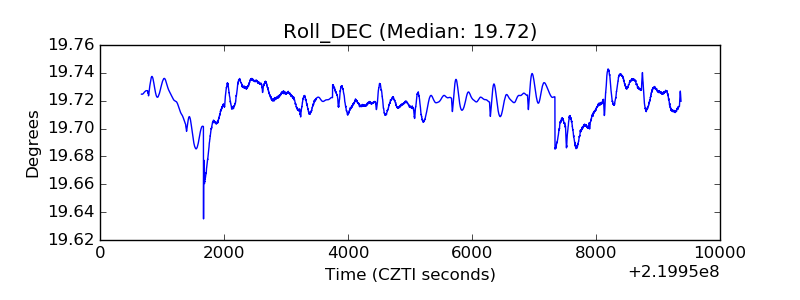 |
| _Roll_RA | 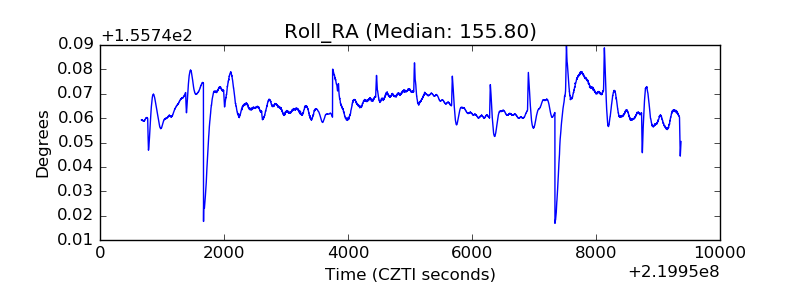 |
| Veto Counter | 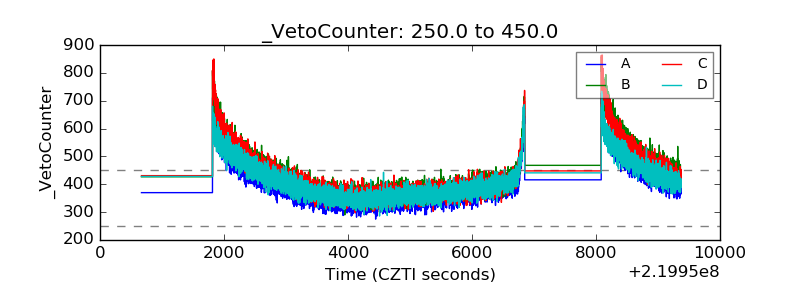 |