| Param | Original file | Final file |
|---|---|---|
| Filename | modeM0/AS1A02_103T01_9000000904_06657cztM0_level2.evt | modeM0/AS1A02_103T01_9000000904_06657cztM0_level2_quad_clean.evt |
| Size (bytes) | 553,389,120 | 95,800,320 |
| Size | 527.8 MB | 91.4 MB |
| Events in quadrant A | 3,717,375 | 610,725 |
| Events in quadrant B | 3,547,934 | 636,859 |
| Events in quadrant C | 4,189,058 | 614,089 |
| Events in quadrant D | 4,842,973 | 564,546 |
| Mode M0 | |||
|---|---|---|---|
| Quadrant | BADHDUFLAG | Total packets | Discarded packets |
| A | 0 | 15396 | 3 |
| B | 0 | 14956 | 2 |
| C | 0 | 16994 | 2 |
| D | 0 | 19049 | 2 |
| Mode M9 | |||
|---|---|---|---|
| Quadrant | BADHDUFLAG | Total packets | Discarded packets |
| A | 0 | 25 | 0 |
| B | 0 | 25 | 0 |
| C | 0 | 25 | 0 |
| D | 0 | 25 | 0 |
| Mode SS | |||
|---|---|---|---|
| Quadrant | BADHDUFLAG | Total packets | Discarded packets |
| A | 0 | 140 | 0 |
| B | 0 | 140 | 0 |
| C | 0 | 140 | 0 |
| D | 0 | 140 | 0 |
| Quadrant | Total seconds | Saturated seconds | Saturation percentage |
|---|---|---|---|
| A | 6816 | 172 | 2.523474% |
| B | 6816 | 90 | 1.320423% |
| C | 6816 | 176 | 2.582160% |
| D | 6816 | 554 | 8.127934% |
Noise dominated data is calculated using 1-second bins in cleaned event files. If a bin has >2000 counts, and if more than 50% of those come from <1% of pixels, then it is considered to be noise-dominated and hence unusable.
| Quadrant | # 1 sec bins | Bins with >0 counts | Bins with >2000 counts | High rate bins dominated by noise | Noise dominated (total time) | Noise dominated (detector-on time) | Marked lightcurve |
|---|---|---|---|---|---|---|---|
| A | 9371 | 6818 | 84 | 84 | 0.90% | 1.23% | 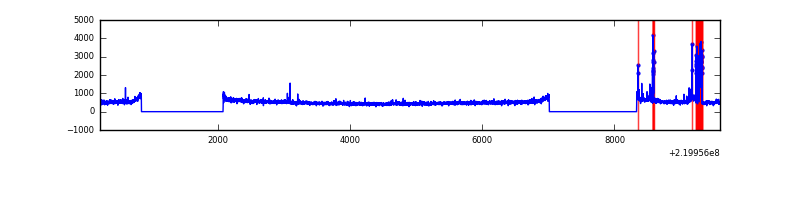 |
| B | 9371 | 6818 | 9 | 9 | 0.10% | 0.13% | 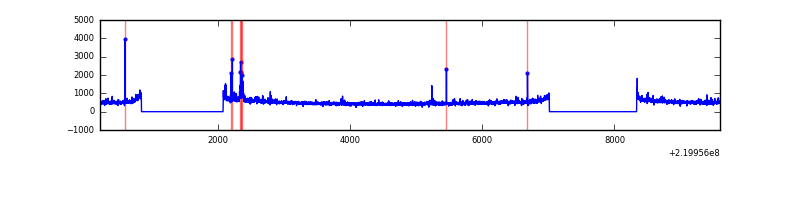 |
| C | 9371 | 6818 | 123 | 123 | 1.31% | 1.80% | 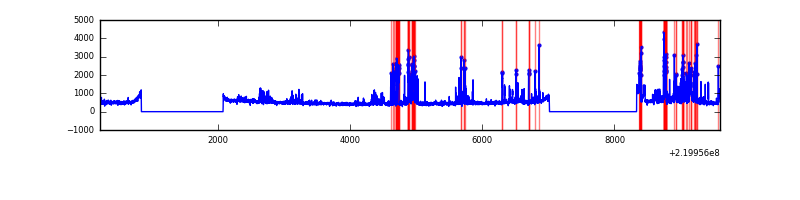 |
| D | 9371 | 6818 | 412 | 412 | 4.40% | 6.04% | 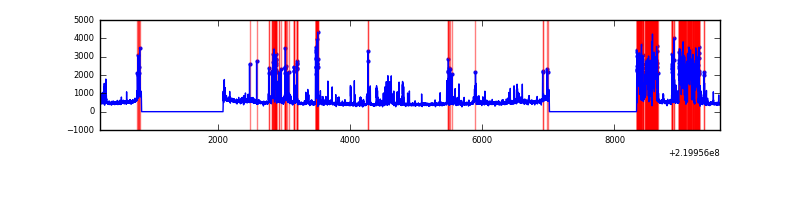 |
Top three noisy pixels from each quadrant. If the there are fewer than three noisy pixels in the level2.evt file, extra rows are filled as -1
| Pixel properties | Quadrant properties | ||||||
|---|---|---|---|---|---|---|---|
| Quadrant | DetID | PixID | Counts | Sigma | Mean | Median | Sigma |
| A | 15 | 234 | 232904 | 1366.75 | 839 | 823 | 169.8 |
| A | 8 | 15 | 187089 | 1096.94 | 839 | 823 | 169.8 |
| A | 14 | 111 | 51898 | 300.79 | 839 | 823 | 169.8 |
| B | 0 | 228 | 59607 | 362.54 | 859 | 841 | 162.1 |
| B | 4 | 81 | 41860 | 253.06 | 859 | 841 | 162.1 |
| B | 4 | 48 | 30847 | 185.11 | 859 | 841 | 162.1 |
| C | 9 | 247 | 959034 | 5059.37 | 820 | 825 | 189.4 |
| C | 4 | 254 | 26708 | 136.66 | 820 | 825 | 189.4 |
| C | 13 | 61 | 6399 | 29.43 | 820 | 825 | 189.4 |
| D | 2 | 33 | 1443640 | 7453.33 | 793 | 769 | 193.6 |
| D | 2 | 152 | 107591 | 551.8 | 793 | 769 | 193.6 |
| D | 2 | 14 | 86203 | 441.32 | 793 | 769 | 193.6 |
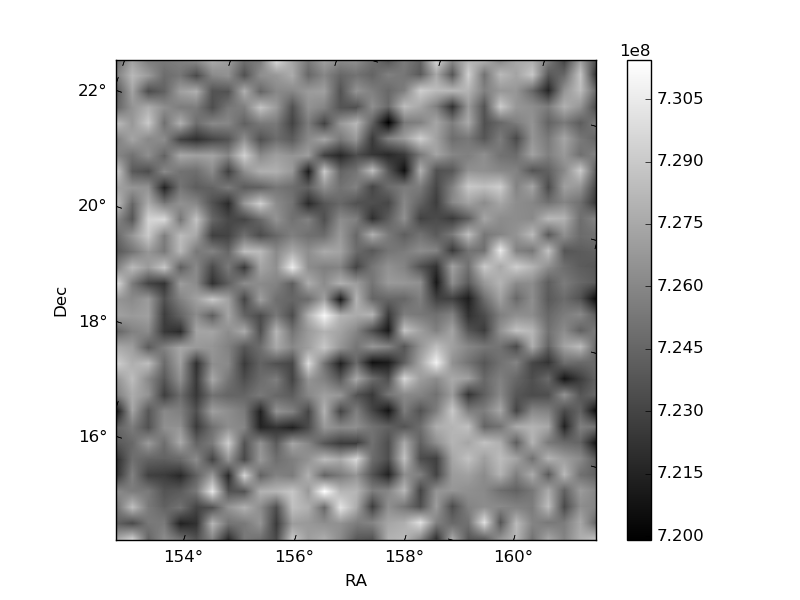
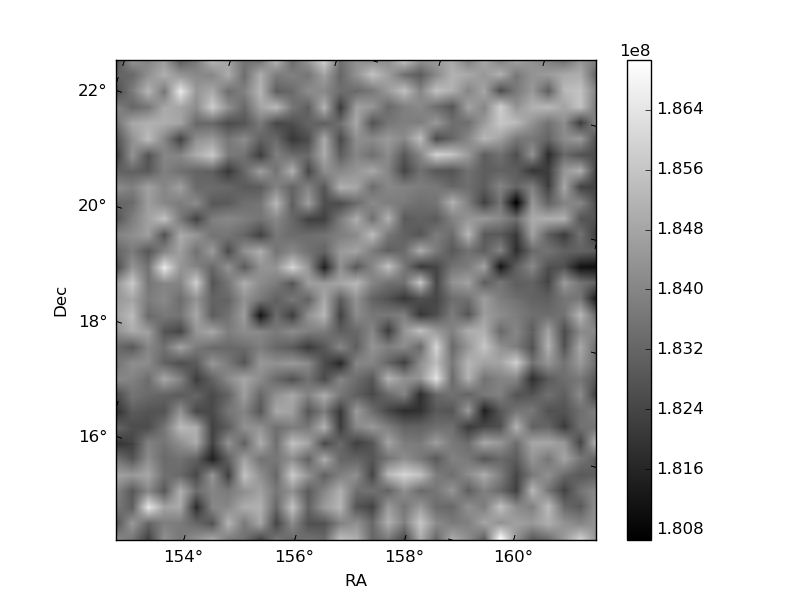
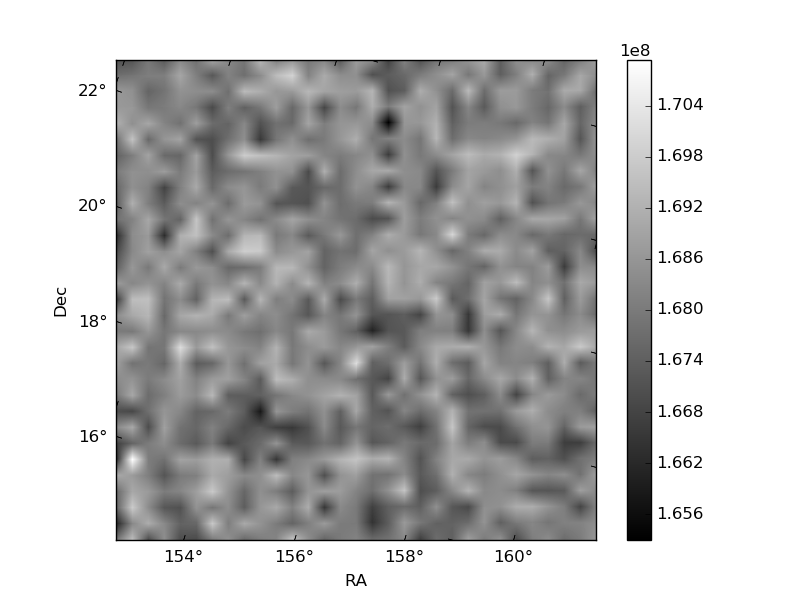
Histogram calculated using DETX and DETY for each event in the final _common_clean file
| Quadrant A | 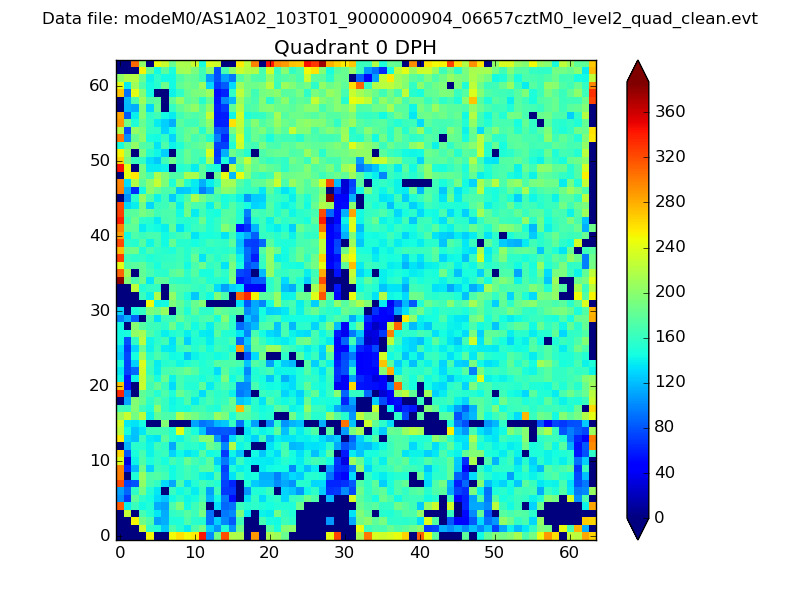 |
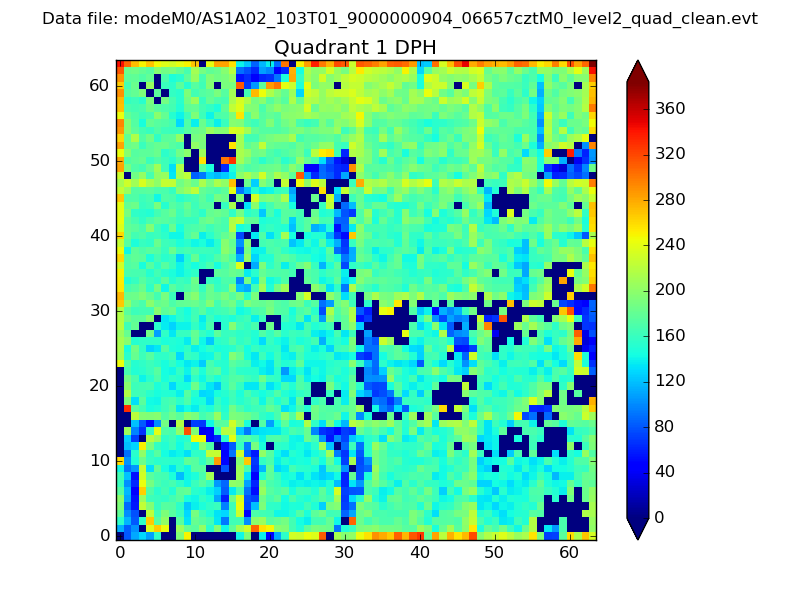 |
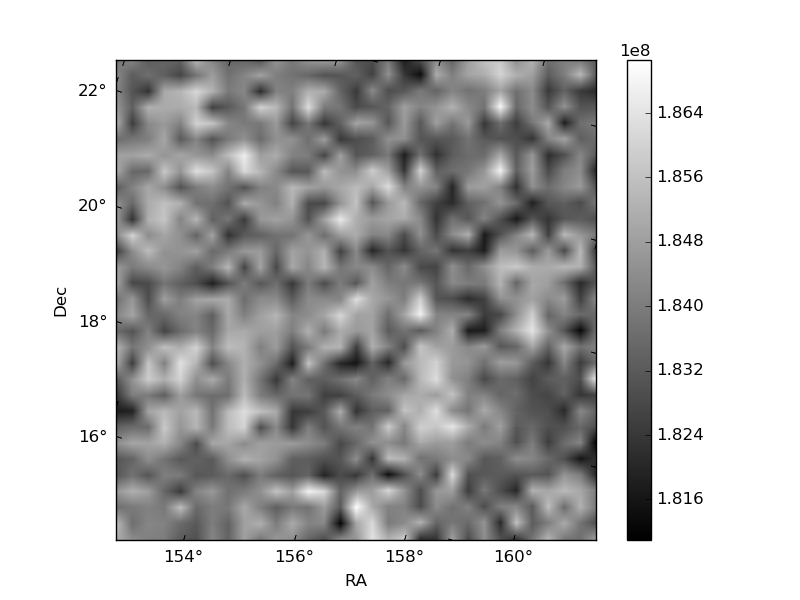
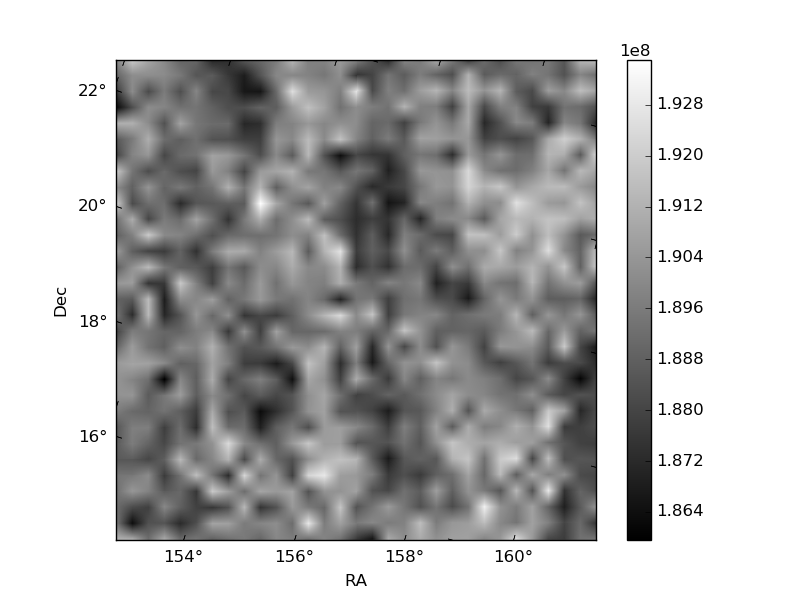
Quadrant B |
|---|---|---|---|
| Quadrant D | 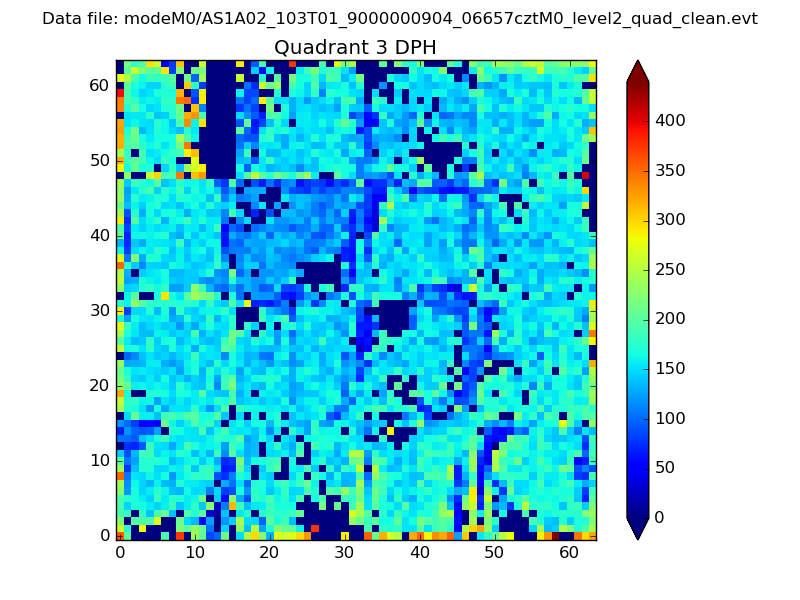 |
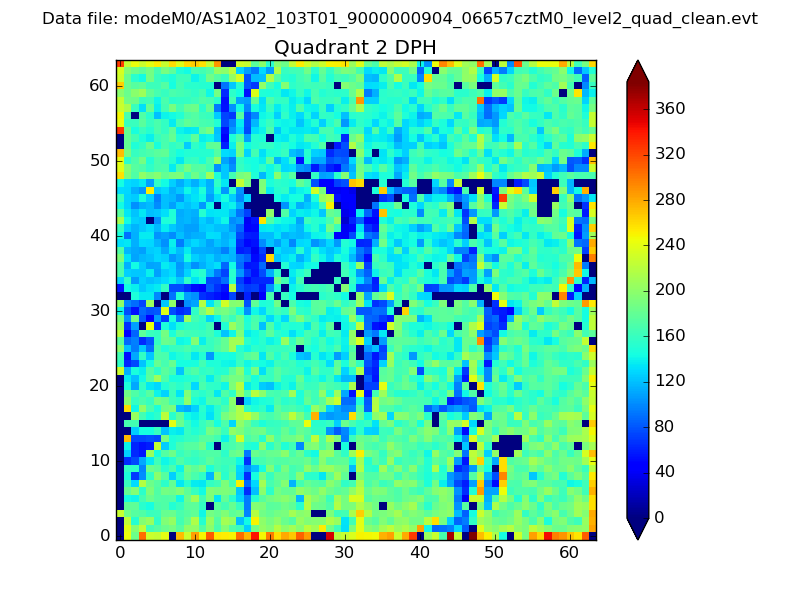 |
Quadrant C |
| Plot type | Count rate plots | Images |
|---|---|---|
| Comparison with Poisson distribution Blue bars denote a histogram of data divided into 1 sec bins. Red curve is a Poisson curve with rate = median count rate of data. |
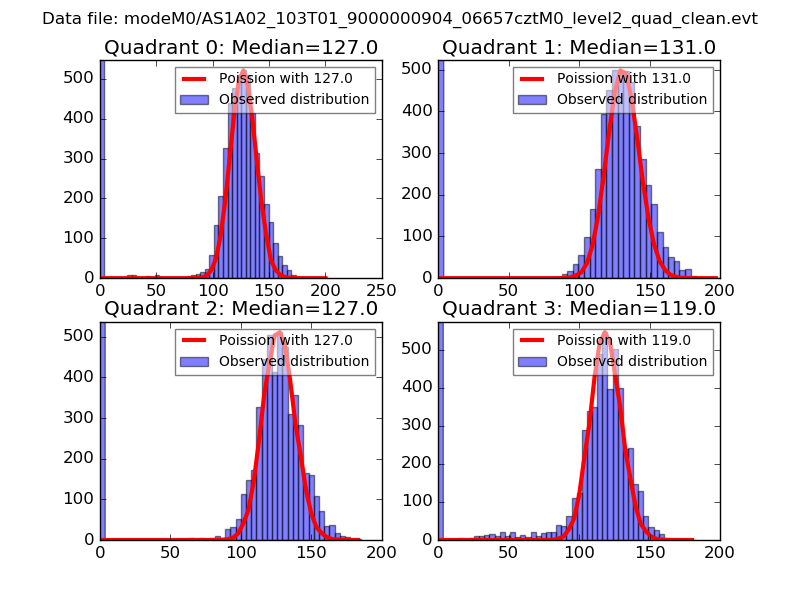 |
 |
| Quadrant-wise count rates Data is divided into 100 sec bins |
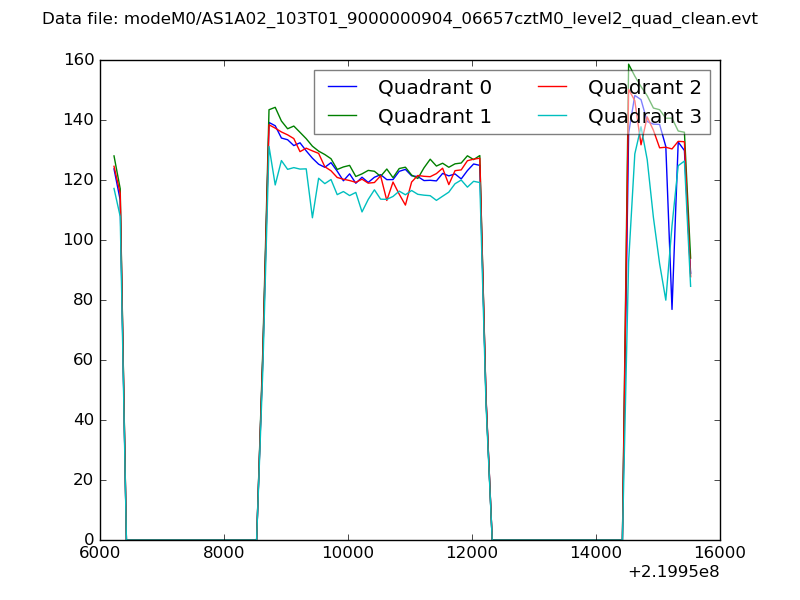 |
|
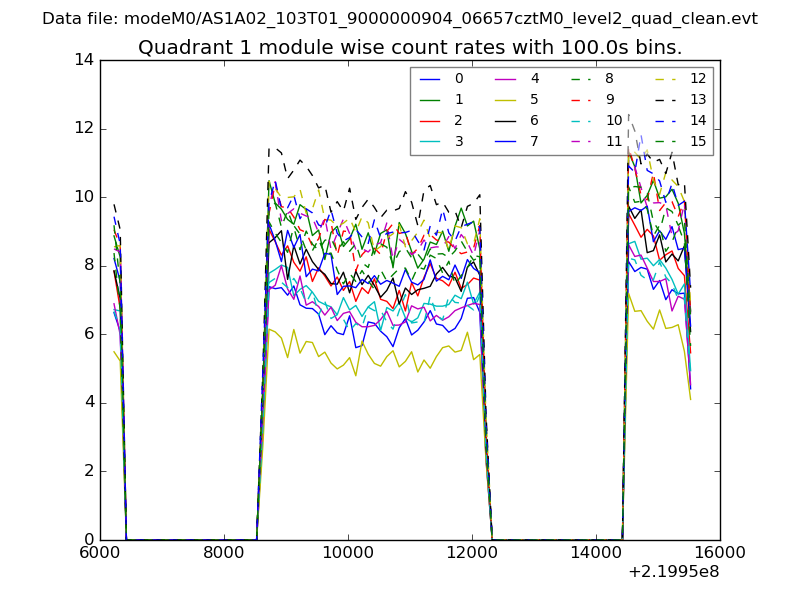
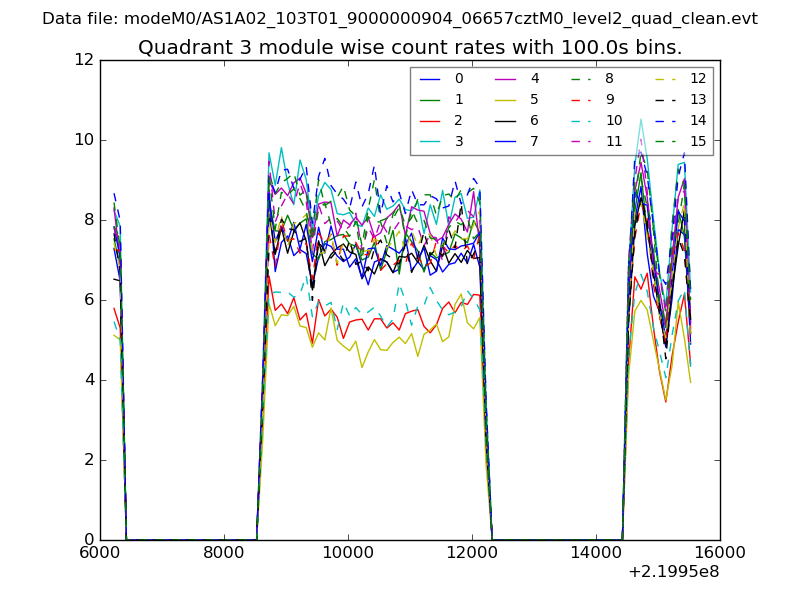
| Module-wise count rates for Quadrant A Data is divided into 100 sec bins |
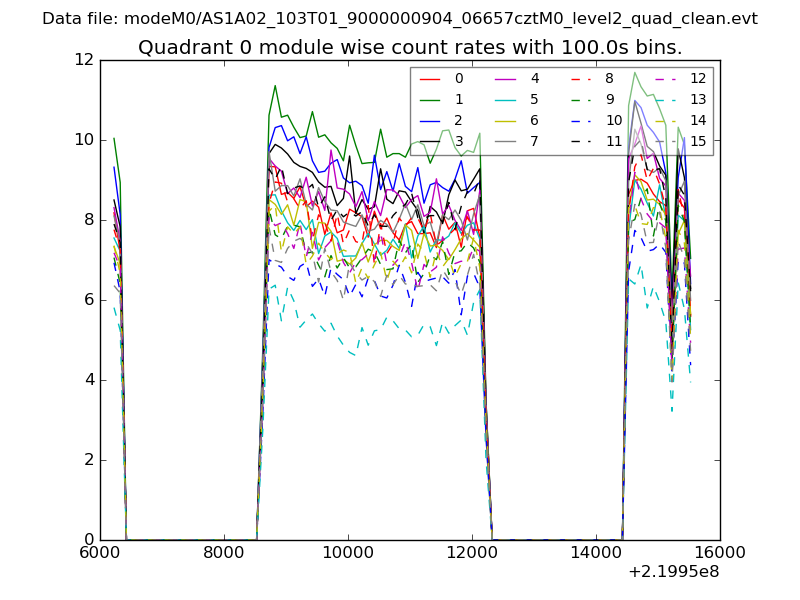 |
 |
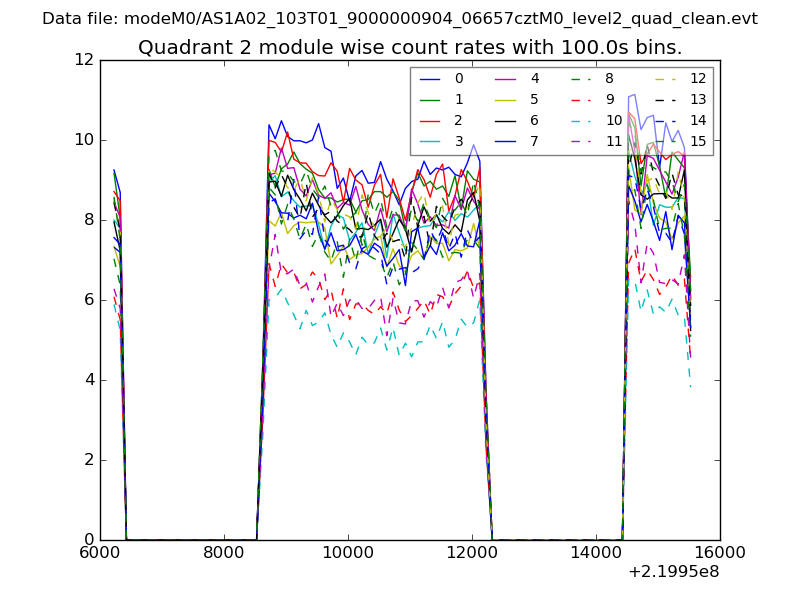
| Module-wise count rates for Quadrant B Data is divided into 100 sec bins |
 |
 |
| Module-wise count rates for Quadrant C Data is divided into 100 sec bins |
 |
 |
| Module-wise count rates for Quadrant D Data is divided into 100 sec bins |
 |
 |
| Parameter | Plot |
|---|---|
| CZT HV Monitor | 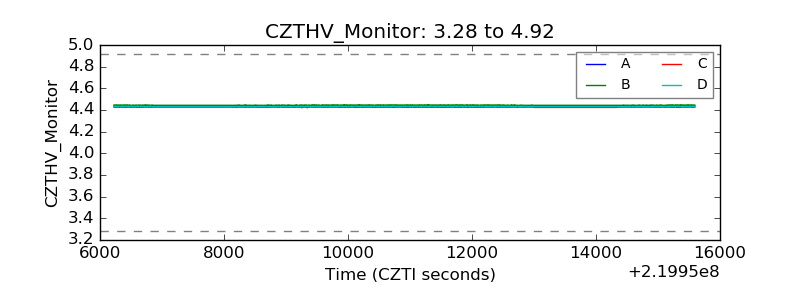 |
| D_VDD | 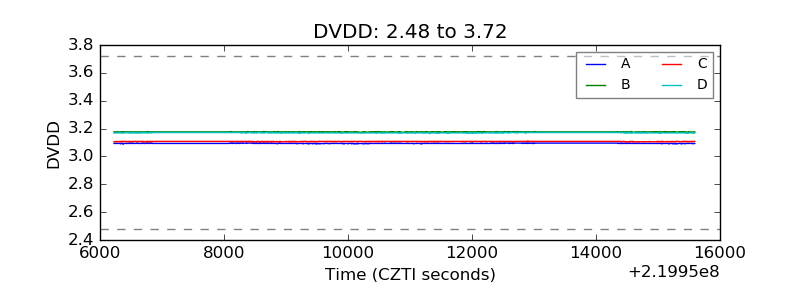 |
| Temperature 1 | 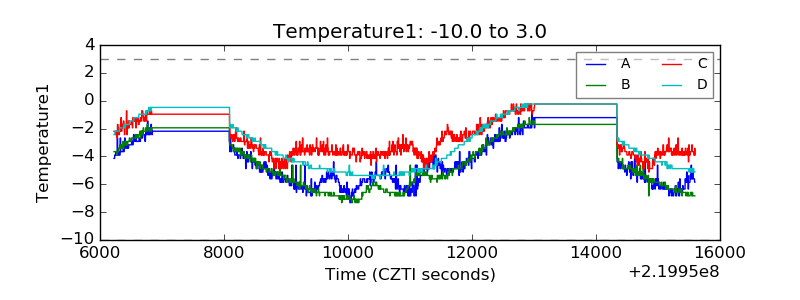 |
| Veto HV Monitor | 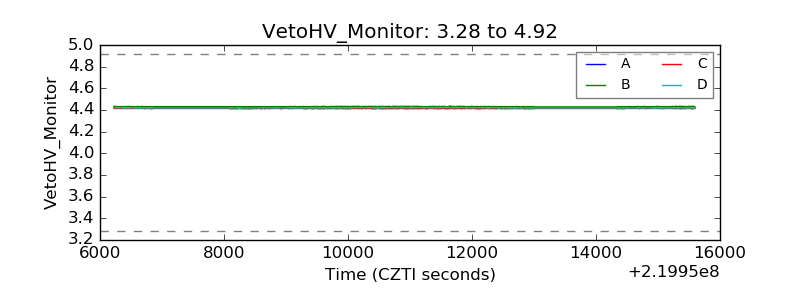 |
| Veto LLD | 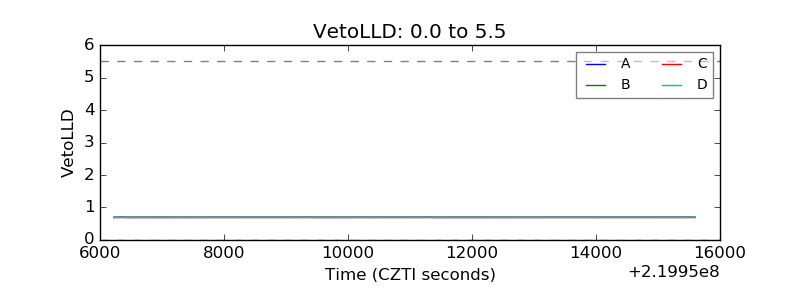 |
| Alpha Counter | 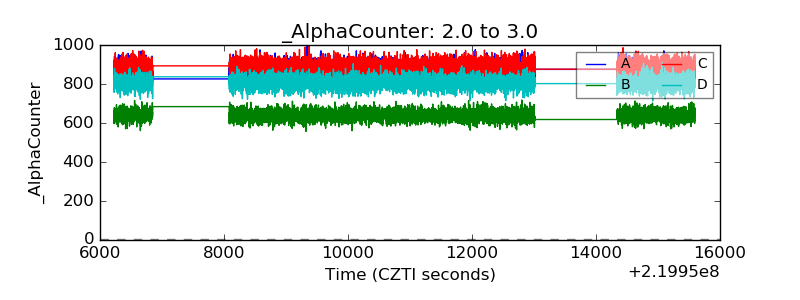 |
| _CPM_Rate | 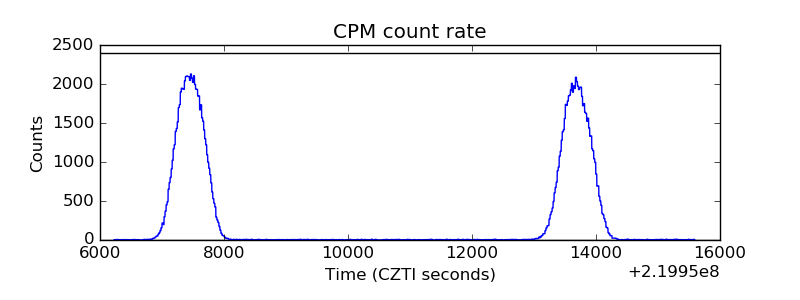 |
| CZT Counter | 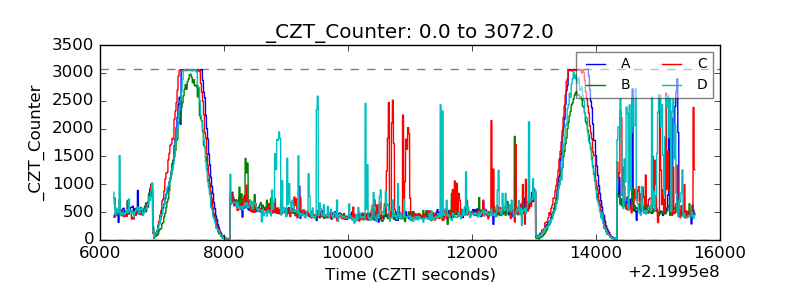 |
| +2.5 Volts monitor | 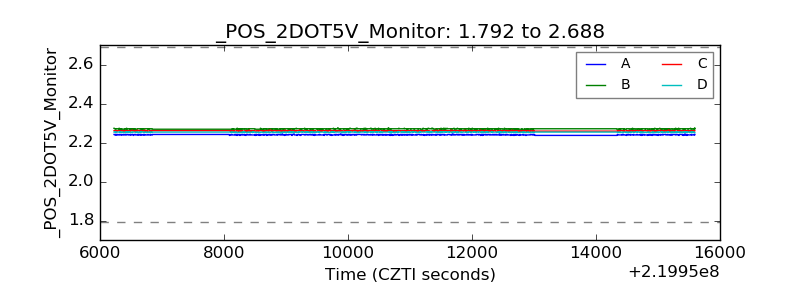 |
| +5 Volts monitor |  |
| _ROLL_ROT | 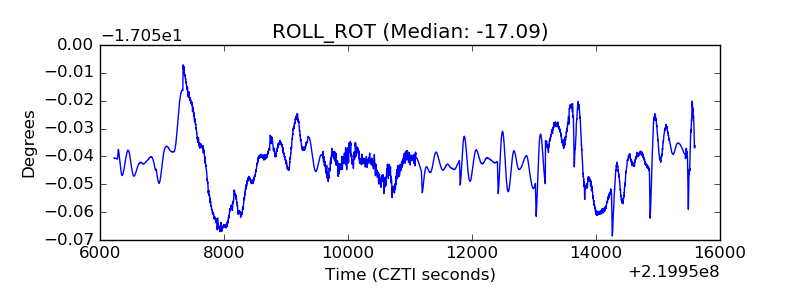 |
| _Roll_DEC | 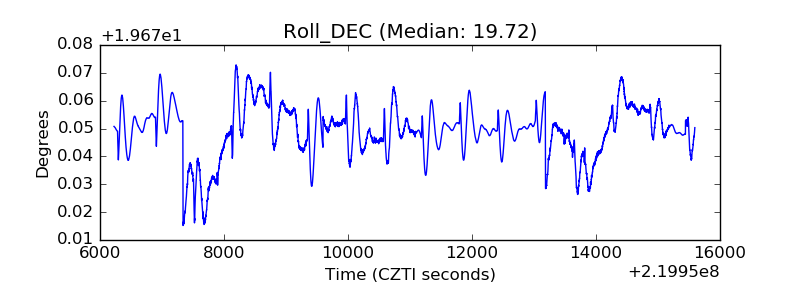 |
| _Roll_RA | 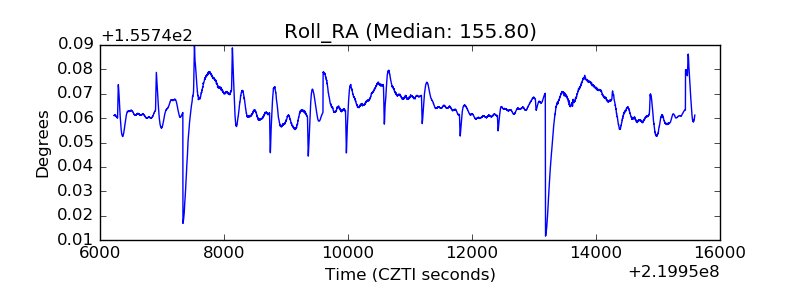 |
| Veto Counter | 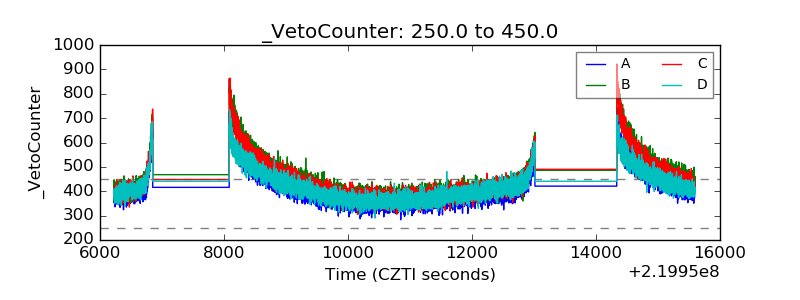 |