| Param | Original file | Final file |
|---|---|---|
| Filename | modeM0/AS1A02_103T01_9000000904_06658cztM0_level2.evt | modeM0/AS1A02_103T01_9000000904_06658cztM0_level2_quad_clean.evt |
| Size (bytes) | 660,288,960 | 90,984,960 |
| Size | 629.7 MB | 86.8 MB |
| Events in quadrant A | 5,952,779 | 560,911 |
| Events in quadrant B | 3,144,295 | 645,902 |
| Events in quadrant C | 5,664,070 | 560,866 |
| Events in quadrant D | 4,820,689 | 558,589 |
| Mode M0 | |||
|---|---|---|---|
| Quadrant | BADHDUFLAG | Total packets | Discarded packets |
| A | 0 | 21761 | 3 |
| B | 0 | 13277 | 2 |
| C | 0 | 20881 | 2 |
| D | 0 | 18632 | 2 |
| Mode M9 | |||
|---|---|---|---|
| Quadrant | BADHDUFLAG | Total packets | Discarded packets |
| A | 0 | 20 | 0 |
| B | 0 | 20 | 0 |
| C | 0 | 20 | 0 |
| D | 0 | 21 | 0 |
| Mode SS | |||
|---|---|---|---|
| Quadrant | BADHDUFLAG | Total packets | Discarded packets |
| A | 0 | 124 | 0 |
| B | 0 | 124 | 0 |
| C | 0 | 124 | 0 |
| D | 0 | 124 | 0 |
| Quadrant | Total seconds | Saturated seconds | Saturation percentage |
|---|---|---|---|
| A | 6132 | 1338 | 21.819961% |
| B | 6132 | 42 | 0.684932% |
| C | 6132 | 930 | 15.166341% |
| D | 6132 | 705 | 11.497065% |
Noise dominated data is calculated using 1-second bins in cleaned event files. If a bin has >2000 counts, and if more than 50% of those come from <1% of pixels, then it is considered to be noise-dominated and hence unusable.
| Quadrant | # 1 sec bins | Bins with >0 counts | Bins with >2000 counts | High rate bins dominated by noise | Noise dominated (total time) | Noise dominated (detector-on time) | Marked lightcurve |
|---|---|---|---|---|---|---|---|
| A | 7457 | 6133 | 890 | 890 | 11.94% | 14.51% | 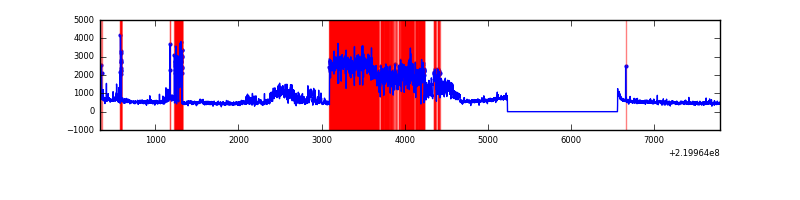 |
| B | 7457 | 6133 | 5 | 5 | 0.07% | 0.08% | 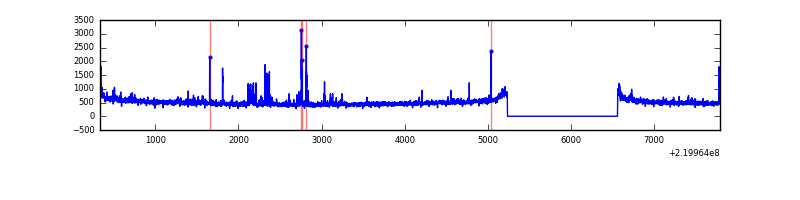 |
| C | 7457 | 6132 | 725 | 725 | 9.72% | 11.82% | 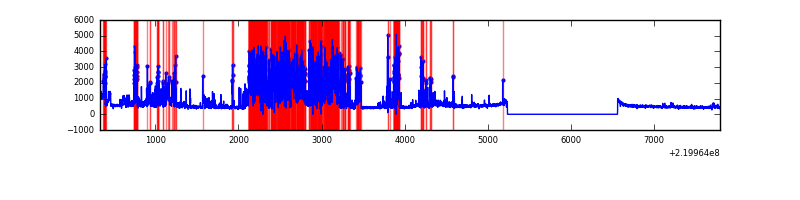 |
| D | 7457 | 6133 | 511 | 511 | 6.85% | 8.33% | 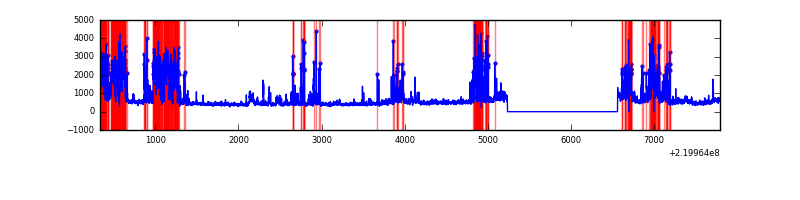 |
Top three noisy pixels from each quadrant. If the there are fewer than three noisy pixels in the level2.evt file, extra rows are filled as -1
| Pixel properties | Quadrant properties | ||||||
|---|---|---|---|---|---|---|---|
| Quadrant | DetID | PixID | Counts | Sigma | Mean | Median | Sigma |
| A | 14 | 111 | 2839072 | 20268.35 | 695 | 681 | 140.0 |
| A | 15 | 234 | 232996 | 1658.91 | 695 | 681 | 140.0 |
| A | 8 | 15 | 197004 | 1401.9 | 695 | 681 | 140.0 |
| B | 4 | 48 | 86145 | 592.31 | 762 | 745 | 144.2 |
| B | 4 | 81 | 46149 | 314.91 | 762 | 745 | 144.2 |
| B | 0 | 214 | 15755 | 104.11 | 762 | 745 | 144.2 |
| C | 9 | 247 | 3005600 | 19150.55 | 680 | 683 | 156.9 |
| C | 13 | 61 | 5343 | 29.7 | 680 | 683 | 156.9 |
| C | 4 | 254 | 5242 | 29.05 | 680 | 683 | 156.9 |
| D | 2 | 33 | 1902840 | 11362.55 | 681 | 662 | 167.4 |
| D | 8 | 195 | 159067 | 946.22 | 681 | 662 | 167.4 |
| D | 2 | 14 | 55077 | 325.04 | 681 | 662 | 167.4 |
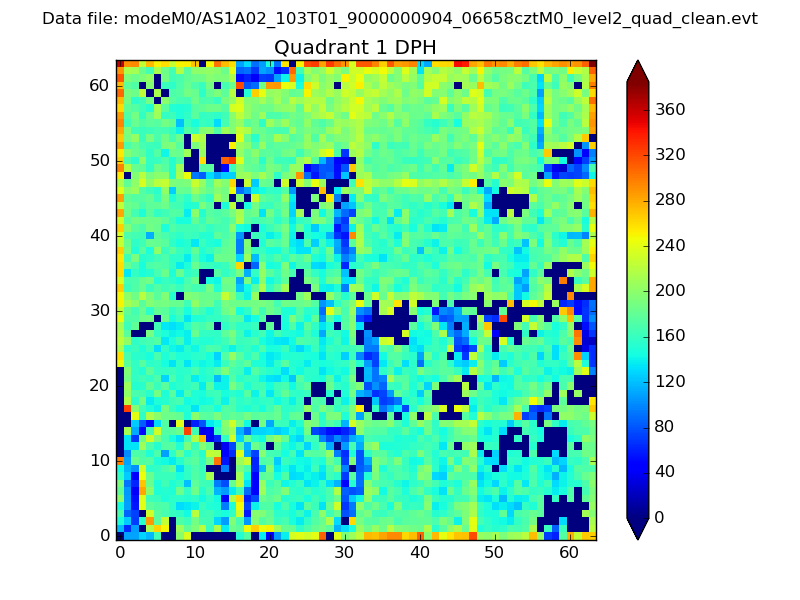
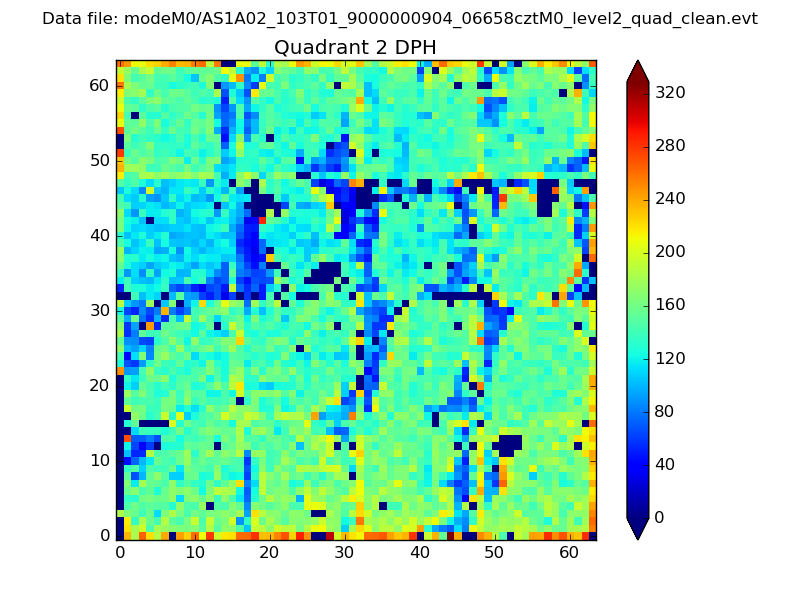
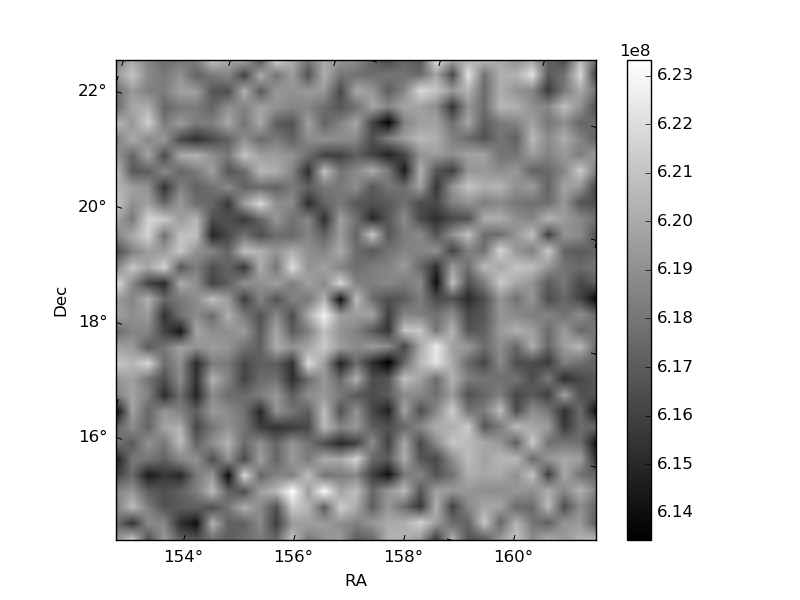
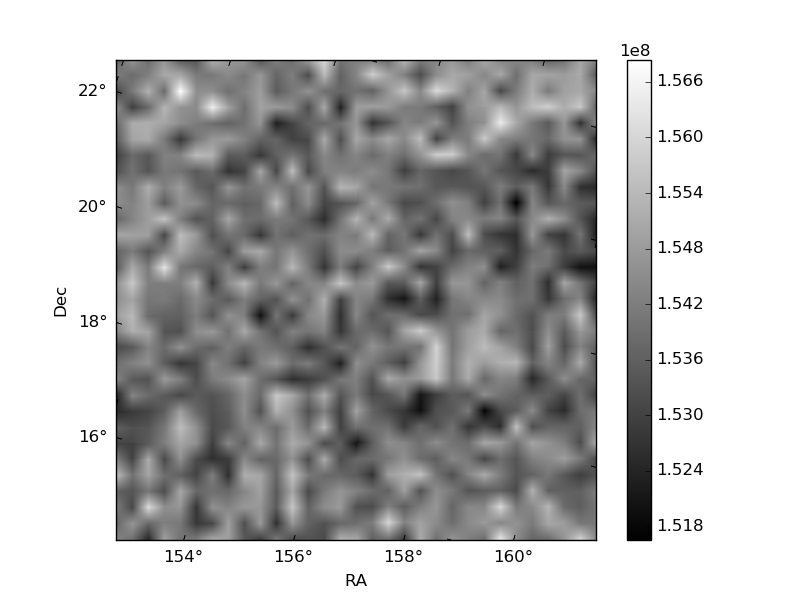
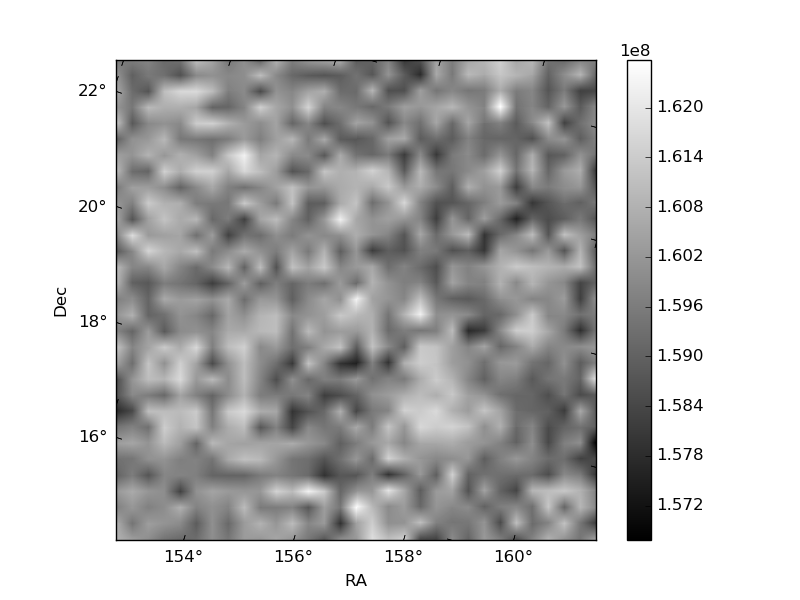
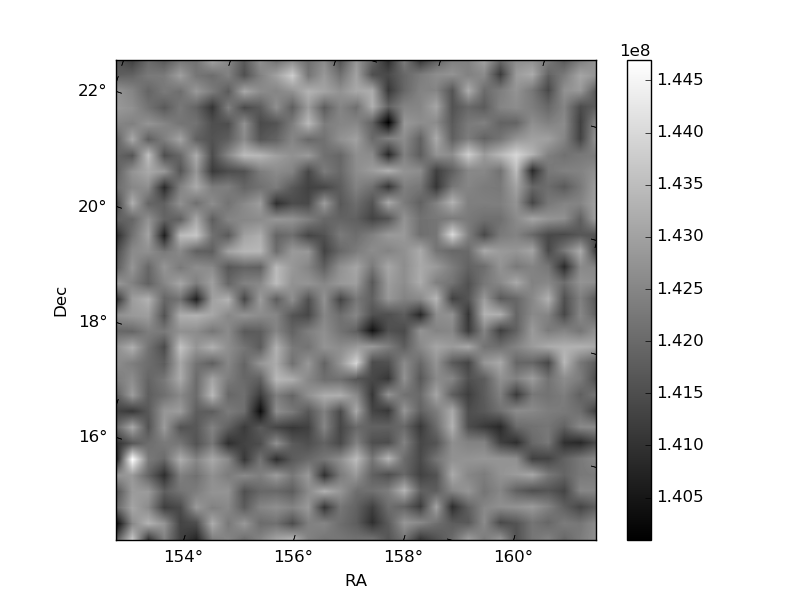
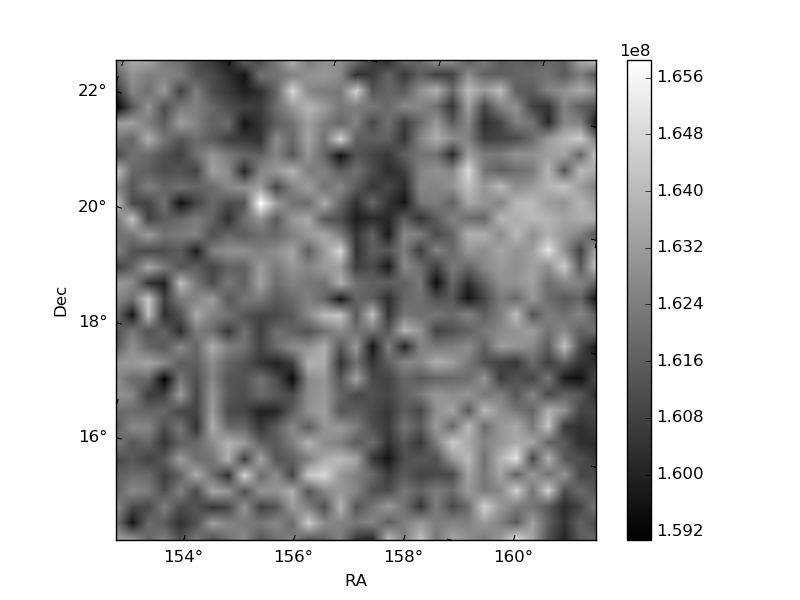
Histogram calculated using DETX and DETY for each event in the final _common_clean file
| Quadrant A |  |
 |
Quadrant B |
|---|---|---|---|
| Quadrant D | 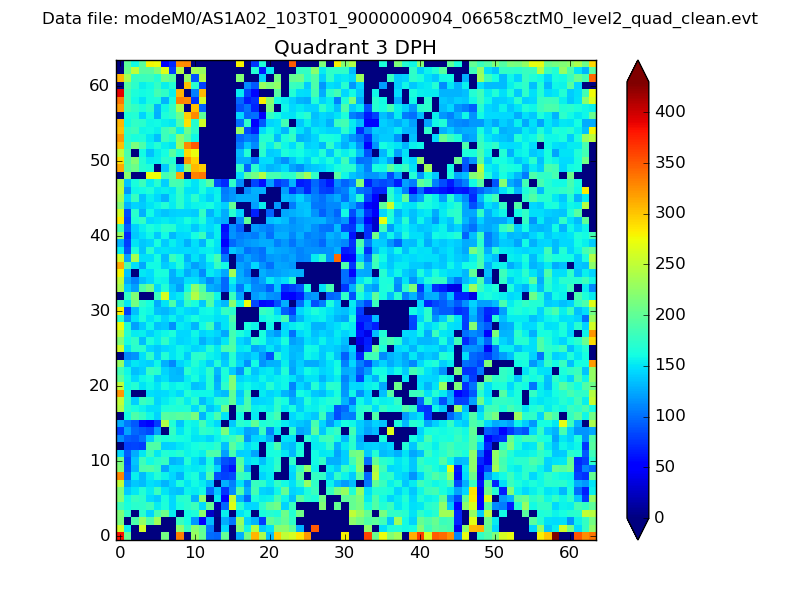 |
 |
Quadrant C |
| Plot type | Count rate plots | Images |
|---|---|---|
| Comparison with Poisson distribution Blue bars denote a histogram of data divided into 1 sec bins. Red curve is a Poisson curve with rate = median count rate of data. |
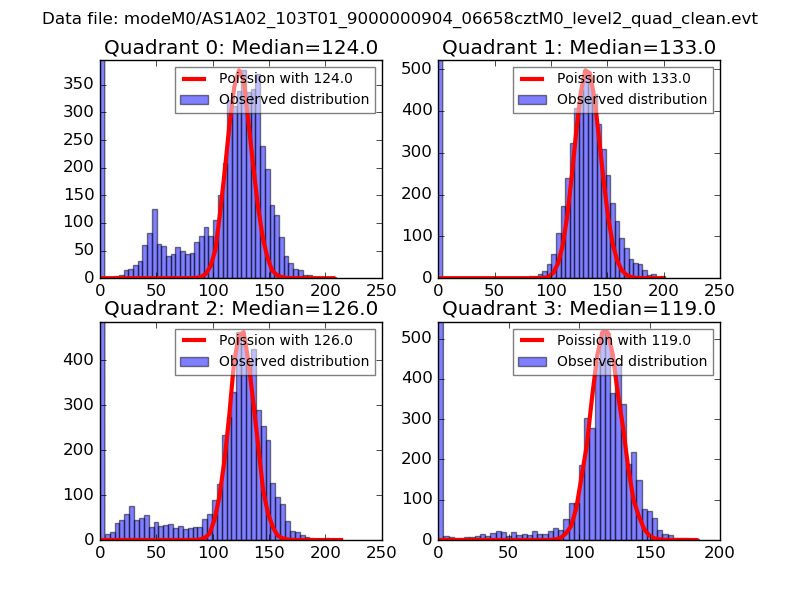 |
 |
| Quadrant-wise count rates Data is divided into 100 sec bins |
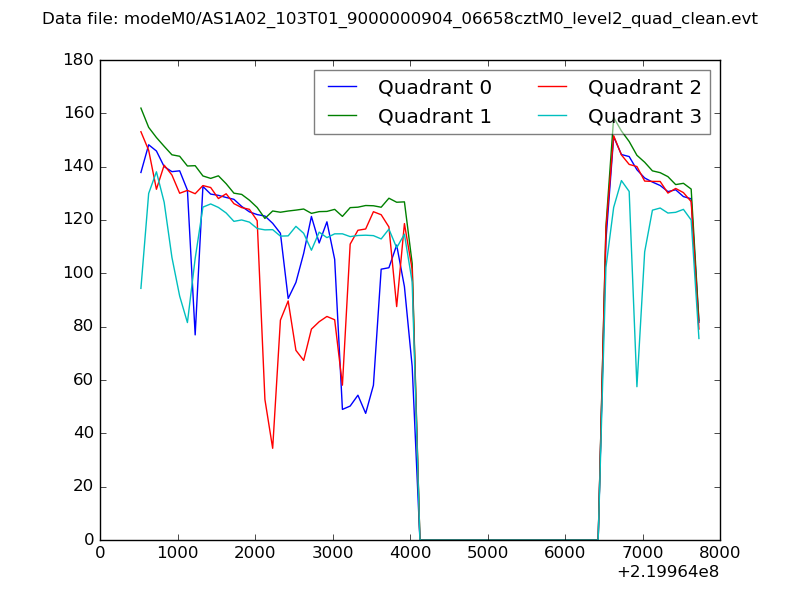 |
|
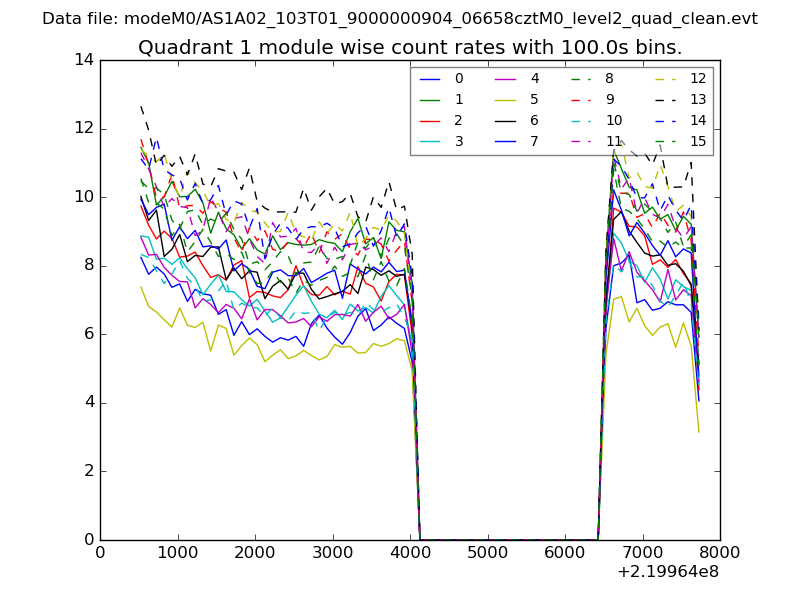
| Module-wise count rates for Quadrant A Data is divided into 100 sec bins |
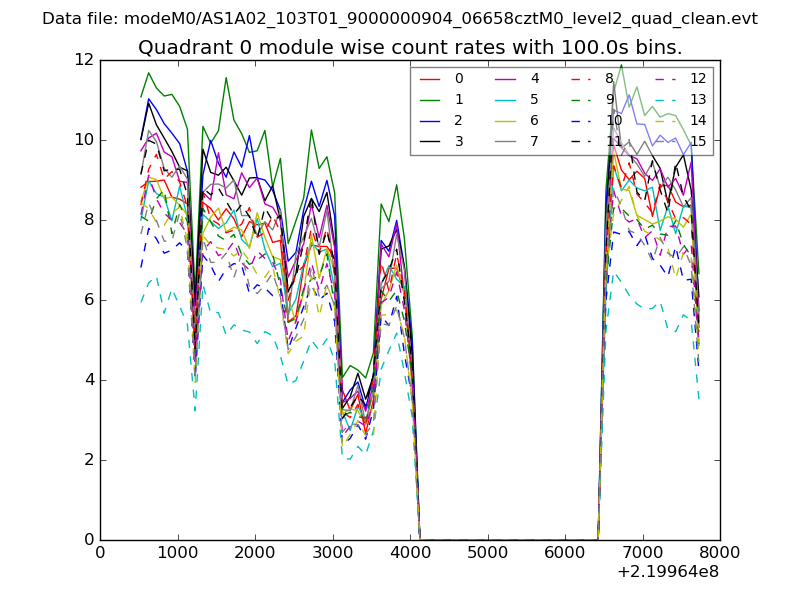 |
 |
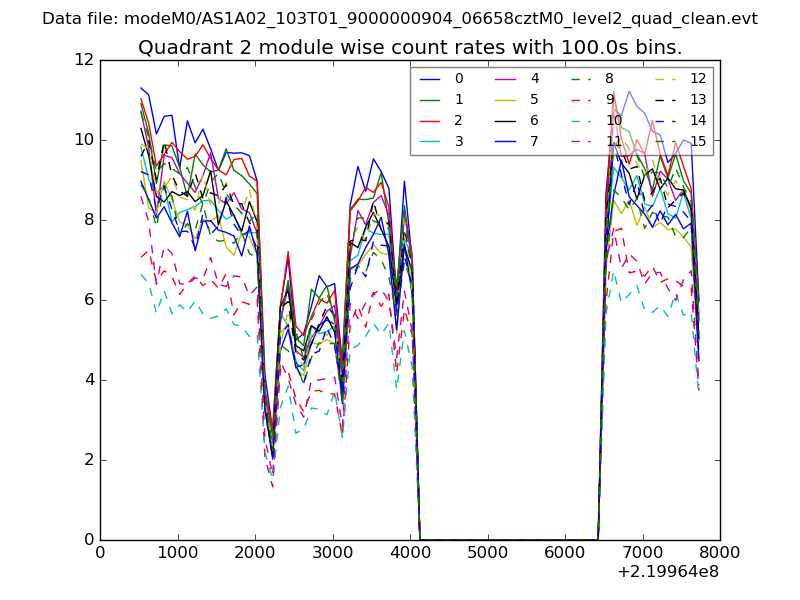
| Module-wise count rates for Quadrant B Data is divided into 100 sec bins |
 |
 |
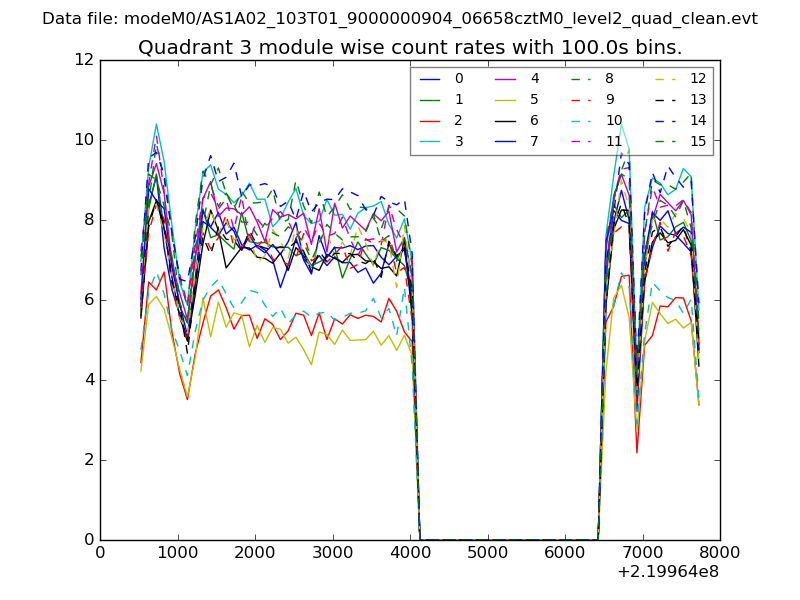
| Module-wise count rates for Quadrant C Data is divided into 100 sec bins |
 |
 |
| Module-wise count rates for Quadrant D Data is divided into 100 sec bins |
 |
 |
| Parameter | Plot |
|---|---|
| CZT HV Monitor | 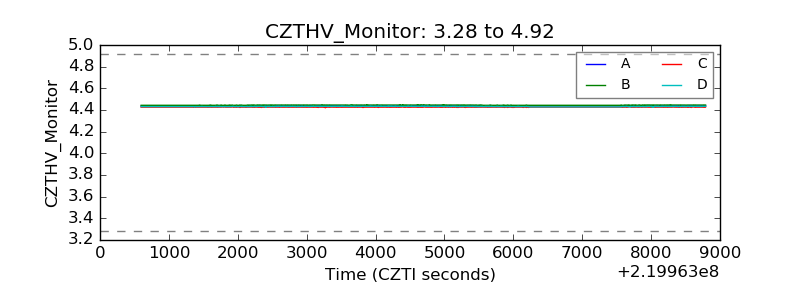 |
| D_VDD | 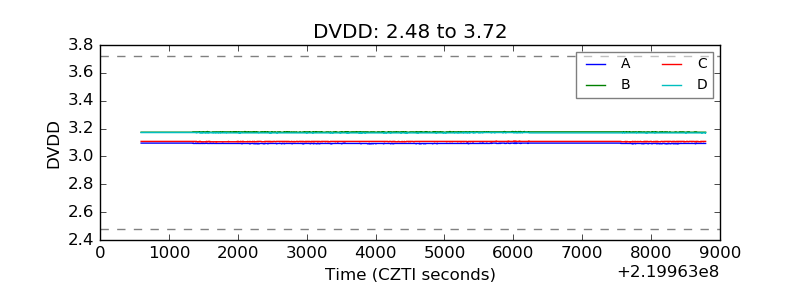 |
| Temperature 1 | 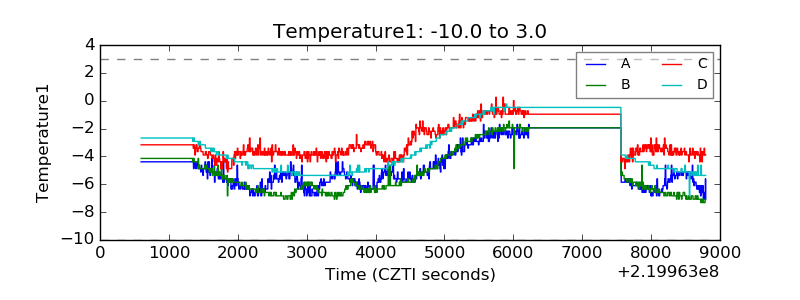 |
| Veto HV Monitor | 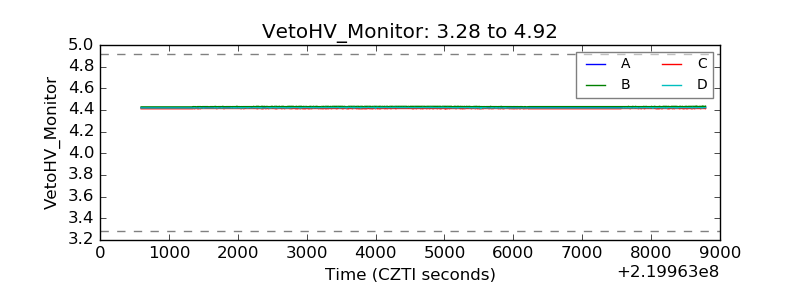 |
| Veto LLD | 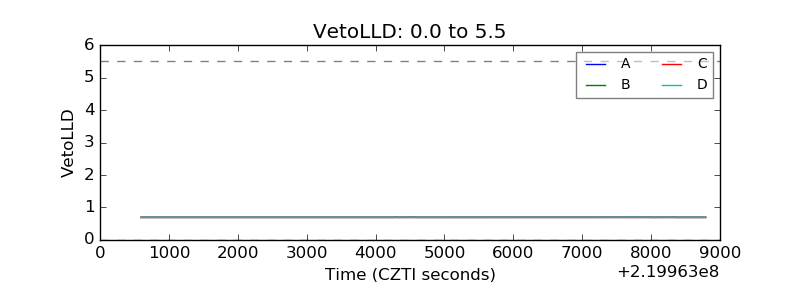 |
| Alpha Counter | 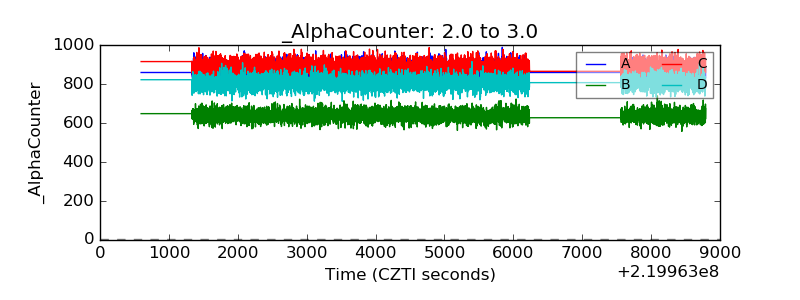 |
| _CPM_Rate | 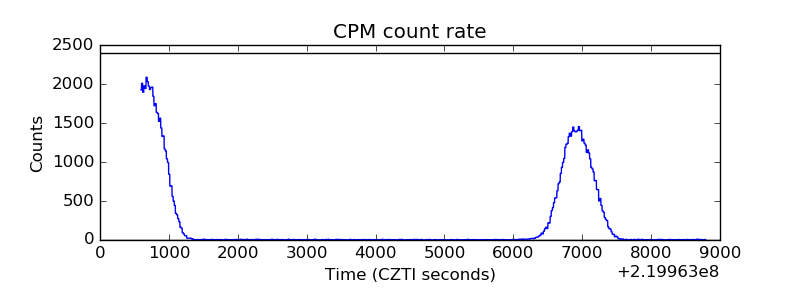 |
| CZT Counter | 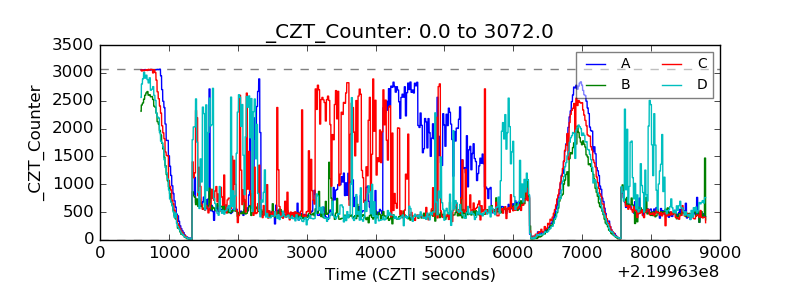 |
| +2.5 Volts monitor |  |
| +5 Volts monitor | 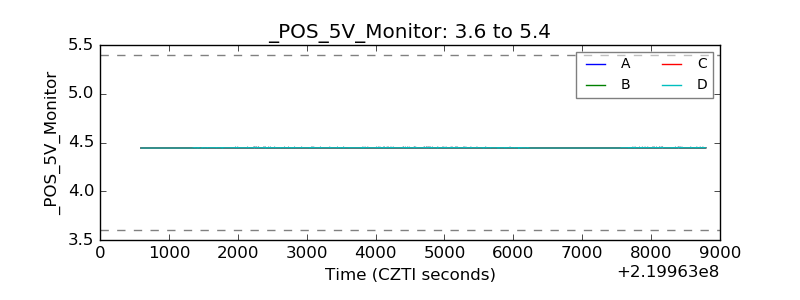 |
| _ROLL_ROT | 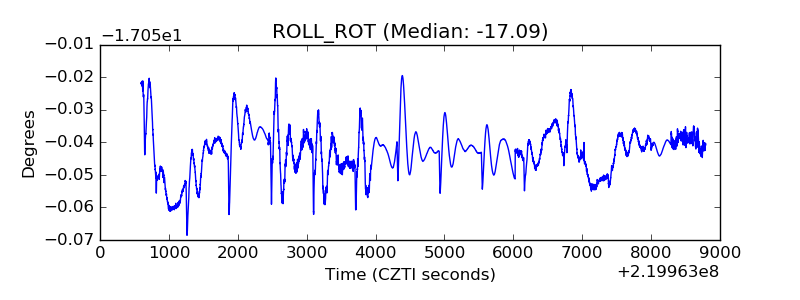 |
| _Roll_DEC | 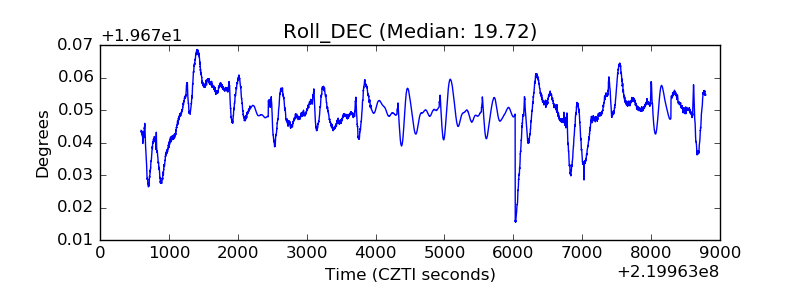 |
| _Roll_RA | 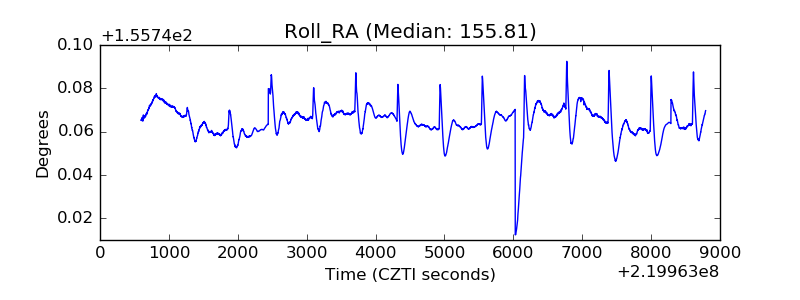 |
| Veto Counter | 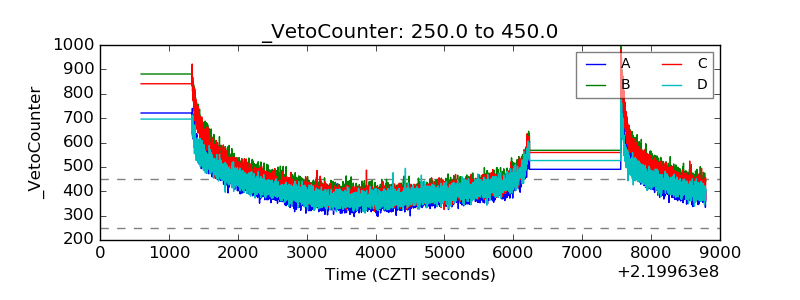 |