| Param | Original file | Final file |
|---|---|---|
| Filename | modeM0/AS1A02_103T01_9000000904_06659cztM0_level2.evt | modeM0/AS1A02_103T01_9000000904_06659cztM0_level2_quad_clean.evt |
| Size (bytes) | 490,944,960 | 97,444,800 |
| Size | 468.2 MB | 92.9 MB |
| Events in quadrant A | 3,131,313 | 628,922 |
| Events in quadrant B | 3,236,082 | 647,138 |
| Events in quadrant C | 3,064,212 | 630,168 |
| Events in quadrant D | 4,986,573 | 582,478 |
| Mode M0 | |||
|---|---|---|---|
| Quadrant | BADHDUFLAG | Total packets | Discarded packets |
| A | 0 | 13784 | 3 |
| B | 0 | 14122 | 2 |
| C | 0 | 13770 | 2 |
| D | 0 | 19379 | 2 |
| Mode M9 | |||
|---|---|---|---|
| Quadrant | BADHDUFLAG | Total packets | Discarded packets |
| A | 0 | 22 | 0 |
| B | 0 | 22 | 0 |
| C | 0 | 22 | 0 |
| D | 0 | 23 | 0 |
| Mode SS | |||
|---|---|---|---|
| Quadrant | BADHDUFLAG | Total packets | Discarded packets |
| A | 0 | 134 | 0 |
| B | 0 | 134 | 0 |
| C | 0 | 134 | 0 |
| D | 0 | 134 | 0 |
| Quadrant | Total seconds | Saturated seconds | Saturation percentage |
|---|---|---|---|
| A | 6632 | 27 | 0.407117% |
| B | 6632 | 52 | 0.784077% |
| C | 6632 | 24 | 0.361882% |
| D | 6632 | 394 | 5.940893% |
Noise dominated data is calculated using 1-second bins in cleaned event files. If a bin has >2000 counts, and if more than 50% of those come from <1% of pixels, then it is considered to be noise-dominated and hence unusable.
| Quadrant | # 1 sec bins | Bins with >0 counts | Bins with >2000 counts | High rate bins dominated by noise | Noise dominated (total time) | Noise dominated (detector-on time) | Marked lightcurve |
|---|---|---|---|---|---|---|---|
| A | 7862 | 6633 | 1 | 1 | 0.01% | 0.02% | 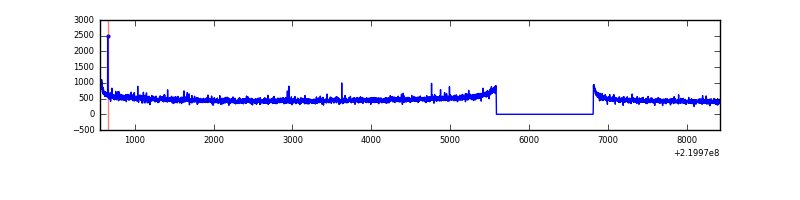 |
| B | 7862 | 6633 | 3 | 3 | 0.04% | 0.05% | 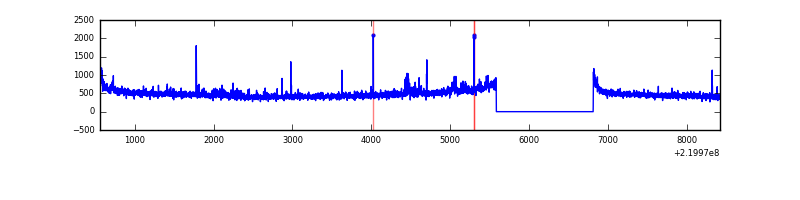 |
| C | 7862 | 6633 | 1 | 1 | 0.01% | 0.02% | 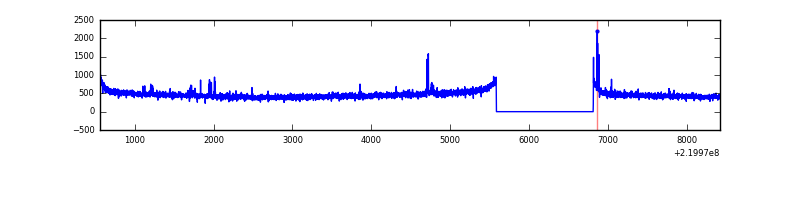 |
| D | 7862 | 6633 | 215 | 215 | 2.73% | 3.24% | 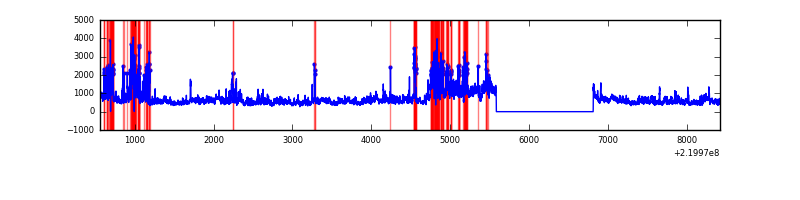 |
Top three noisy pixels from each quadrant. If the there are fewer than three noisy pixels in the level2.evt file, extra rows are filled as -1
| Pixel properties | Quadrant properties | ||||||
|---|---|---|---|---|---|---|---|
| Quadrant | DetID | PixID | Counts | Sigma | Mean | Median | Sigma |
| A | 8 | 15 | 83131 | 514.94 | 787 | 770 | 159.9 |
| A | 14 | 111 | 8931 | 51.02 | 787 | 770 | 159.9 |
| A | 0 | 226 | 7569 | 42.51 | 787 | 770 | 159.9 |
| B | 4 | 81 | 39905 | 256.13 | 802 | 786 | 152.7 |
| B | 0 | 228 | 25325 | 160.66 | 802 | 786 | 152.7 |
| B | 12 | 111 | 15368 | 95.47 | 802 | 786 | 152.7 |
| C | 9 | 247 | 36383 | 198.47 | 769 | 776 | 179.4 |
| C | 4 | 254 | 26112 | 141.22 | 769 | 776 | 179.4 |
| C | 13 | 61 | 6094 | 29.64 | 769 | 776 | 179.4 |
| D | 8 | 195 | 1048331 | 5747.53 | 741 | 719 | 182.3 |
| D | 2 | 33 | 720697 | 3950.03 | 741 | 719 | 182.3 |
| D | 2 | 152 | 250932 | 1372.75 | 741 | 719 | 182.3 |
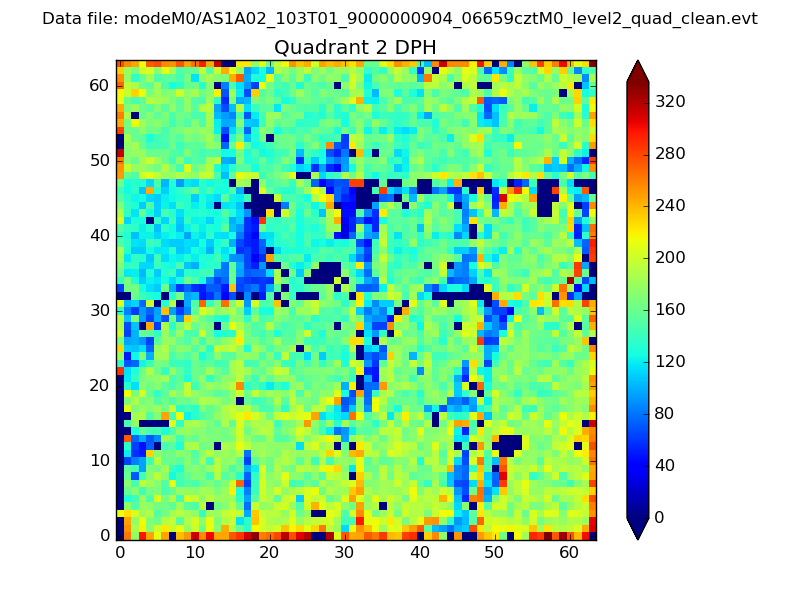
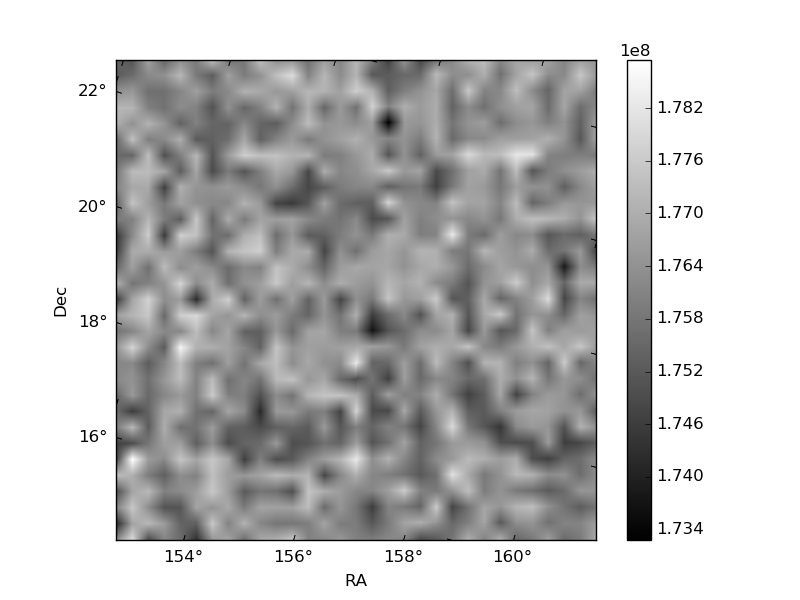
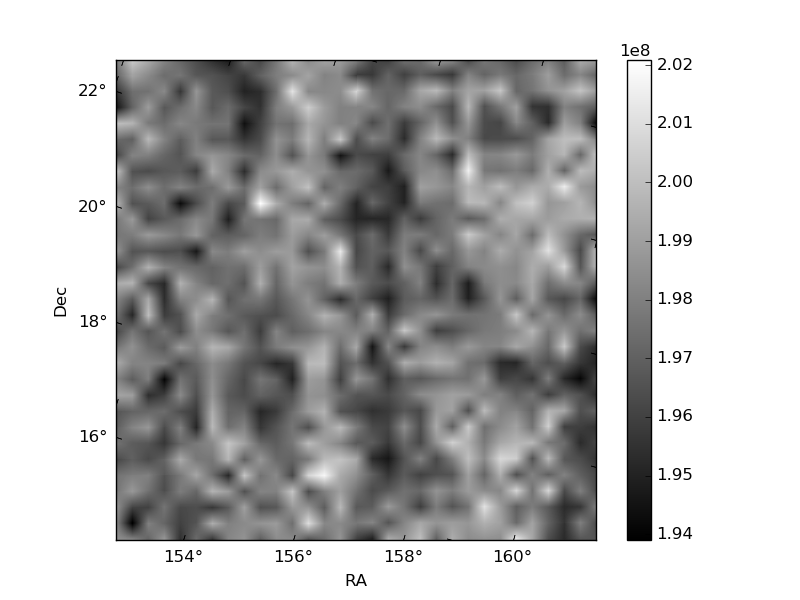
Histogram calculated using DETX and DETY for each event in the final _common_clean file
| Quadrant A | 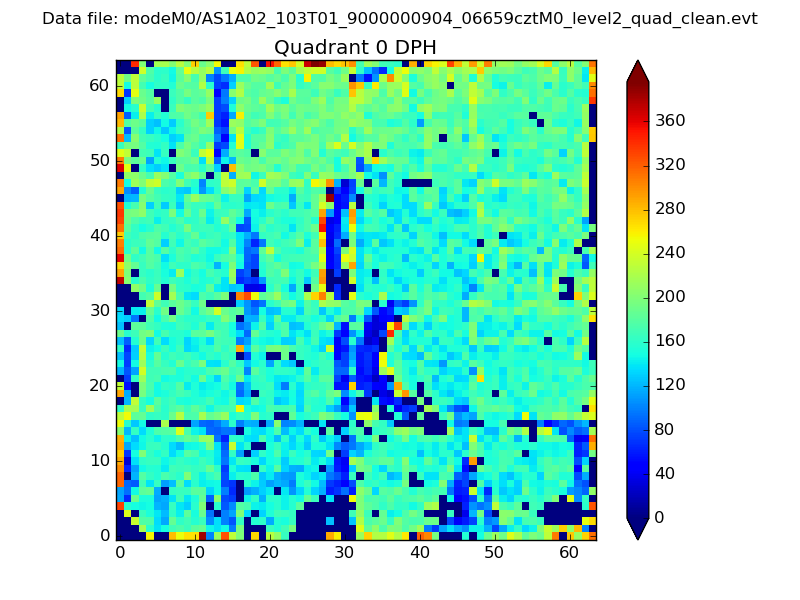 |
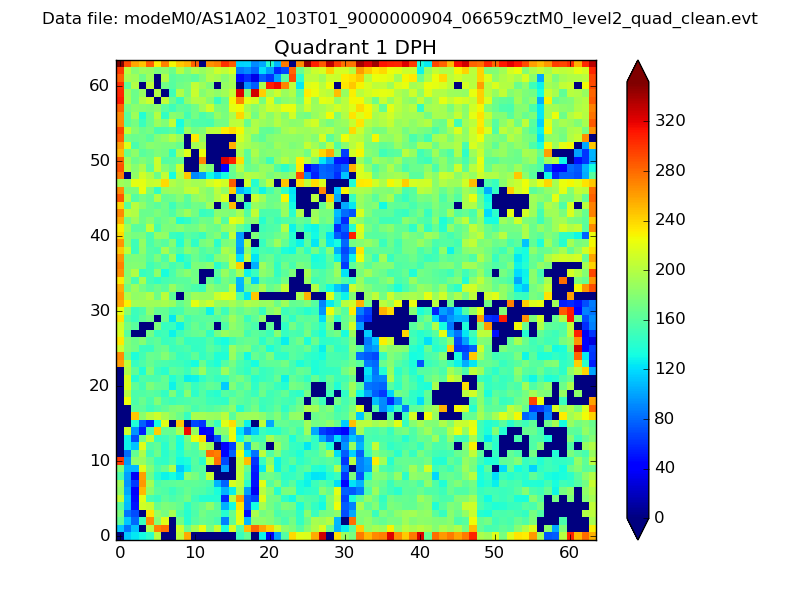 |
Quadrant B |
|---|---|---|---|
| Quadrant D | 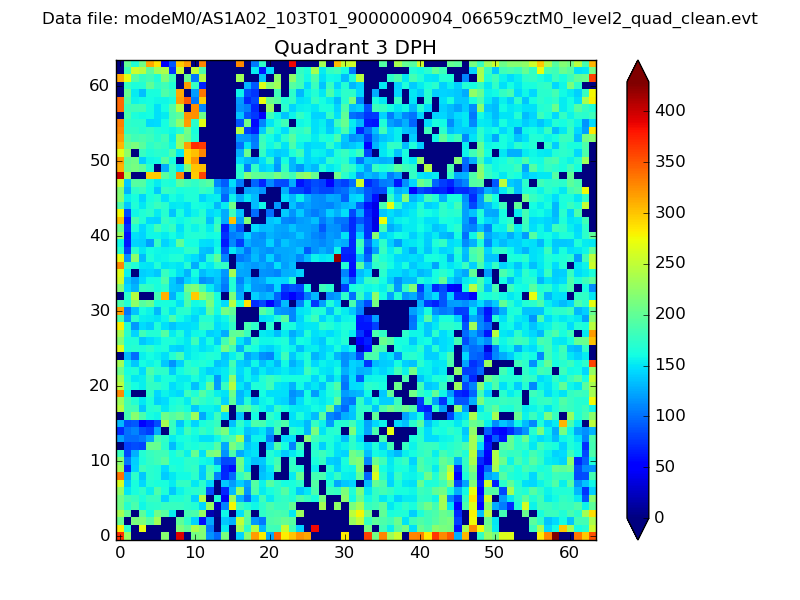 |
 |
Quadrant C |
| Plot type | Count rate plots | Images |
|---|---|---|
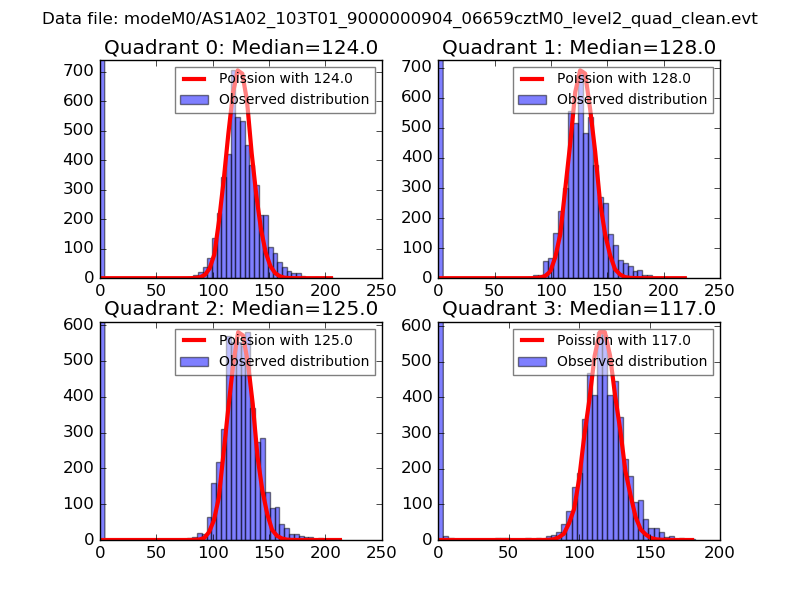
| Comparison with Poisson distribution Blue bars denote a histogram of data divided into 1 sec bins. Red curve is a Poisson curve with rate = median count rate of data. |
 |
 |
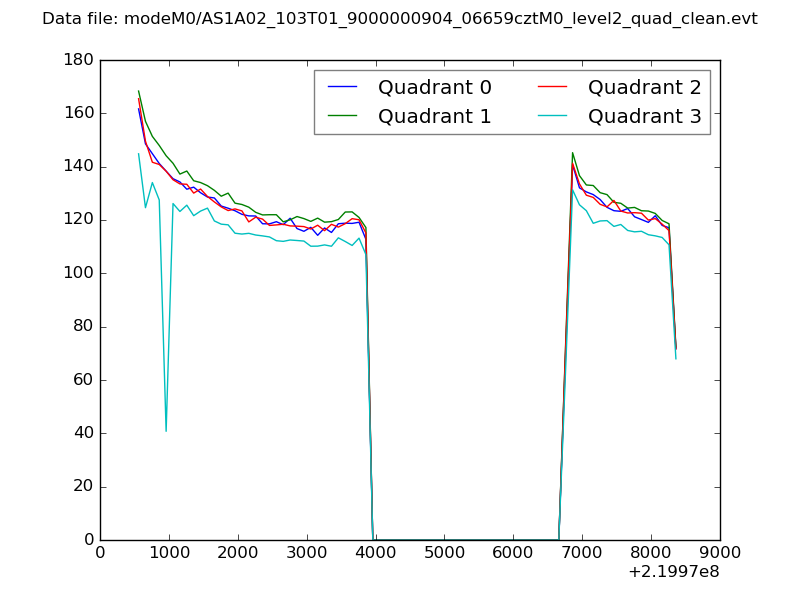
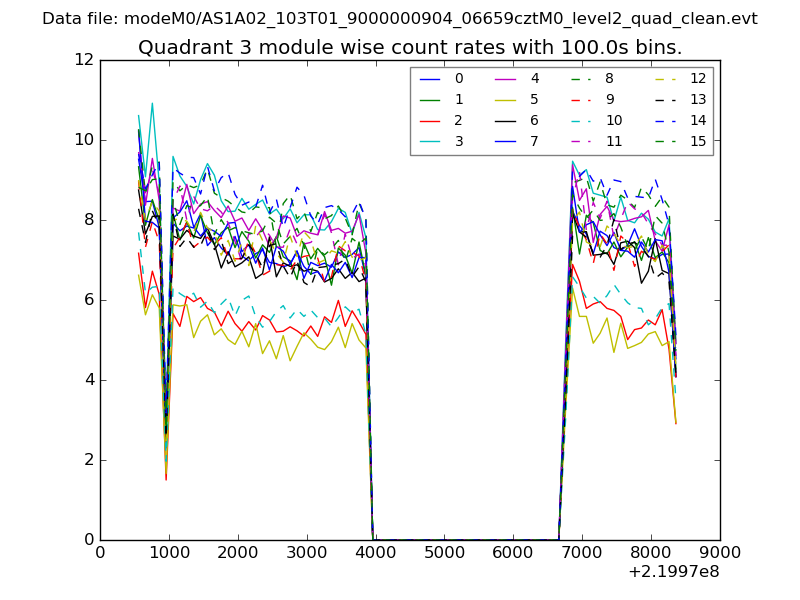
| Quadrant-wise count rates Data is divided into 100 sec bins |
 |
|
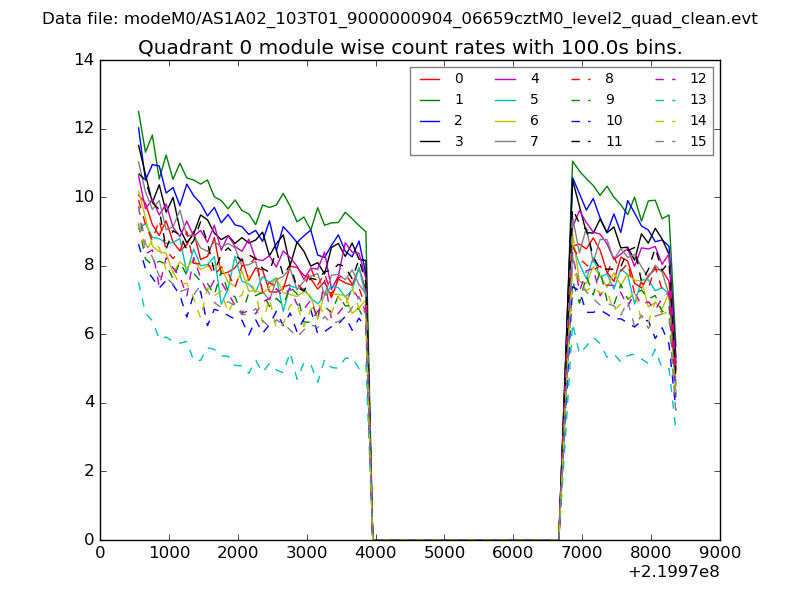
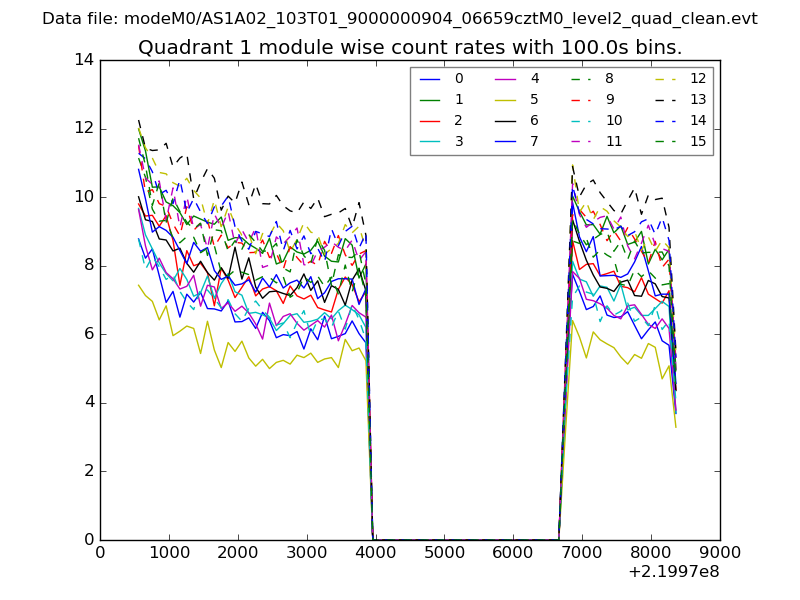
| Module-wise count rates for Quadrant A Data is divided into 100 sec bins |
 |
 |
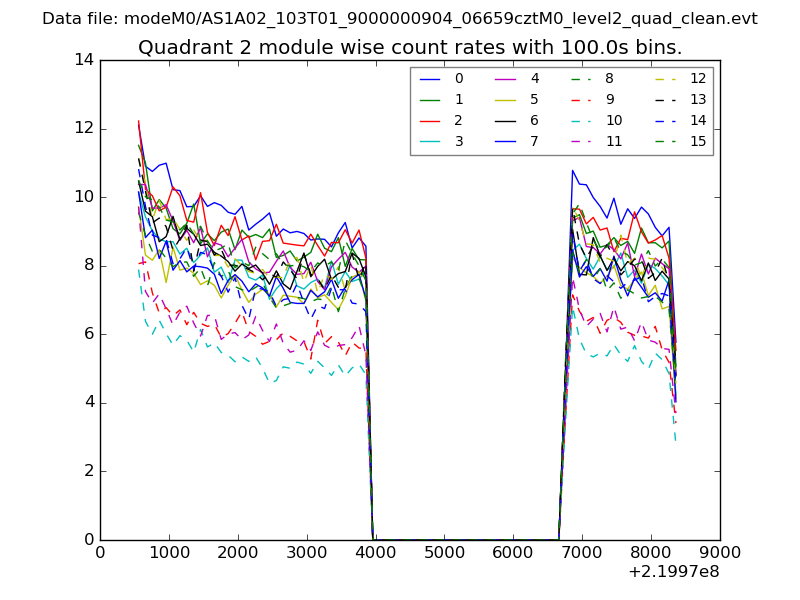
| Module-wise count rates for Quadrant B Data is divided into 100 sec bins |
 |
 |
| Module-wise count rates for Quadrant C Data is divided into 100 sec bins |
 |
 |
| Module-wise count rates for Quadrant D Data is divided into 100 sec bins |
 |
 |
| Parameter | Plot |
|---|---|
| CZT HV Monitor | 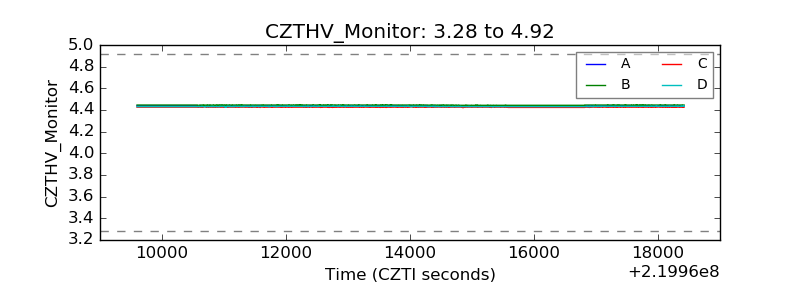 |
| D_VDD | 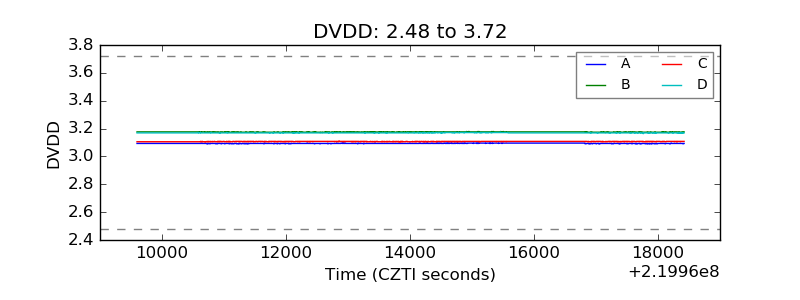 |
| Temperature 1 | 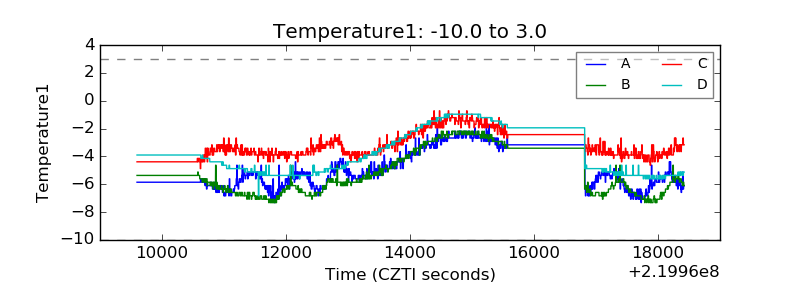 |
| Veto HV Monitor | 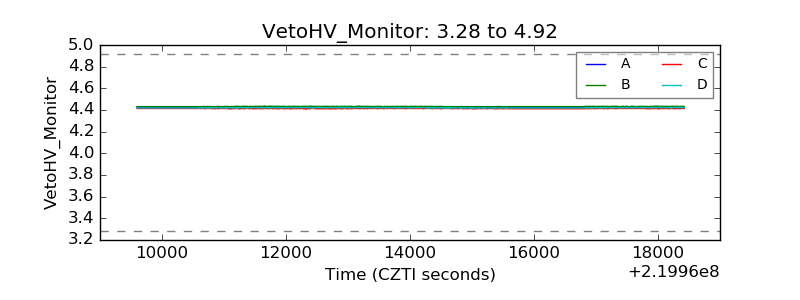 |
| Veto LLD | 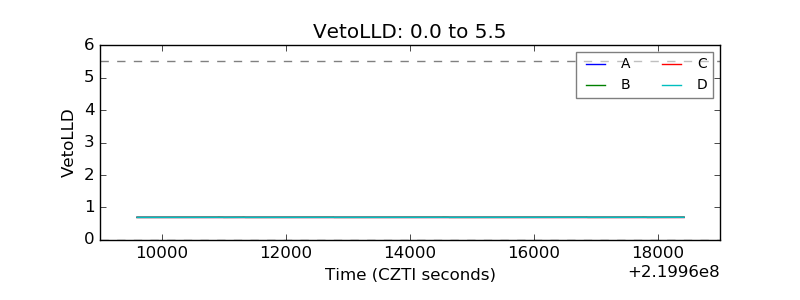 |
| Alpha Counter | 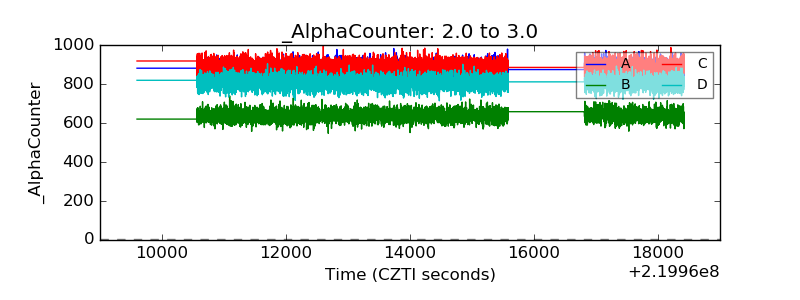 |
| _CPM_Rate | 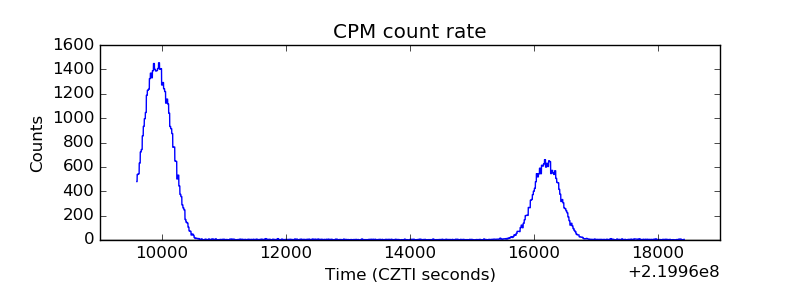 |
| CZT Counter | 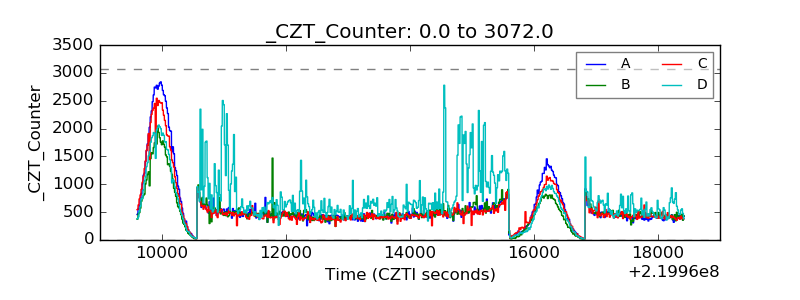 |
| +2.5 Volts monitor |  |
| +5 Volts monitor |  |
| _ROLL_ROT | 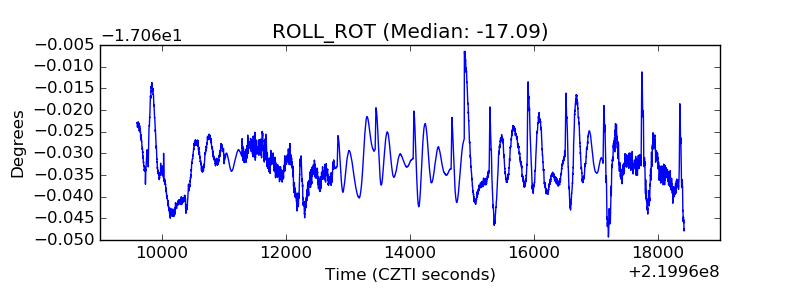 |
| _Roll_DEC | 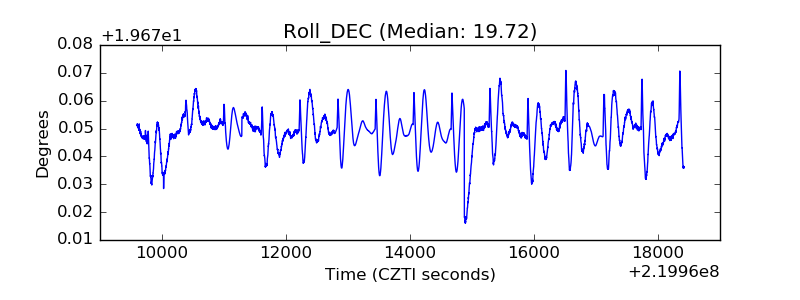 |
| _Roll_RA | 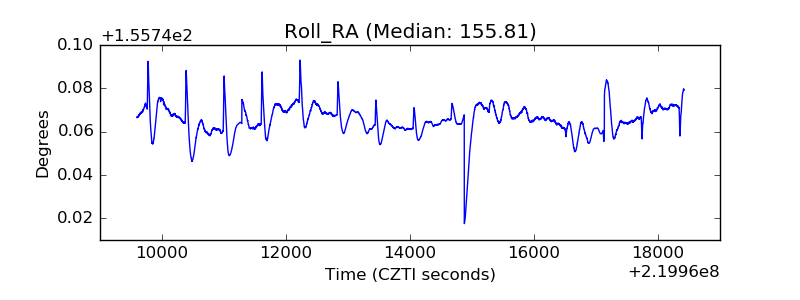 |
| Veto Counter | 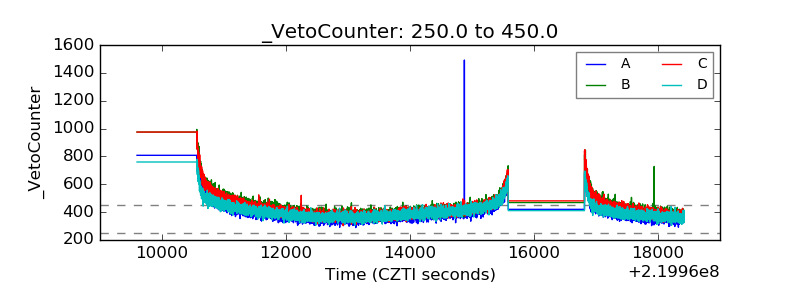 |