| Param | Original file | Final file |
|---|---|---|
| Filename | modeM0/AS1A02_103T01_9000000904_06660cztM0_level2.evt | modeM0/AS1A02_103T01_9000000904_06660cztM0_level2_quad_clean.evt |
| Size (bytes) | 529,375,680 | 89,703,360 |
| Size | 504.9 MB | 85.5 MB |
| Events in quadrant A | 3,192,960 | 562,156 |
| Events in quadrant B | 3,327,493 | 577,181 |
| Events in quadrant C | 3,219,401 | 563,971 |
| Events in quadrant D | 5,820,452 | 528,712 |
| Mode M0 | |||
|---|---|---|---|
| Quadrant | BADHDUFLAG | Total packets | Discarded packets |
| A | 0 | 14402 | 3 |
| B | 0 | 14716 | 2 |
| C | 0 | 14571 | 2 |
| D | 0 | 22118 | 2 |
| Mode M9 | |||
|---|---|---|---|
| Quadrant | BADHDUFLAG | Total packets | Discarded packets |
| A | 0 | 18 | 0 |
| B | 0 | 18 | 0 |
| C | 0 | 18 | 0 |
| D | 0 | 19 | 0 |
| Mode SS | |||
|---|---|---|---|
| Quadrant | BADHDUFLAG | Total packets | Discarded packets |
| A | 0 | 140 | 0 |
| B | 0 | 140 | 0 |
| C | 0 | 140 | 0 |
| D | 0 | 140 | 0 |
| Quadrant | Total seconds | Saturated seconds | Saturation percentage |
|---|---|---|---|
| A | 6957 | 56 | 0.804945% |
| B | 6957 | 78 | 1.121173% |
| C | 6957 | 47 | 0.675579% |
| D | 6957 | 718 | 10.320540% |
Noise dominated data is calculated using 1-second bins in cleaned event files. If a bin has >2000 counts, and if more than 50% of those come from <1% of pixels, then it is considered to be noise-dominated and hence unusable.
| Quadrant | # 1 sec bins | Bins with >0 counts | Bins with >2000 counts | High rate bins dominated by noise | Noise dominated (total time) | Noise dominated (detector-on time) | Marked lightcurve |
|---|---|---|---|---|---|---|---|
| A | 7902 | 6958 | 1 | 1 | 0.01% | 0.01% | 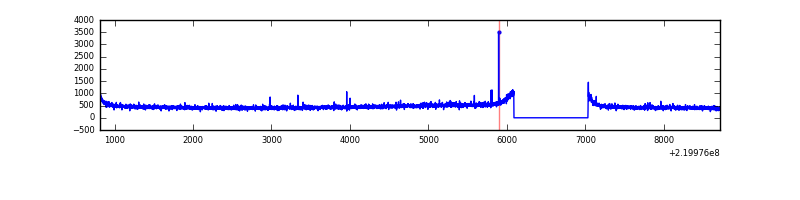 |
| B | 7902 | 6958 | 1 | 1 | 0.01% | 0.01% | 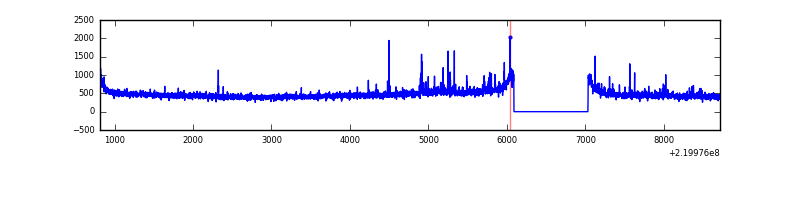 |
| C | 7902 | 6958 | 3 | 3 | 0.04% | 0.04% | 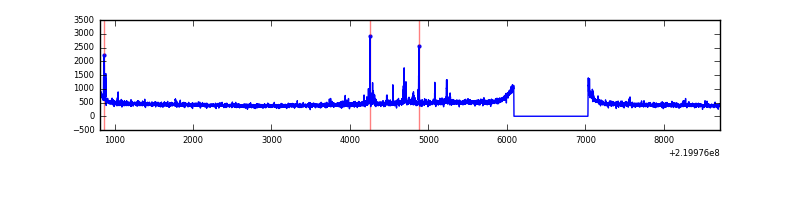 |
| D | 7902 | 6958 | 448 | 448 | 5.67% | 6.44% | 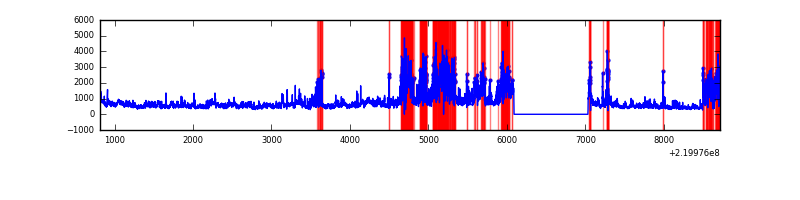 |
Top three noisy pixels from each quadrant. If the there are fewer than three noisy pixels in the level2.evt file, extra rows are filled as -1
| Pixel properties | Quadrant properties | ||||||
|---|---|---|---|---|---|---|---|
| Quadrant | DetID | PixID | Counts | Sigma | Mean | Median | Sigma |
| A | 8 | 15 | 31068 | 182.74 | 815 | 796 | 165.7 |
| A | 8 | 160 | 8121 | 44.22 | 815 | 796 | 165.7 |
| A | 12 | 194 | 7717 | 41.78 | 815 | 796 | 165.7 |
| B | 0 | 228 | 47889 | 296.55 | 825 | 807 | 158.8 |
| B | 4 | 81 | 27287 | 166.79 | 825 | 807 | 158.8 |
| B | 4 | 173 | 16647 | 99.77 | 825 | 807 | 158.8 |
| C | 9 | 247 | 94719 | 507.82 | 793 | 798 | 184.9 |
| C | 9 | 16 | 26483 | 138.88 | 793 | 798 | 184.9 |
| C | 13 | 61 | 6247 | 29.46 | 793 | 798 | 184.9 |
| D | 2 | 33 | 1672074 | 9035.66 | 746 | 722 | 185.0 |
| D | 8 | 195 | 964392 | 5209.79 | 746 | 722 | 185.0 |
| D | 2 | 152 | 322327 | 1738.66 | 746 | 722 | 185.0 |
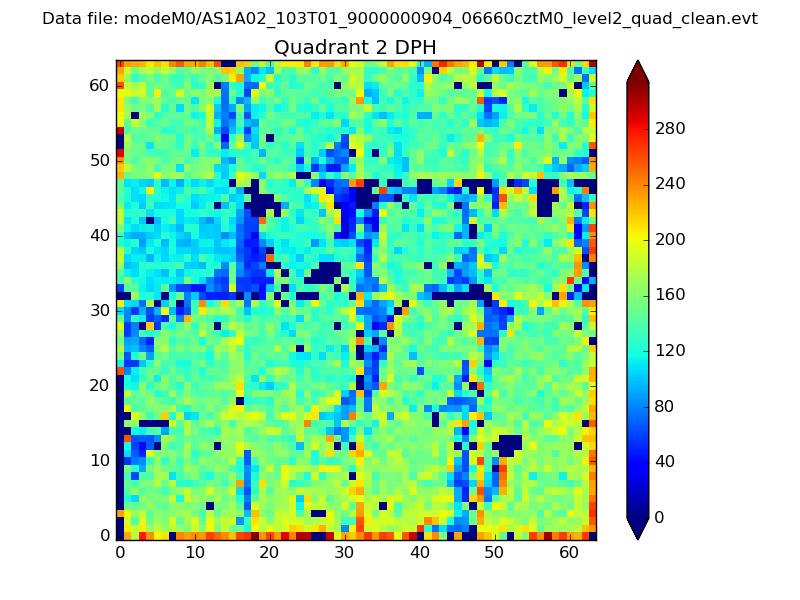
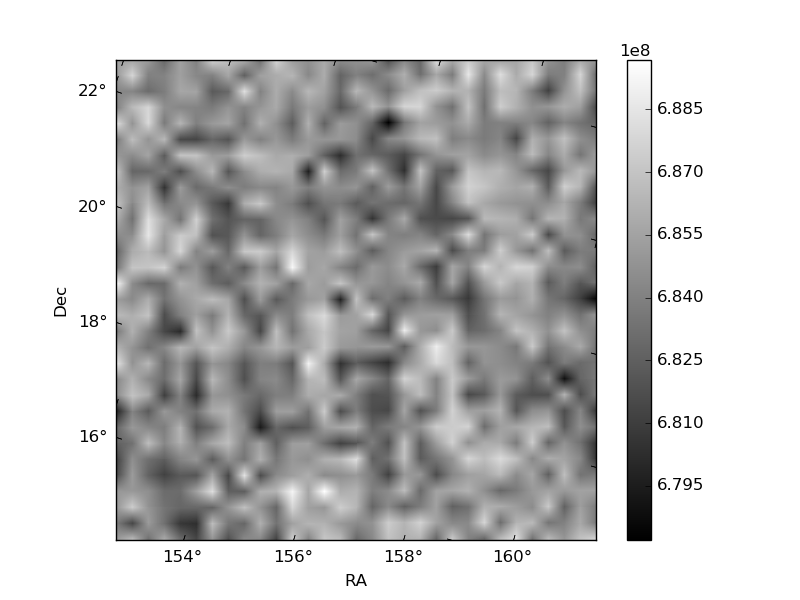
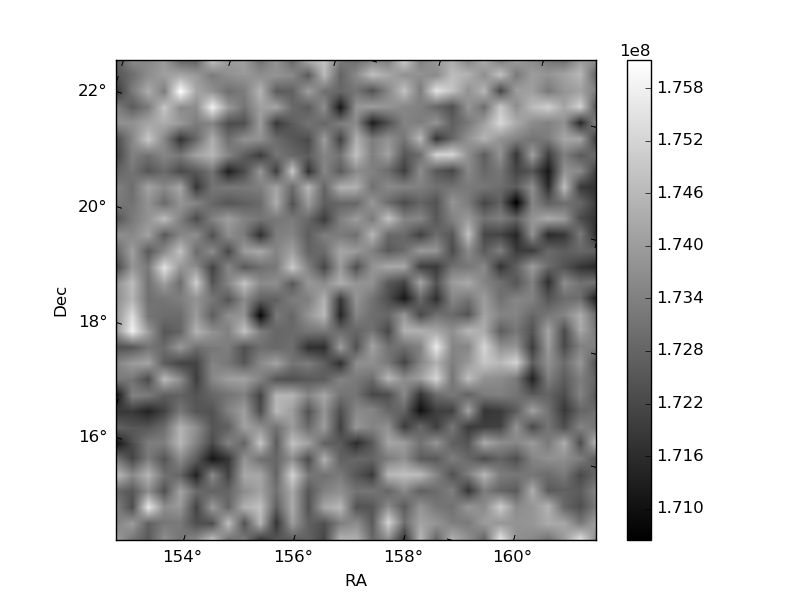
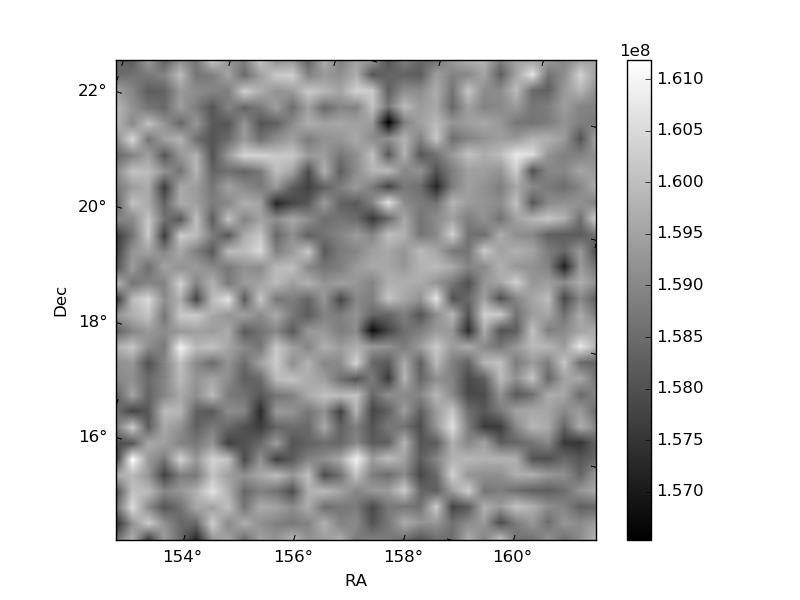
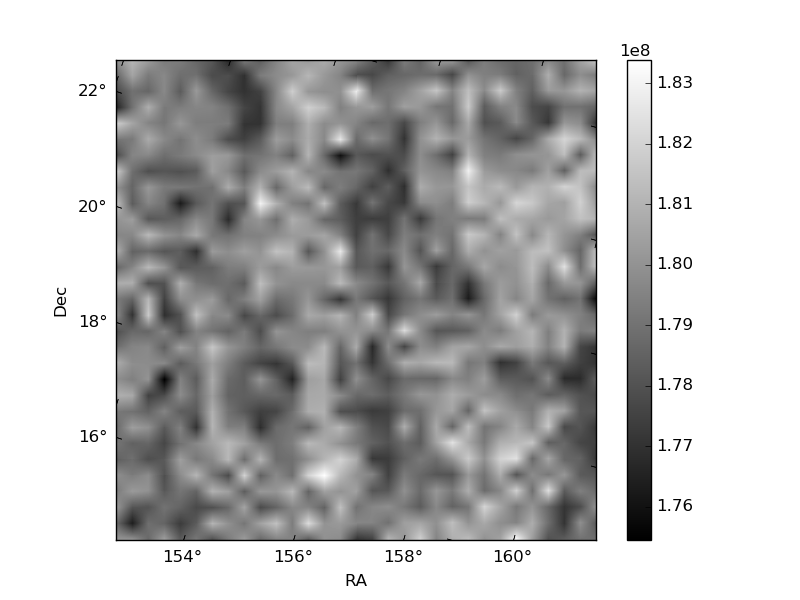
Histogram calculated using DETX and DETY for each event in the final _common_clean file
| Quadrant A | 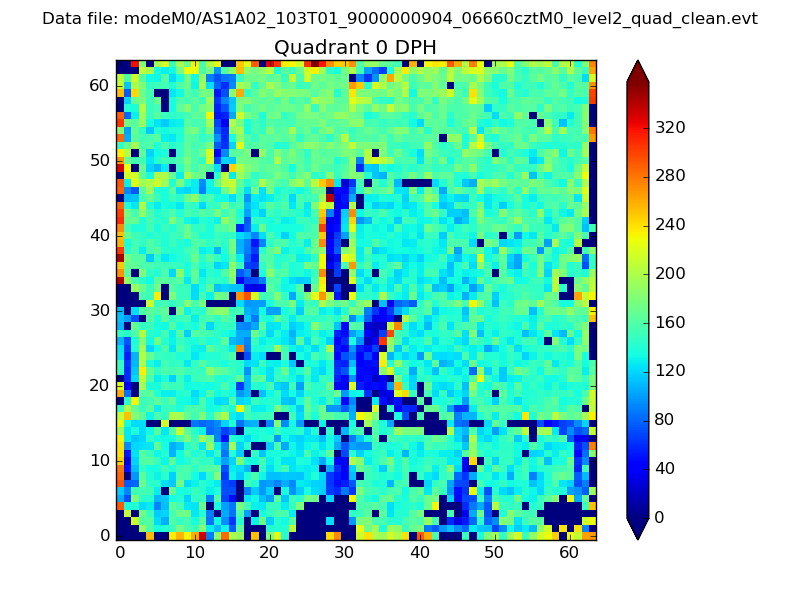 |
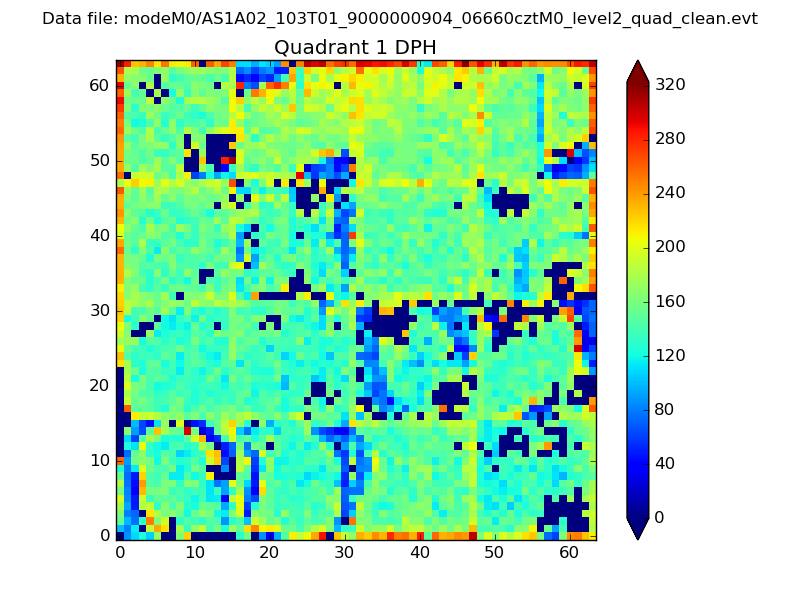 |
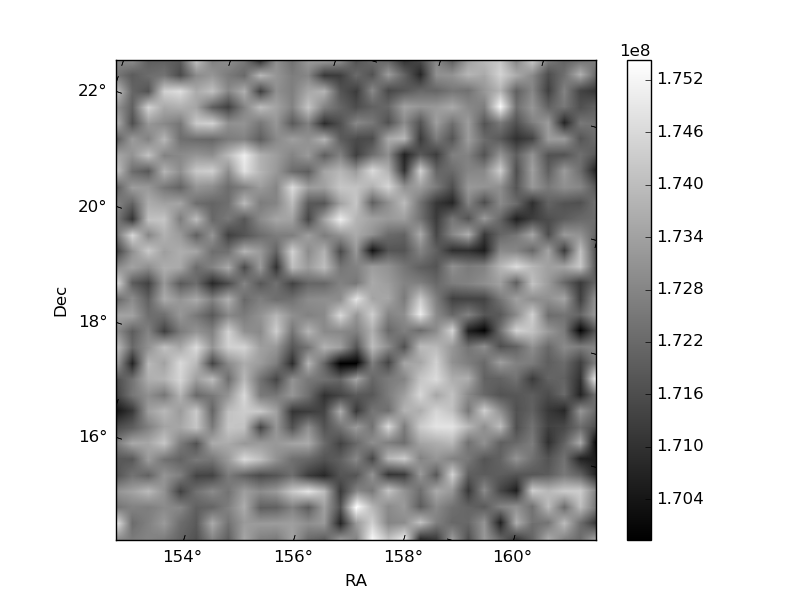
Quadrant B |
|---|---|---|---|
| Quadrant D | 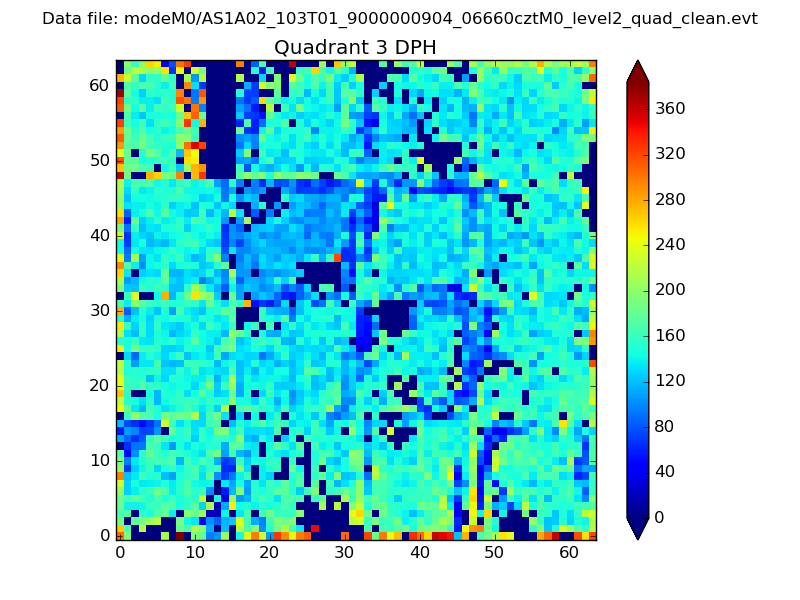 |
 |
Quadrant C |
| Plot type | Count rate plots | Images |
|---|---|---|
| Comparison with Poisson distribution Blue bars denote a histogram of data divided into 1 sec bins. Red curve is a Poisson curve with rate = median count rate of data. |
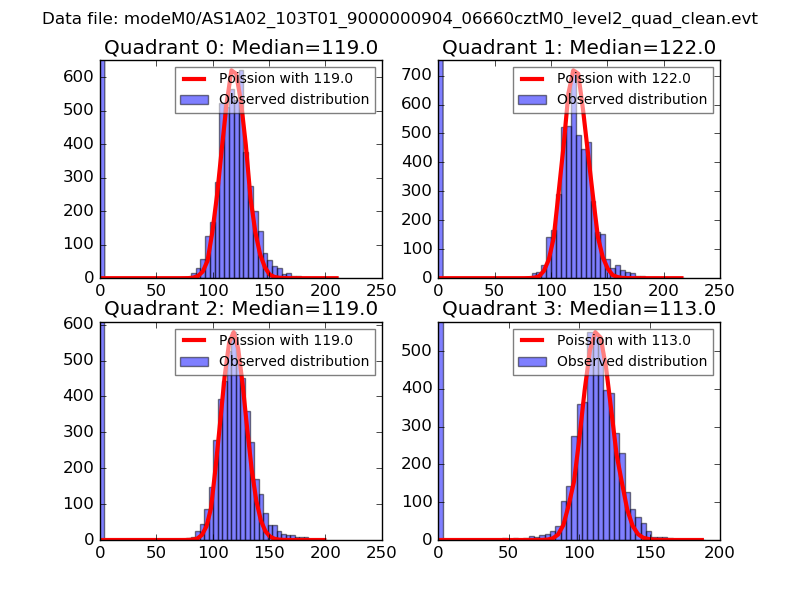 |
 |
| Quadrant-wise count rates Data is divided into 100 sec bins |
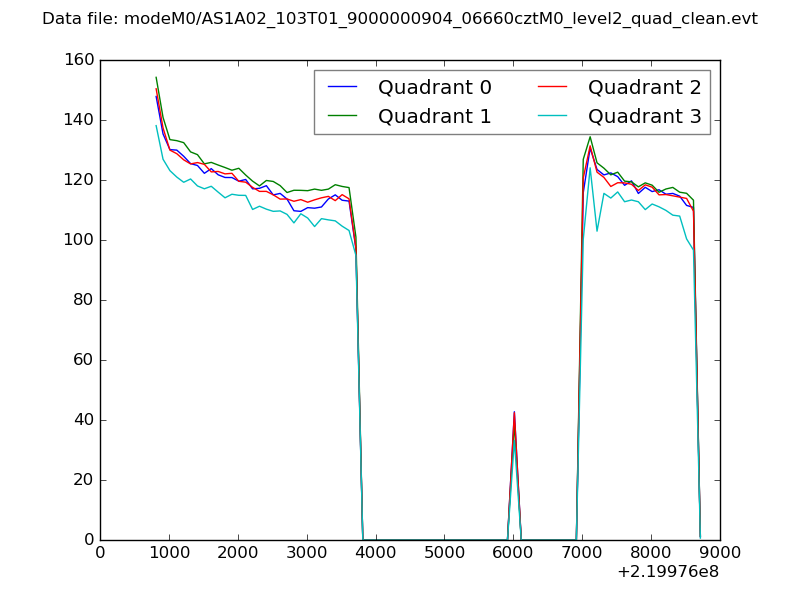 |
|
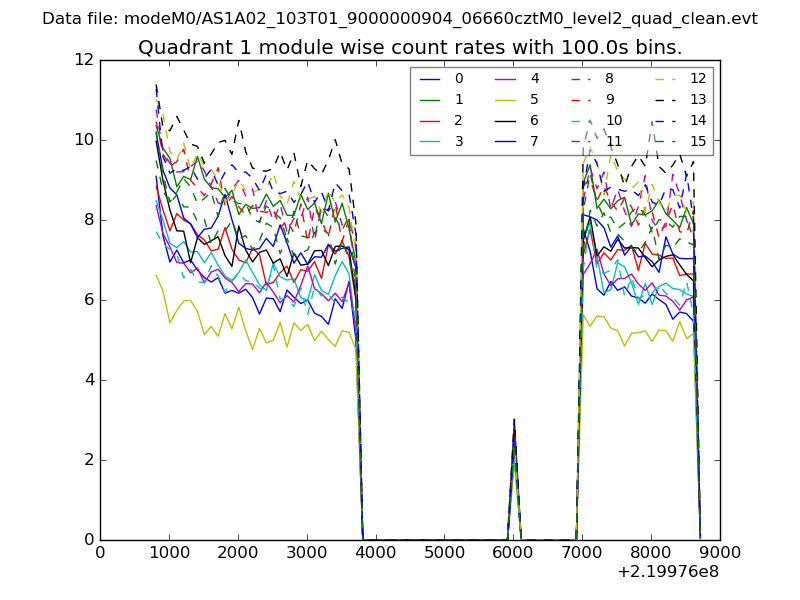
| Module-wise count rates for Quadrant A Data is divided into 100 sec bins |
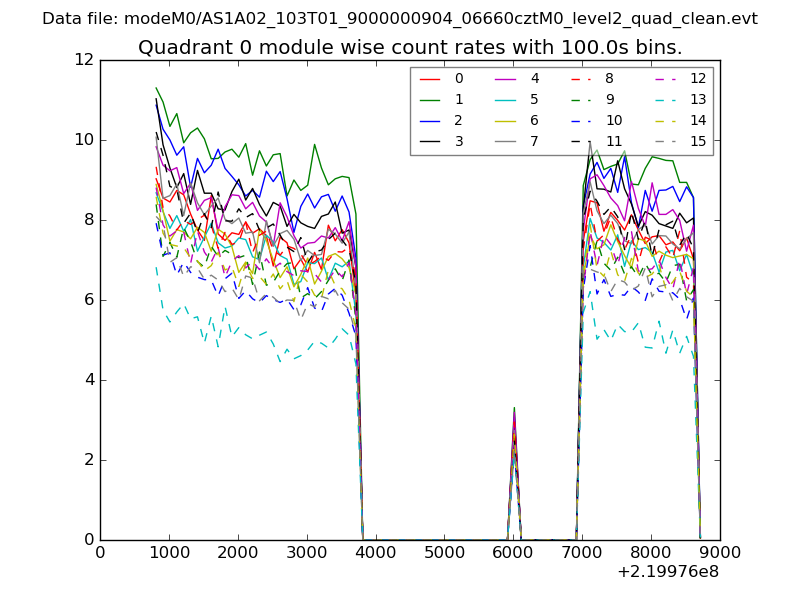 |
 |
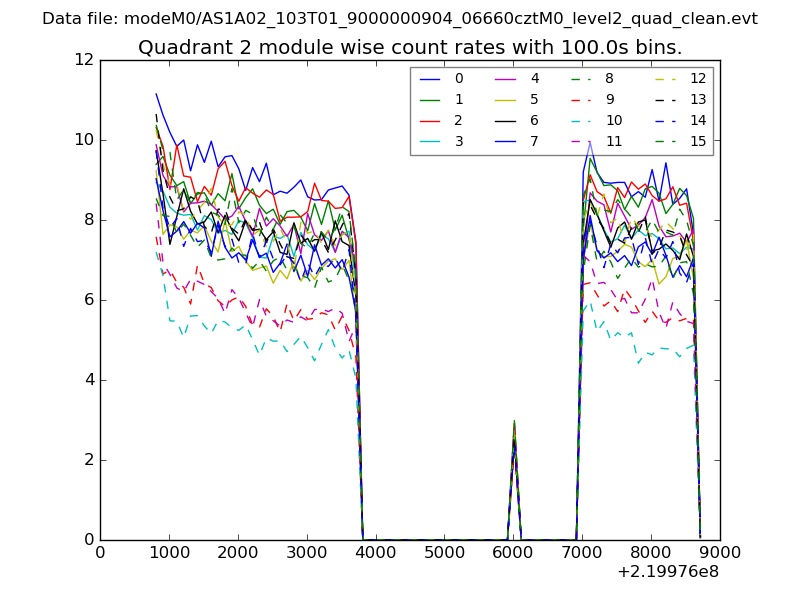
| Module-wise count rates for Quadrant B Data is divided into 100 sec bins |
 |
 |
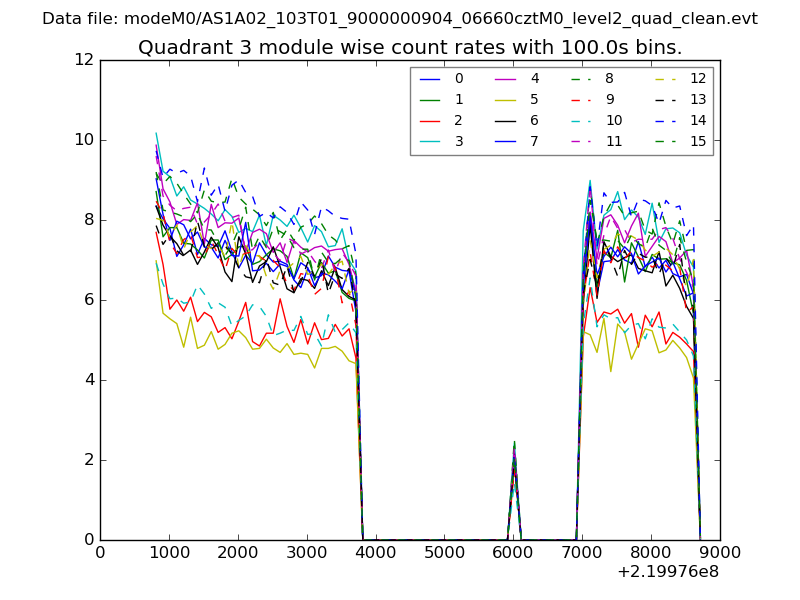
| Module-wise count rates for Quadrant C Data is divided into 100 sec bins |
 |
 |
| Module-wise count rates for Quadrant D Data is divided into 100 sec bins |
 |
 |
| Parameter | Plot |
|---|---|
| CZT HV Monitor | 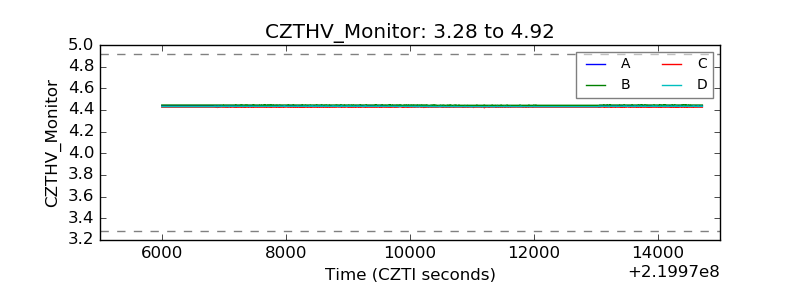 |
| D_VDD | 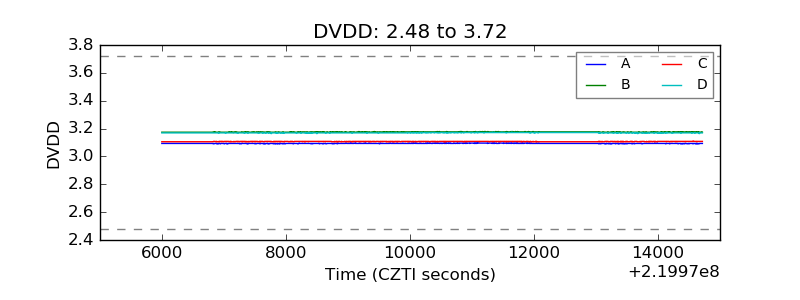 |
| Temperature 1 | 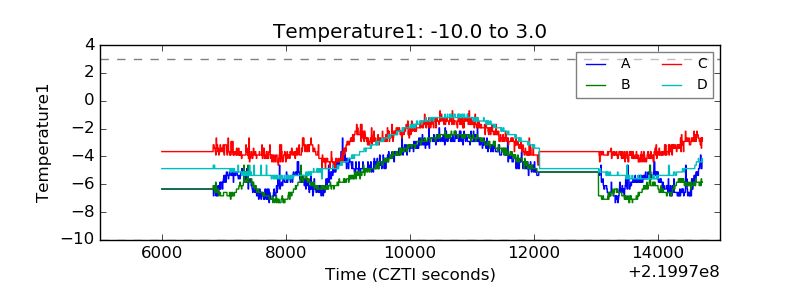 |
| Veto HV Monitor | 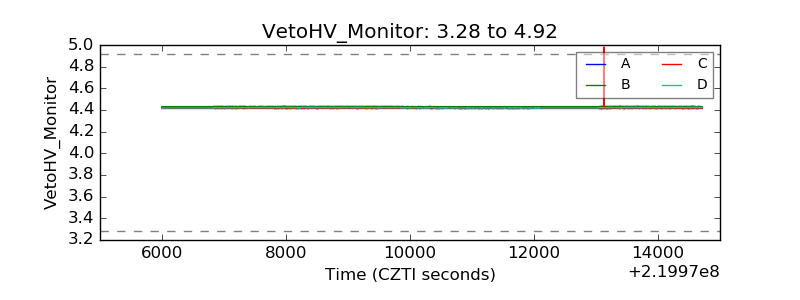 |
| Veto LLD | 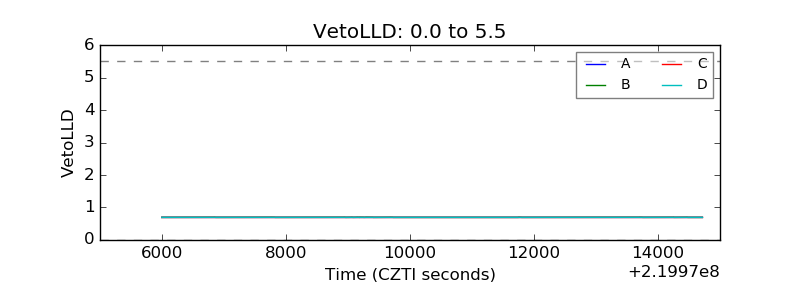 |
| Alpha Counter | 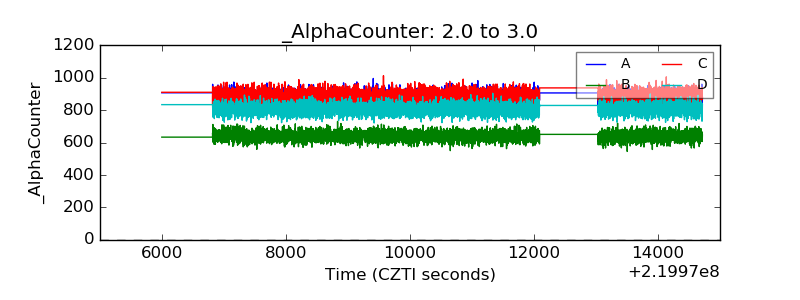 |
| _CPM_Rate | 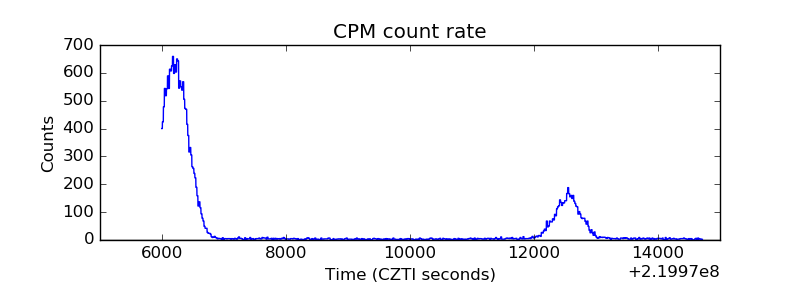 |
| CZT Counter | 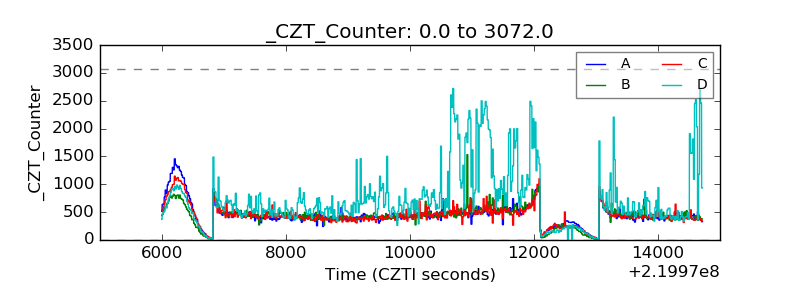 |
| +2.5 Volts monitor |  |
| +5 Volts monitor | 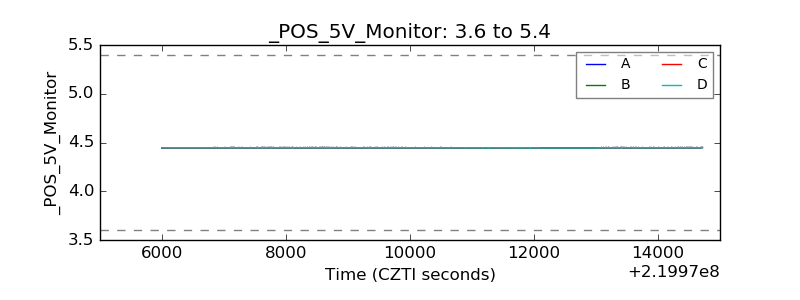 |
| _ROLL_ROT | 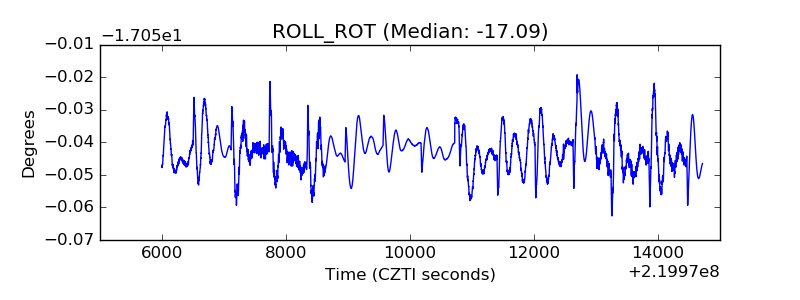 |
| _Roll_DEC | 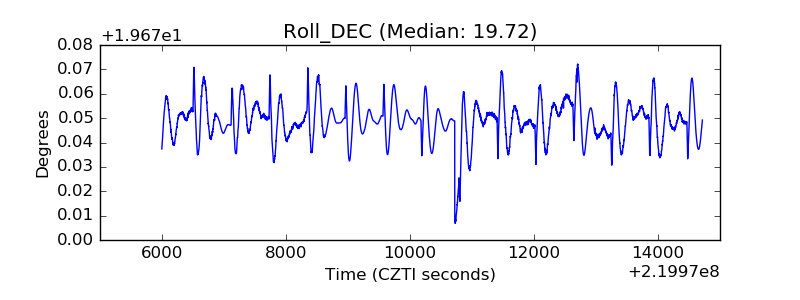 |
| _Roll_RA | 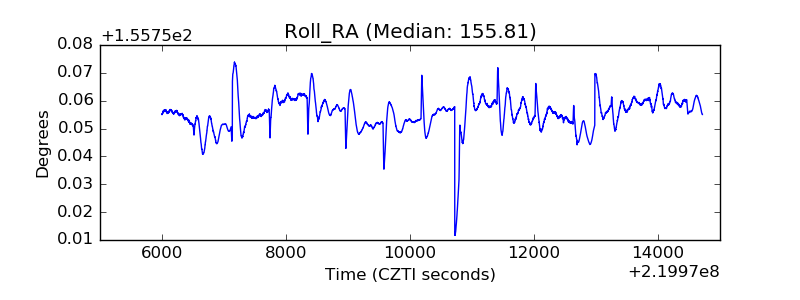 |
| Veto Counter | 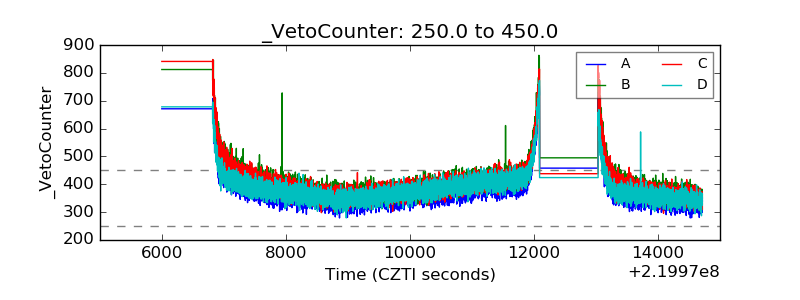 |