| Param | Original file | Final file |
|---|---|---|
| Filename | modeM0/AS1A02_103T01_9000000904_06661cztM0_level2.evt | modeM0/AS1A02_103T01_9000000904_06661cztM0_level2_quad_clean.evt |
| Size (bytes) | 621,653,760 | 94,907,520 |
| Size | 592.9 MB | 90.5 MB |
| Events in quadrant A | 3,392,458 | 612,469 |
| Events in quadrant B | 3,631,405 | 620,610 |
| Events in quadrant C | 3,316,693 | 612,167 |
| Events in quadrant D | 7,984,148 | 513,292 |
| Mode M0 | |||
|---|---|---|---|
| Quadrant | BADHDUFLAG | Total packets | Discarded packets |
| A | 0 | 15386 | 3 |
| B | 0 | 15872 | 2 |
| C | 0 | 15263 | 2 |
| D | 0 | 28918 | 2 |
| Mode M9 | |||
|---|---|---|---|
| Quadrant | BADHDUFLAG | Total packets | Discarded packets |
| A | 0 | 7 | 0 |
| B | 0 | 7 | 0 |
| C | 0 | 7 | 0 |
| D | 0 | 8 | 0 |
| Mode SS | |||
|---|---|---|---|
| Quadrant | BADHDUFLAG | Total packets | Discarded packets |
| A | 0 | 150 | 0 |
| B | 0 | 150 | 0 |
| C | 0 | 150 | 0 |
| D | 0 | 150 | 0 |
| Quadrant | Total seconds | Saturated seconds | Saturation percentage |
|---|---|---|---|
| A | 7402 | 121 | 1.634693% |
| B | 7402 | 141 | 1.904891% |
| C | 7402 | 47 | 0.634964% |
| D | 7402 | 1572 | 21.237503% |
Noise dominated data is calculated using 1-second bins in cleaned event files. If a bin has >2000 counts, and if more than 50% of those come from <1% of pixels, then it is considered to be noise-dominated and hence unusable.
| Quadrant | # 1 sec bins | Bins with >0 counts | Bins with >2000 counts | High rate bins dominated by noise | Noise dominated (total time) | Noise dominated (detector-on time) | Marked lightcurve |
|---|---|---|---|---|---|---|---|
| A | 7942 | 7403 | 10 | 10 | 0.13% | 0.14% | 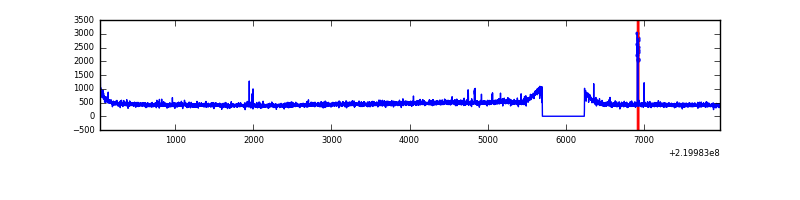 |
| B | 7942 | 7403 | 9 | 9 | 0.11% | 0.12% | 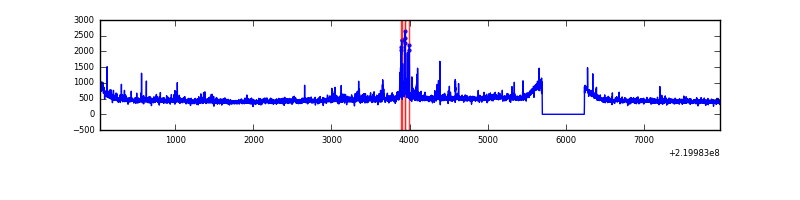 |
| C | 7942 | 7403 | 0 | 0 | 0.00% | 0.00% | 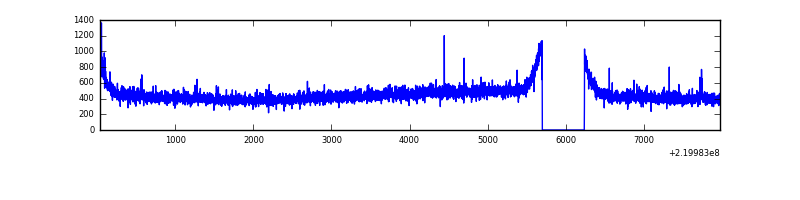 |
| D | 7942 | 7403 | 1241 | 1241 | 15.63% | 16.76% | 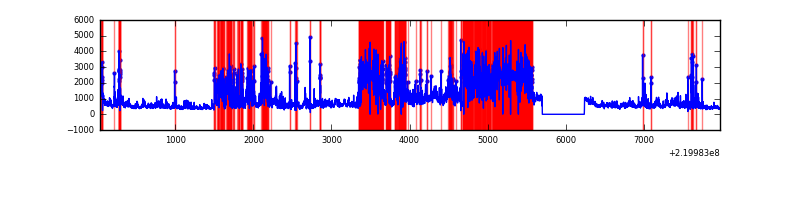 |
Top three noisy pixels from each quadrant. If the there are fewer than three noisy pixels in the level2.evt file, extra rows are filled as -1
| Pixel properties | Quadrant properties | ||||||
|---|---|---|---|---|---|---|---|
| Quadrant | DetID | PixID | Counts | Sigma | Mean | Median | Sigma |
| A | 14 | 111 | 40249 | 221.2 | 865 | 846 | 178.1 |
| A | 0 | 226 | 8048 | 40.43 | 865 | 846 | 178.1 |
| A | 12 | 194 | 7981 | 40.05 | 865 | 846 | 178.1 |
| B | 0 | 228 | 104371 | 612.92 | 873 | 851 | 168.9 |
| B | 4 | 81 | 60734 | 354.55 | 873 | 851 | 168.9 |
| B | 4 | 173 | 37112 | 214.69 | 873 | 851 | 168.9 |
| C | 9 | 16 | 28970 | 142.64 | 841 | 847 | 197.2 |
| C | 13 | 61 | 6751 | 29.95 | 841 | 847 | 197.2 |
| C | 9 | 247 | 4931 | 20.71 | 841 | 847 | 197.2 |
| D | 2 | 33 | 4005596 | 22314.45 | 727 | 704 | 179.5 |
| D | 8 | 195 | 916780 | 5104.19 | 727 | 704 | 179.5 |
| D | 2 | 152 | 228272 | 1267.96 | 727 | 704 | 179.5 |
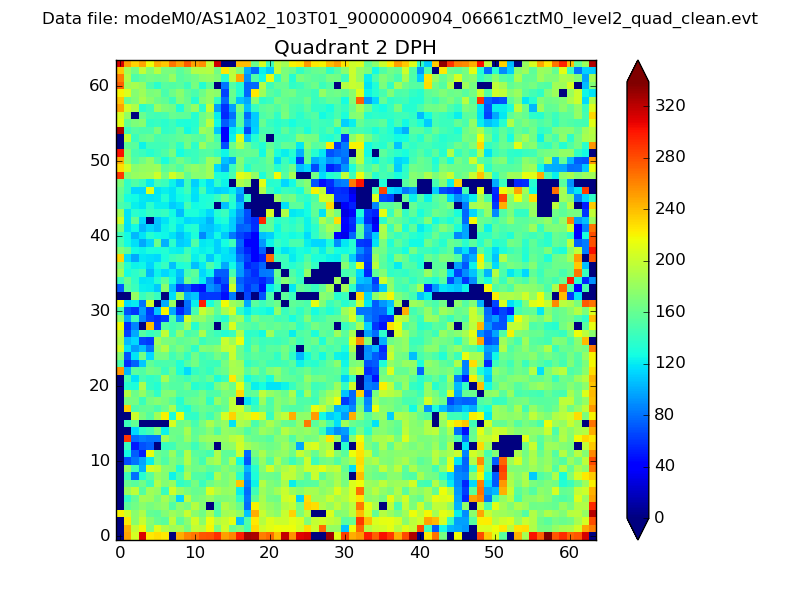
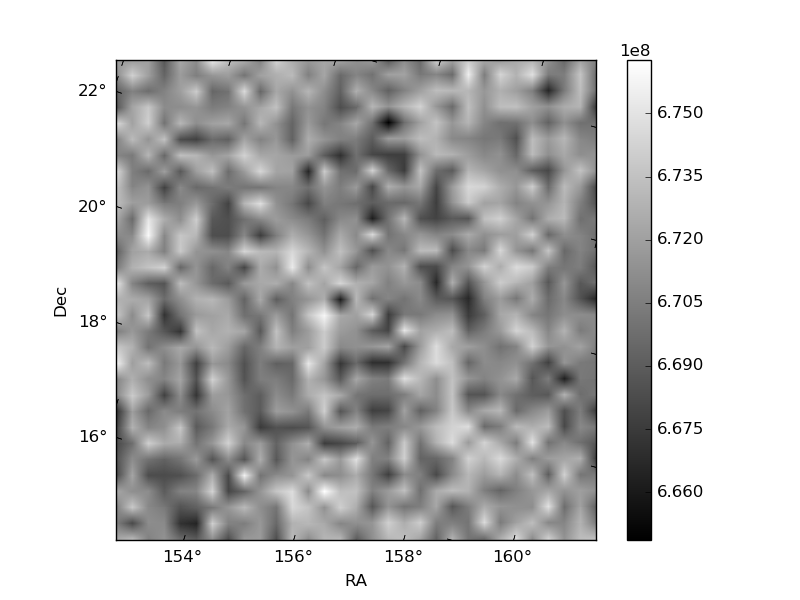
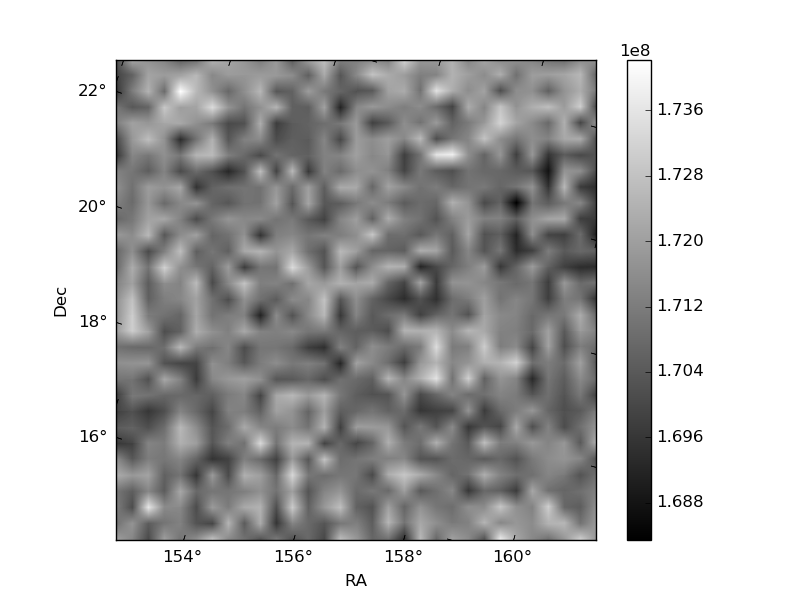
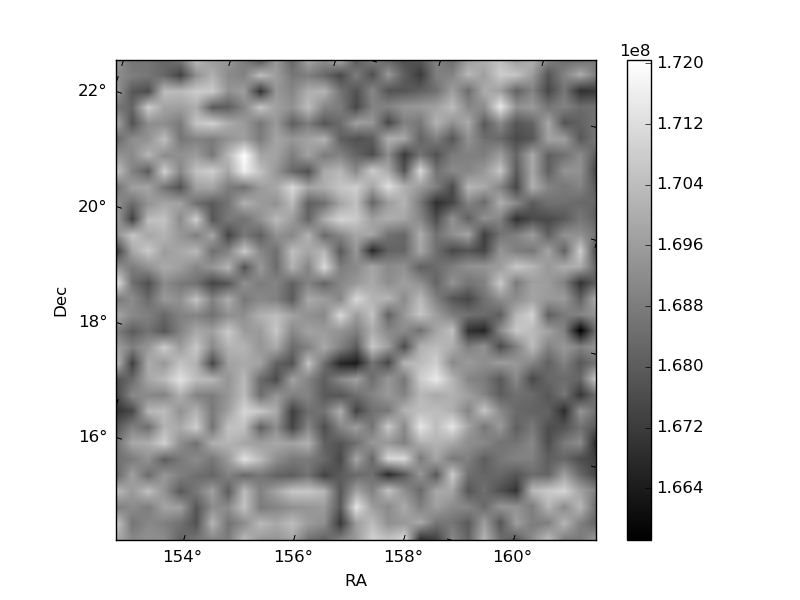
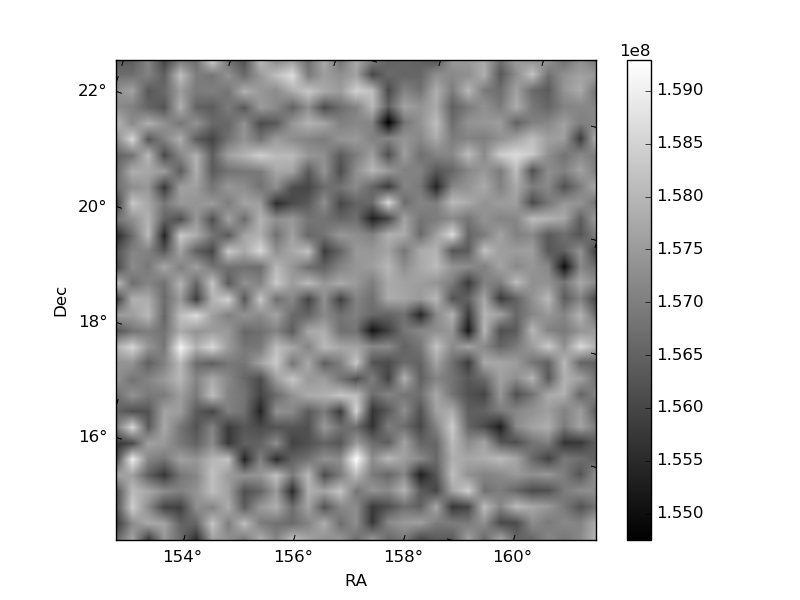
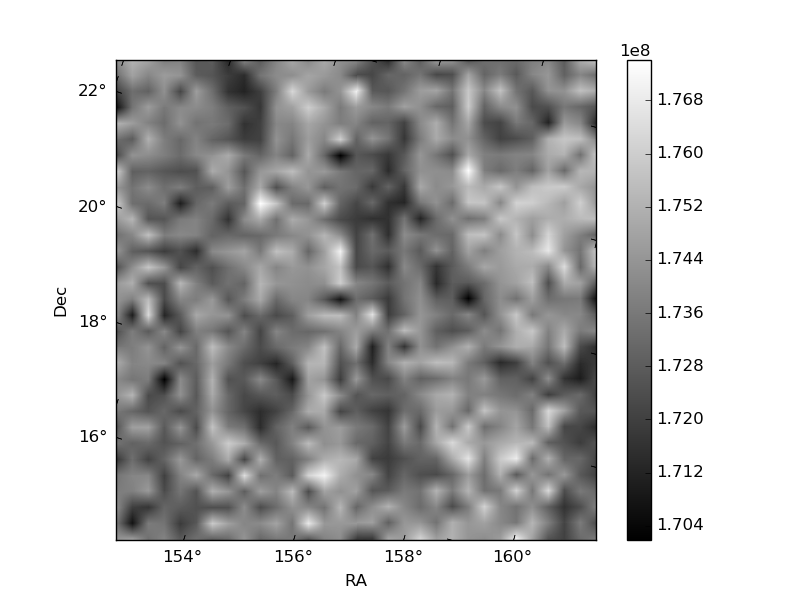
Histogram calculated using DETX and DETY for each event in the final _common_clean file
| Quadrant A | 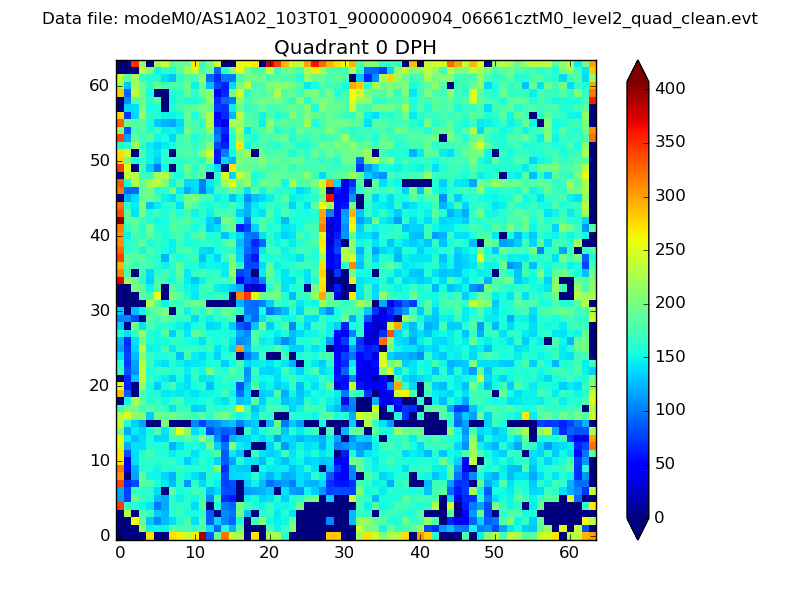 |
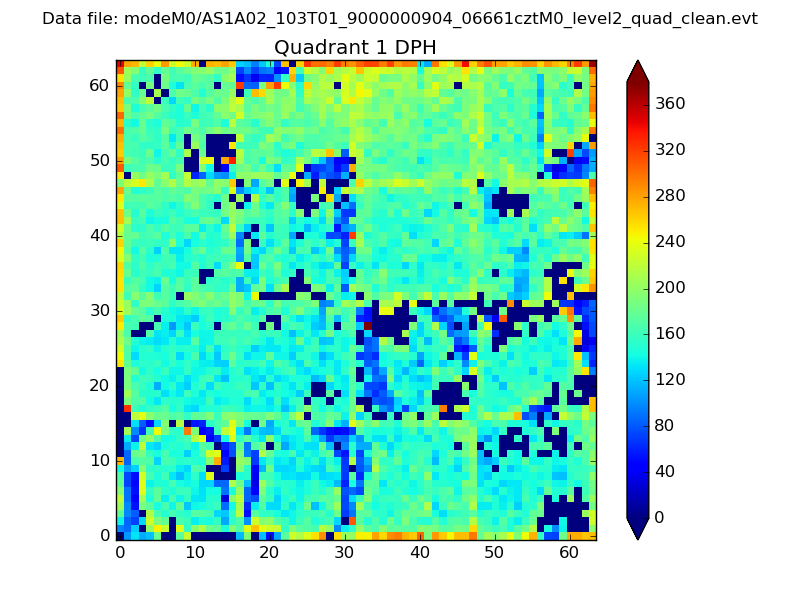 |
Quadrant B |
|---|---|---|---|
| Quadrant D | 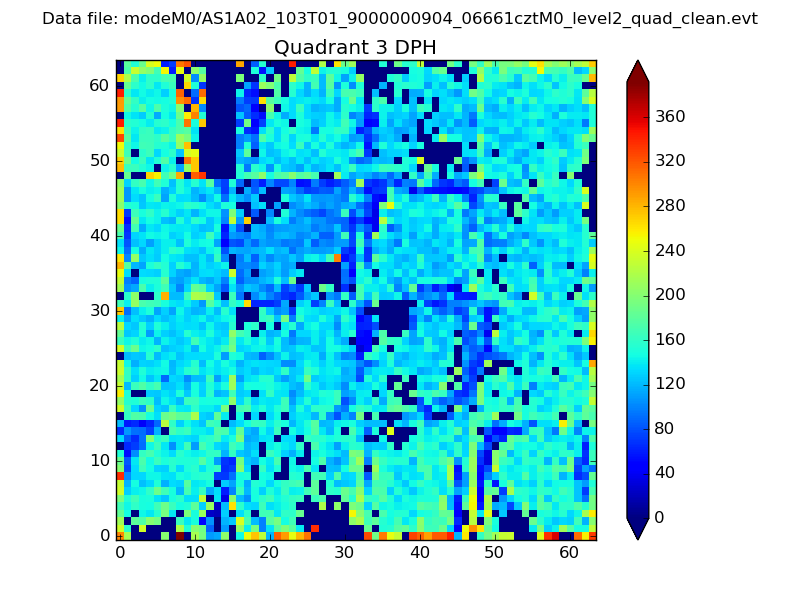 |
 |
Quadrant C |
| Plot type | Count rate plots | Images |
|---|---|---|
| Comparison with Poisson distribution Blue bars denote a histogram of data divided into 1 sec bins. Red curve is a Poisson curve with rate = median count rate of data. |
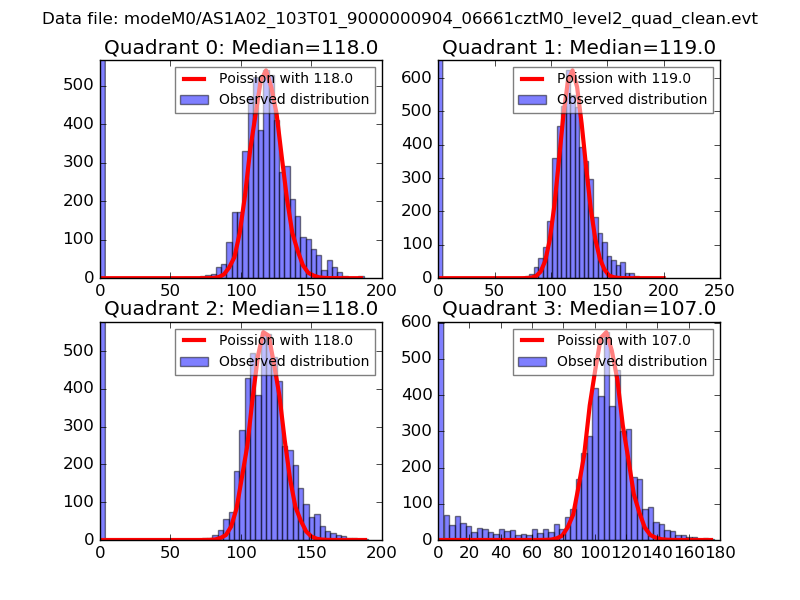 |
 |
| Quadrant-wise count rates Data is divided into 100 sec bins |
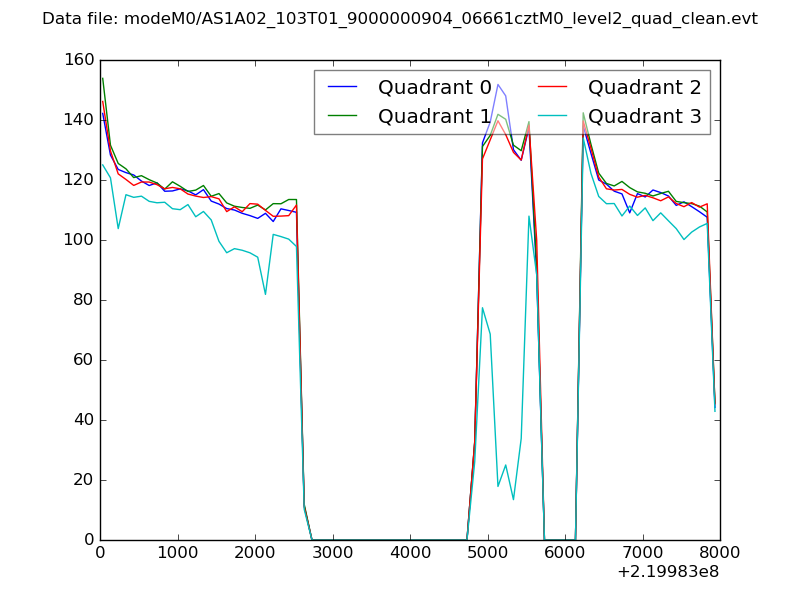 |
|
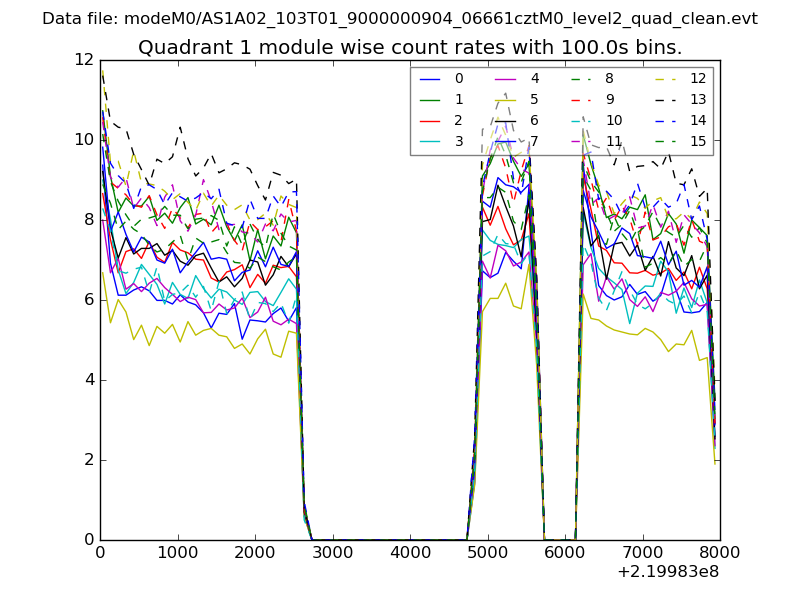
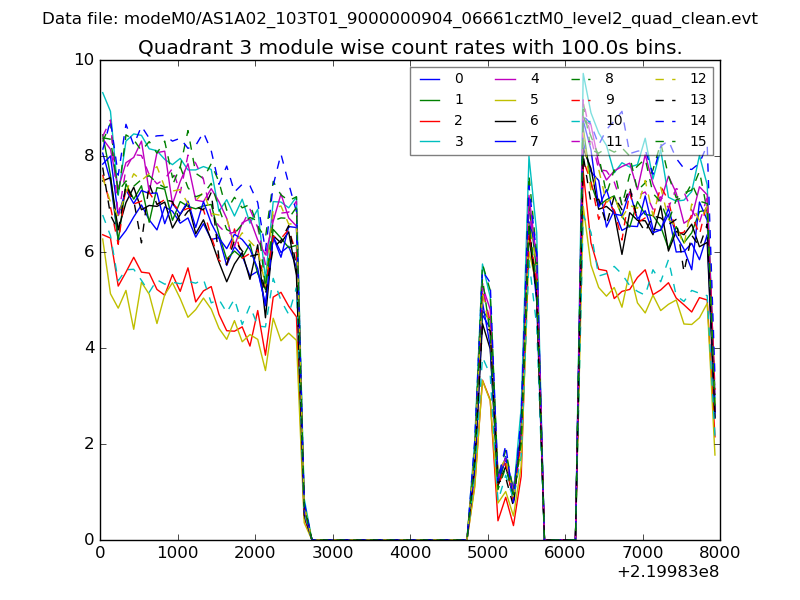
| Module-wise count rates for Quadrant A Data is divided into 100 sec bins |
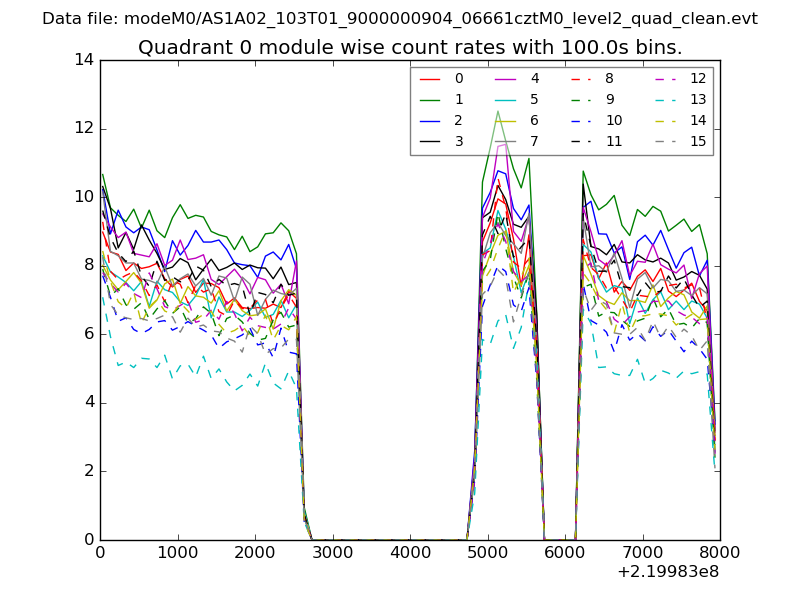 |
 |
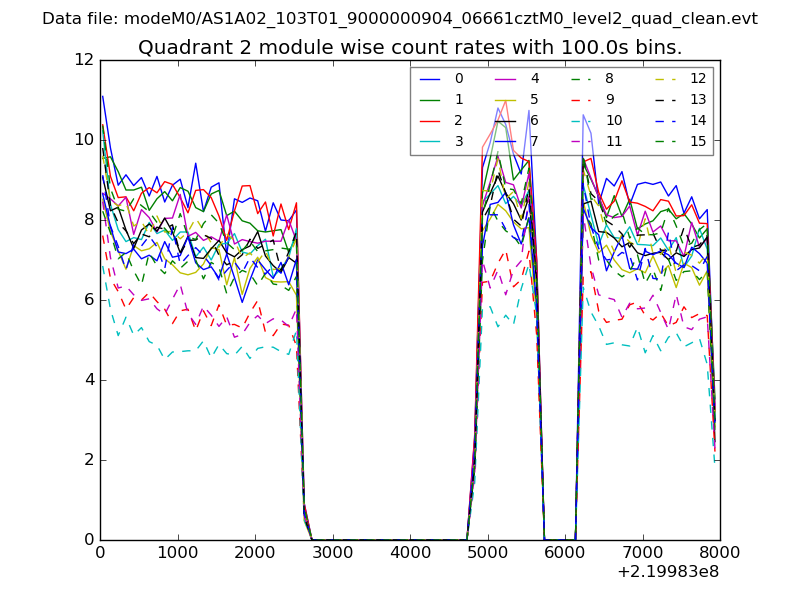
| Module-wise count rates for Quadrant B Data is divided into 100 sec bins |
 |
 |
| Module-wise count rates for Quadrant C Data is divided into 100 sec bins |
 |
 |
| Module-wise count rates for Quadrant D Data is divided into 100 sec bins |
 |
 |
| Parameter | Plot |
|---|---|
| CZT HV Monitor |  |
| D_VDD | 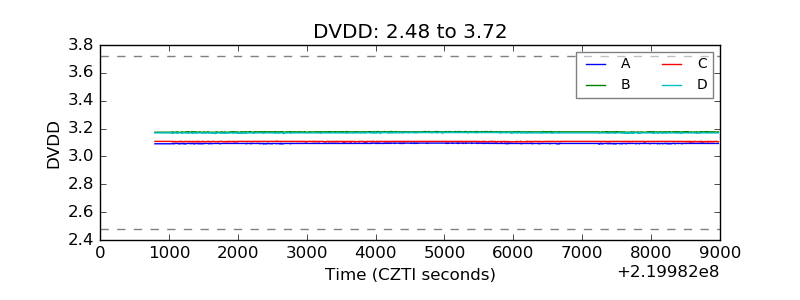 |
| Temperature 1 | 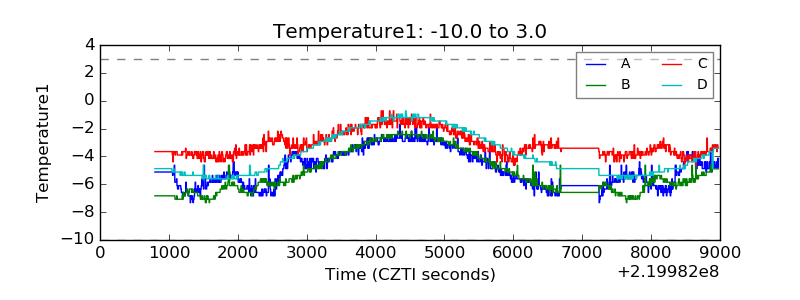 |
| Veto HV Monitor | 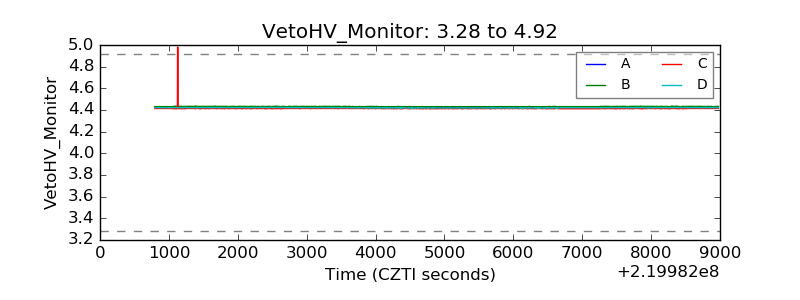 |
| Veto LLD | 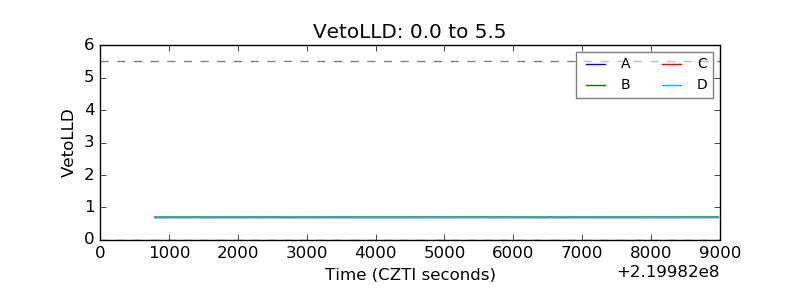 |
| Alpha Counter | 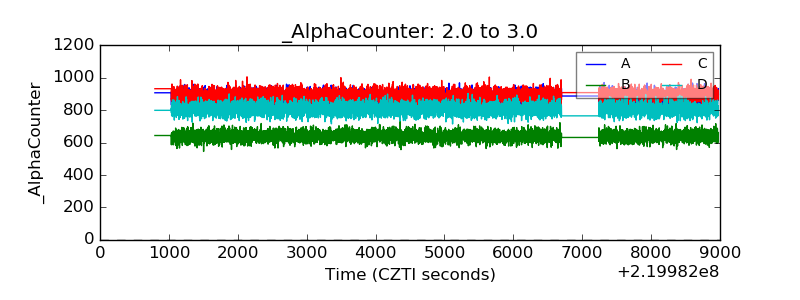 |
| _CPM_Rate | 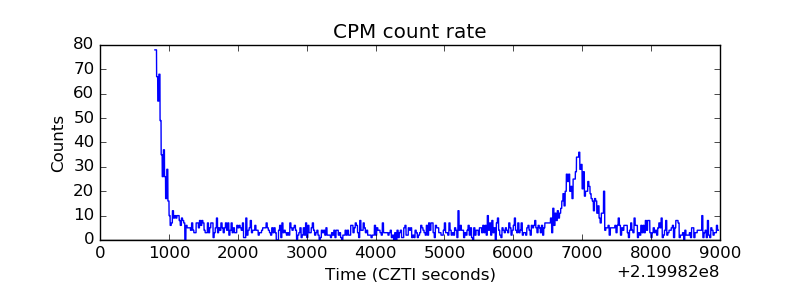 |
| CZT Counter | 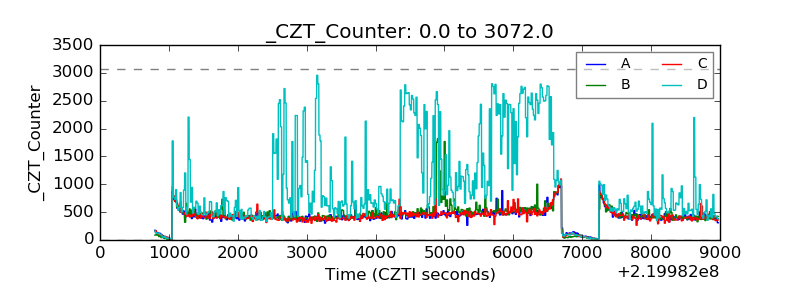 |
| +2.5 Volts monitor | 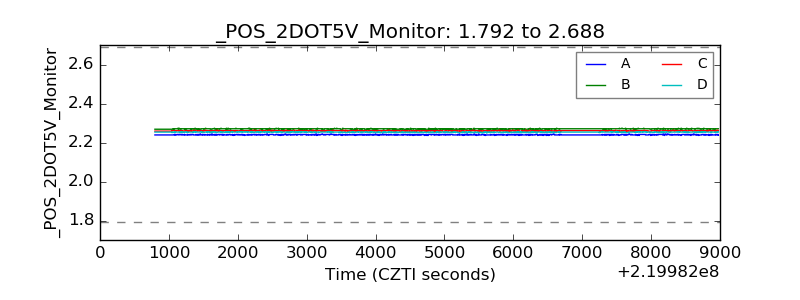 |
| +5 Volts monitor |  |
| _ROLL_ROT | 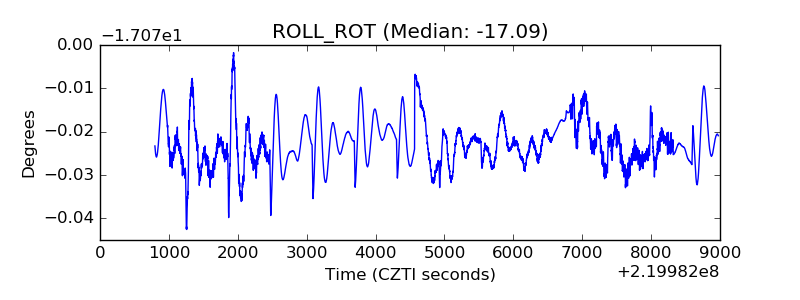 |
| _Roll_DEC | 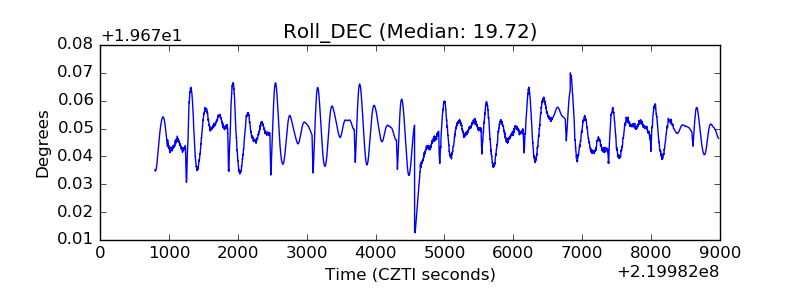 |
| _Roll_RA | 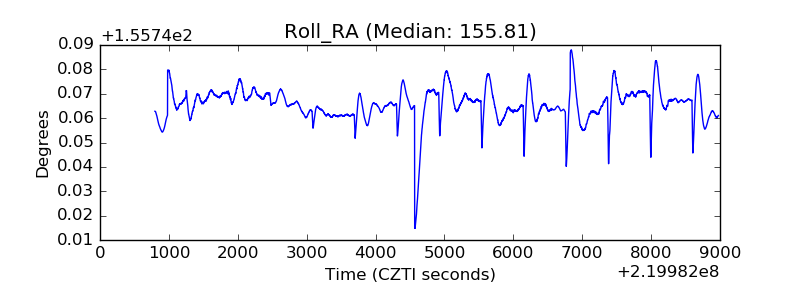 |
| Veto Counter | 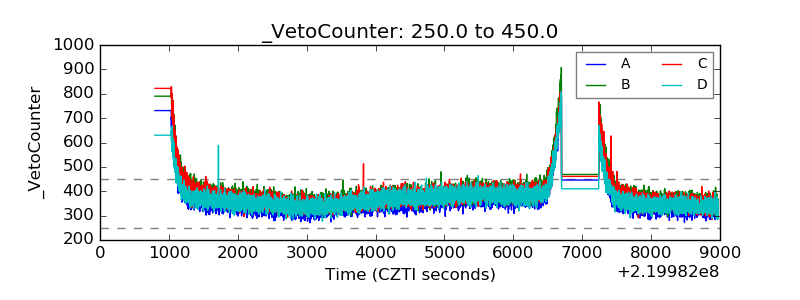 |