| Param | Original file | Final file |
|---|---|---|
| Filename | modeM0/AS1A02_103T01_9000000904_06662cztM0_level2.evt | modeM0/AS1A02_103T01_9000000904_06662cztM0_level2_quad_clean.evt |
| Size (bytes) | 623,240,640 | 102,847,680 |
| Size | 594.4 MB | 98.1 MB |
| Events in quadrant A | 3,607,624 | 655,661 |
| Events in quadrant B | 3,752,126 | 668,254 |
| Events in quadrant C | 3,653,892 | 656,923 |
| Events in quadrant D | 7,330,728 | 589,566 |
| Mode M0 | |||
|---|---|---|---|
| Quadrant | BADHDUFLAG | Total packets | Discarded packets |
| A | 0 | 16287 | 4 |
| B | 0 | 16541 | 3 |
| C | 0 | 16530 | 3 |
| D | 0 | 27317 | 3 |
| Mode M9 | |||
|---|---|---|---|
| Quadrant | BADHDUFLAG | Total packets | Discarded packets |
| A | 1 | 251318637792 | 0 |
| B | 1 | -1 | -1 |
| C | 1 | -1 | -1 |
| D | 1 | -1 | -1 |
| Mode SS | |||
|---|---|---|---|
| Quadrant | BADHDUFLAG | Total packets | Discarded packets |
| A | 0 | 158 | 0 |
| B | 0 | 158 | 0 |
| C | 0 | 158 | 0 |
| D | 0 | 158 | 0 |
| Quadrant | Total seconds | Saturated seconds | Saturation percentage |
|---|---|---|---|
| A | 7813 | 271 | 3.468578% |
| B | 7813 | 291 | 3.724562% |
| C | 7813 | 210 | 2.687828% |
| D | 7813 | 1217 | 15.576603% |
Noise dominated data is calculated using 1-second bins in cleaned event files. If a bin has >2000 counts, and if more than 50% of those come from <1% of pixels, then it is considered to be noise-dominated and hence unusable.
| Quadrant | # 1 sec bins | Bins with >0 counts | Bins with >2000 counts | High rate bins dominated by noise | Noise dominated (total time) | Noise dominated (detector-on time) | Marked lightcurve |
|---|---|---|---|---|---|---|---|
| A | 7883 | 7815 | 11 | 11 | 0.14% | 0.14% | 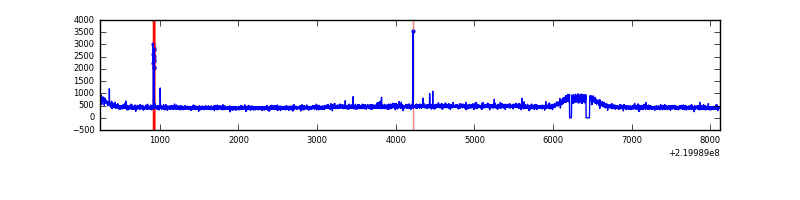 |
| B | 7883 | 7815 | 21 | 21 | 0.27% | 0.27% | 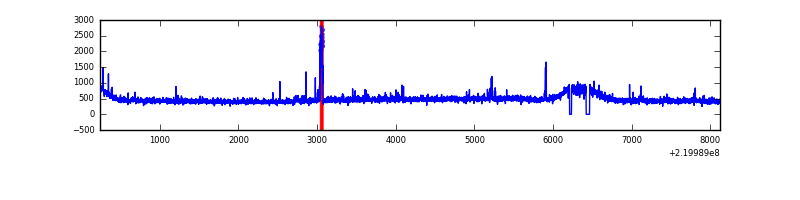 |
| C | 7883 | 7815 | 2 | 2 | 0.03% | 0.03% | 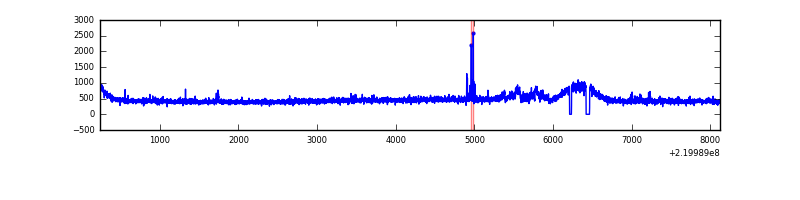 |
| D | 7883 | 7815 | 741 | 741 | 9.40% | 9.48% | 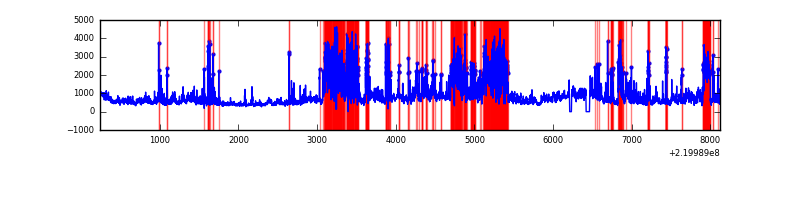 |
Top three noisy pixels from each quadrant. If the there are fewer than three noisy pixels in the level2.evt file, extra rows are filled as -1
| Pixel properties | Quadrant properties | ||||||
|---|---|---|---|---|---|---|---|
| Quadrant | DetID | PixID | Counts | Sigma | Mean | Median | Sigma |
| A | 14 | 111 | 39453 | 203.04 | 920 | 898 | 189.9 |
| A | 8 | 15 | 15984 | 79.45 | 920 | 898 | 189.9 |
| A | 0 | 226 | 8708 | 41.13 | 920 | 898 | 189.9 |
| B | 0 | 214 | 78727 | 434.01 | 927 | 903 | 179.3 |
| B | 4 | 81 | 27533 | 148.51 | 927 | 903 | 179.3 |
| B | 4 | 48 | 19588 | 104.2 | 927 | 903 | 179.3 |
| C | 9 | 247 | 138325 | 653.2 | 896 | 897 | 210.4 |
| C | 9 | 16 | 18123 | 81.88 | 896 | 897 | 210.4 |
| C | 13 | 61 | 6938 | 28.71 | 896 | 897 | 210.4 |
| D | 2 | 33 | 2188768 | 10540.37 | 842 | 814 | 207.6 |
| D | 8 | 195 | 1116084 | 5372.76 | 842 | 814 | 207.6 |
| D | 2 | 63 | 681396 | 3278.67 | 842 | 814 | 207.6 |
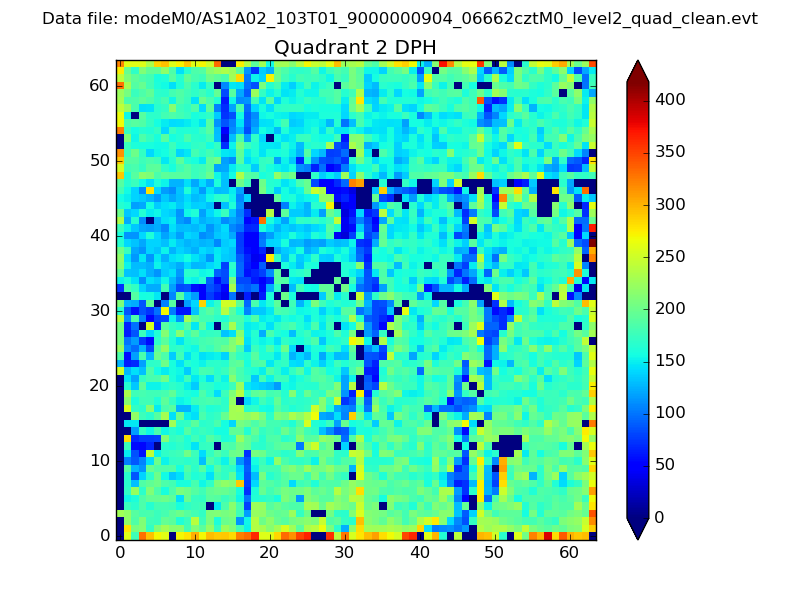
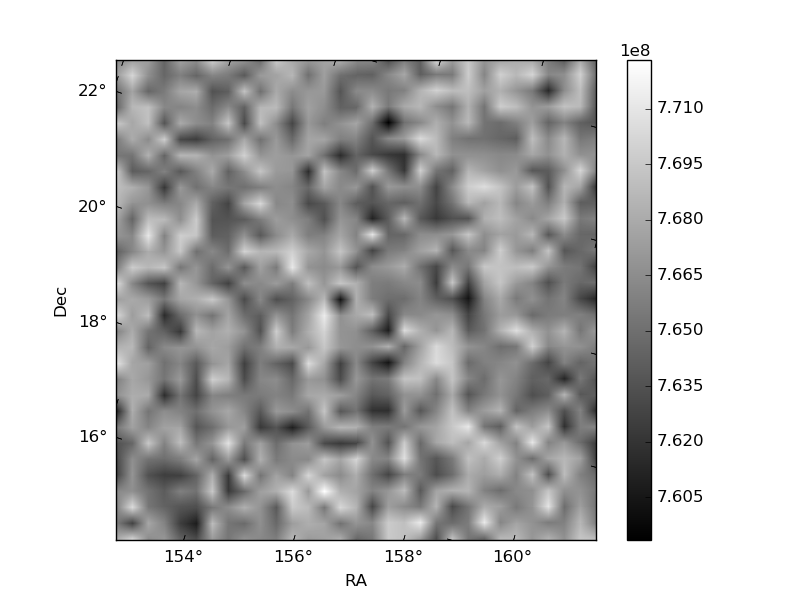
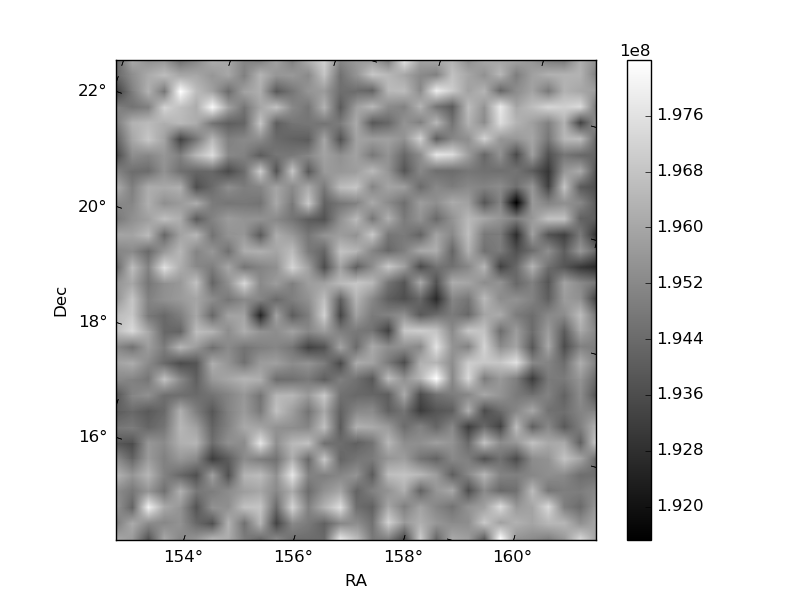
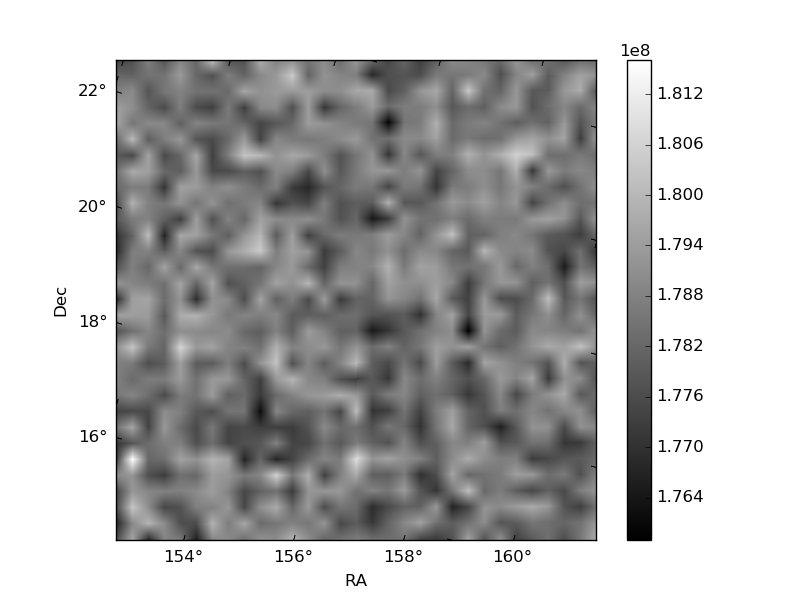
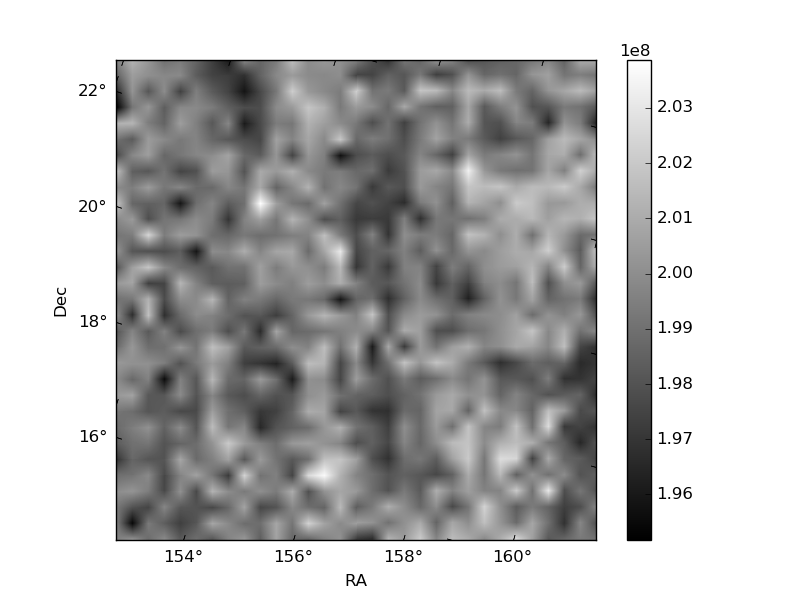
Histogram calculated using DETX and DETY for each event in the final _common_clean file
| Quadrant A | 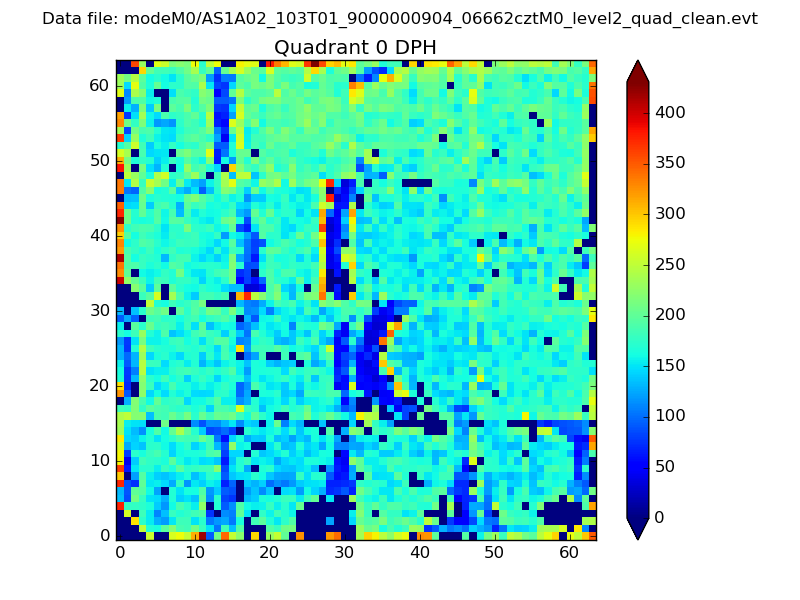 |
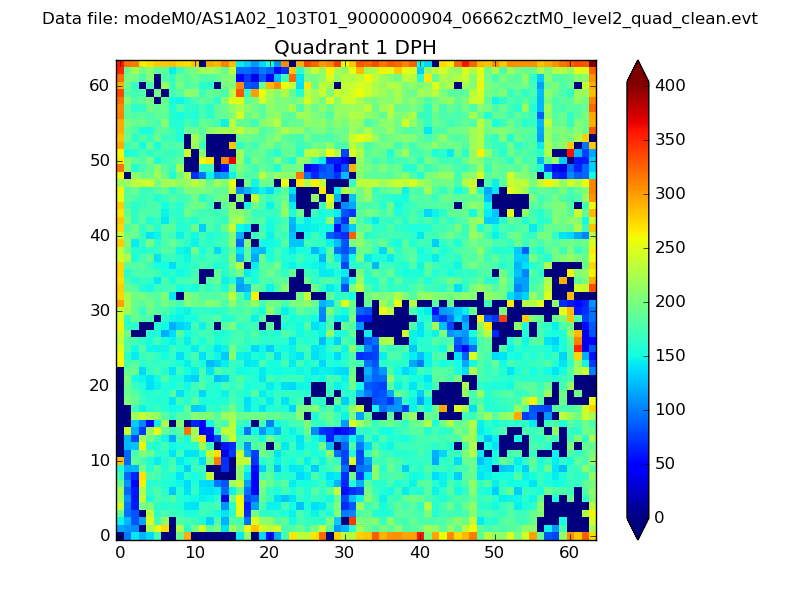 |
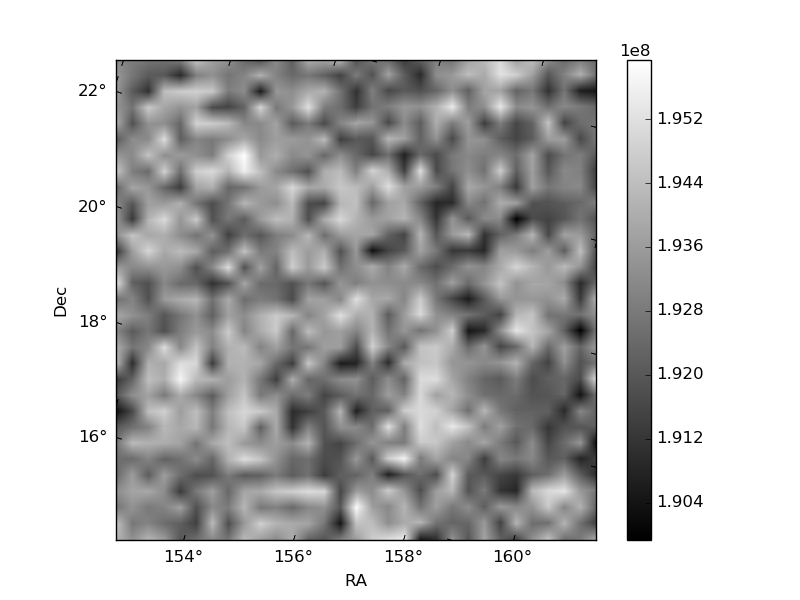
Quadrant B |
|---|---|---|---|
| Quadrant D | 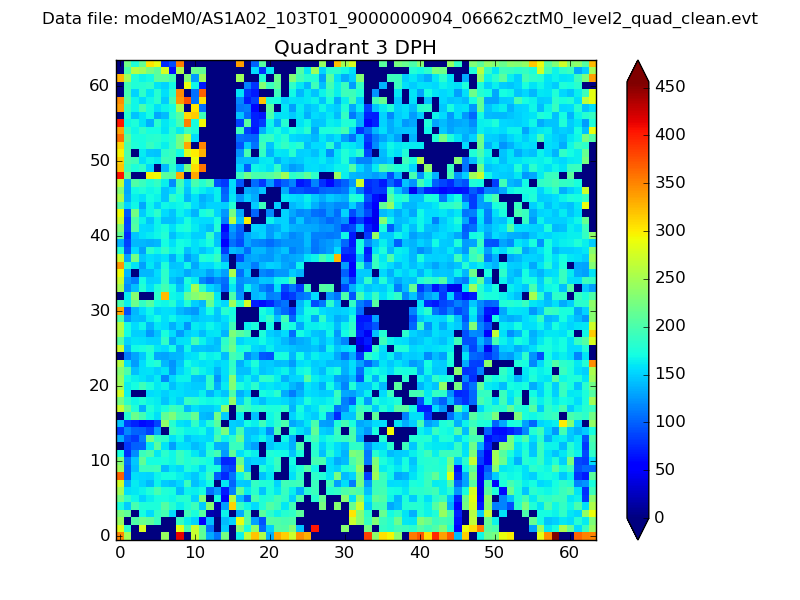 |
 |
Quadrant C |
| Plot type | Count rate plots | Images |
|---|---|---|
| Comparison with Poisson distribution Blue bars denote a histogram of data divided into 1 sec bins. Red curve is a Poisson curve with rate = median count rate of data. |
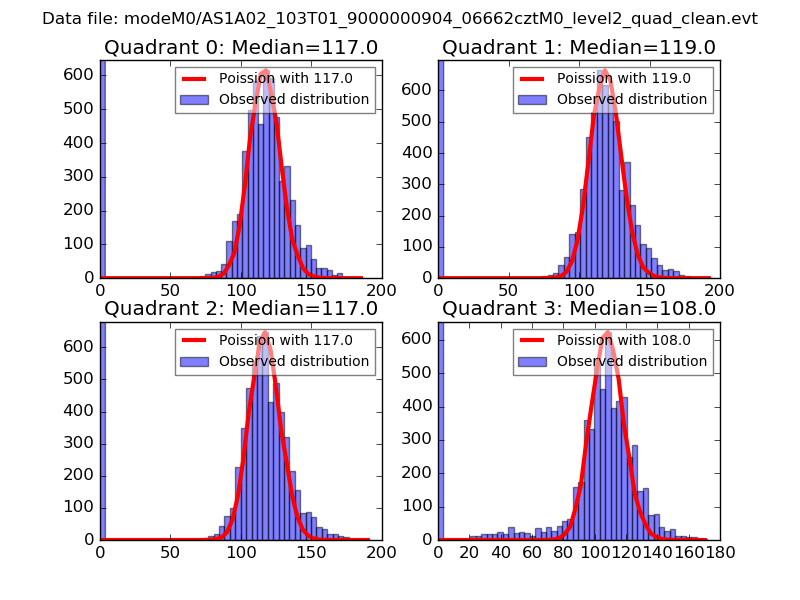 |
 |
| Quadrant-wise count rates Data is divided into 100 sec bins |
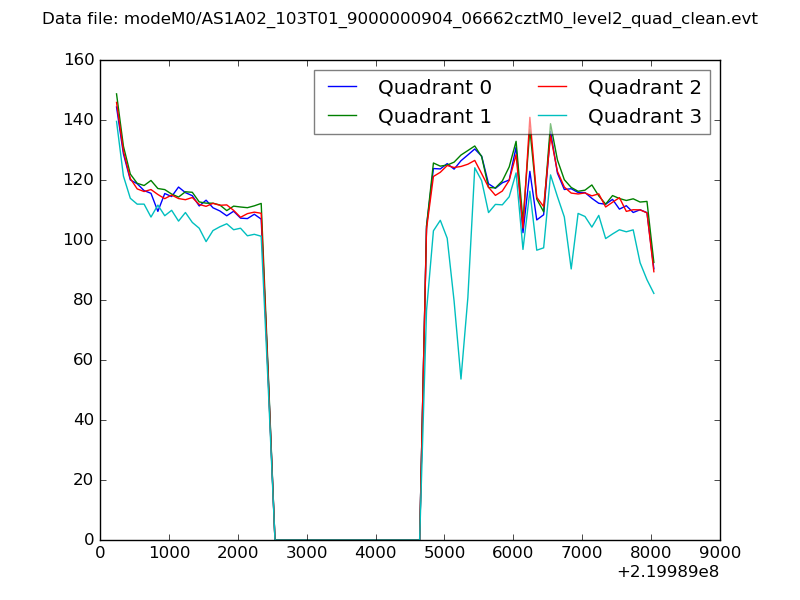 |
|
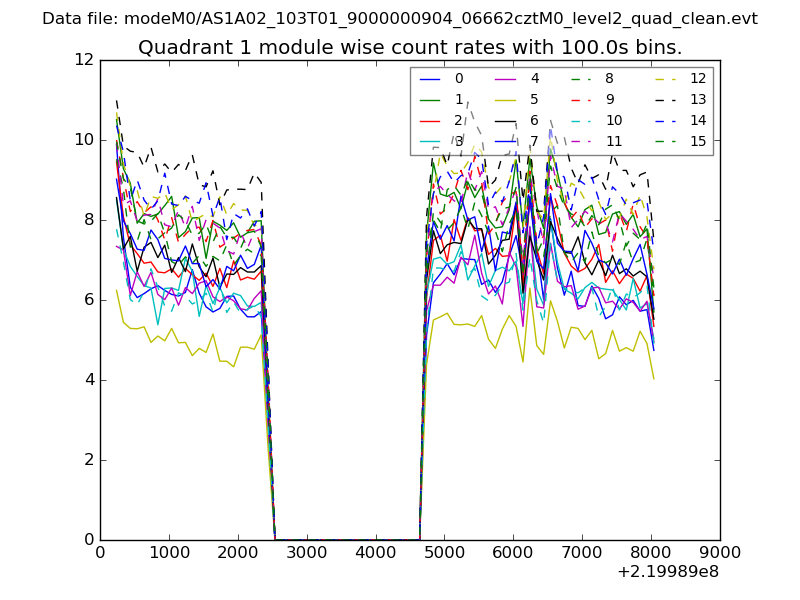
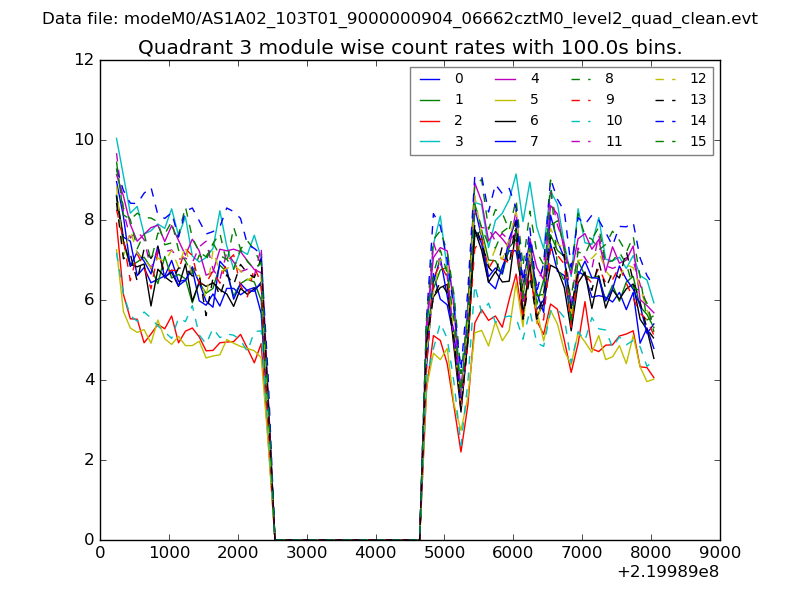
| Module-wise count rates for Quadrant A Data is divided into 100 sec bins |
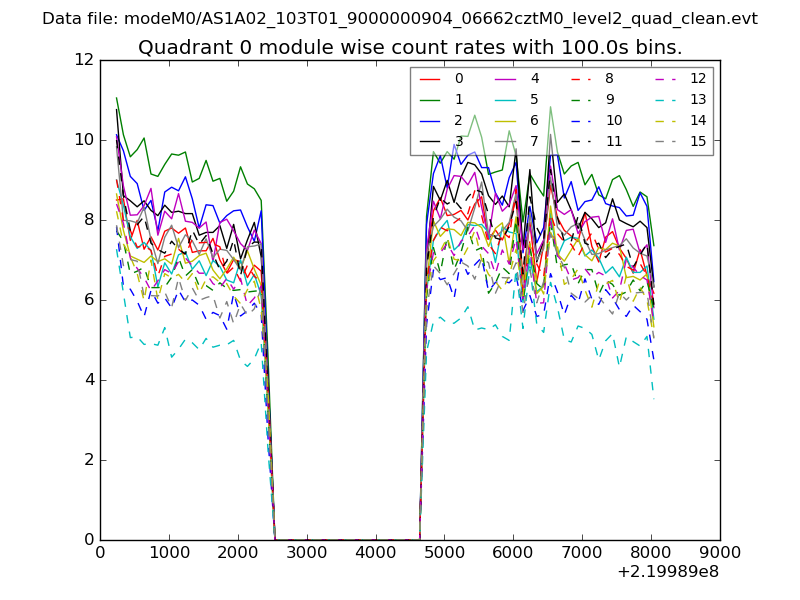 |
 |
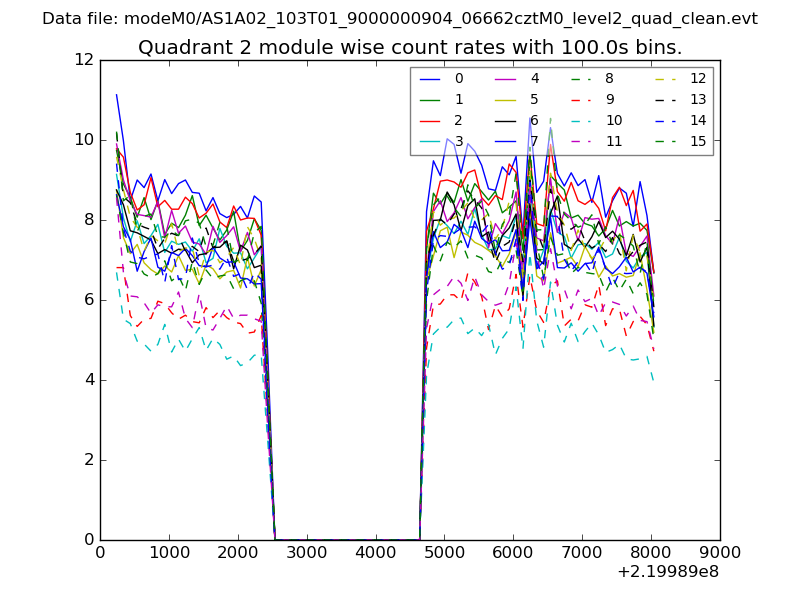
| Module-wise count rates for Quadrant B Data is divided into 100 sec bins |
 |
 |
| Module-wise count rates for Quadrant C Data is divided into 100 sec bins |
 |
 |
| Module-wise count rates for Quadrant D Data is divided into 100 sec bins |
 |
 |
| Parameter | Plot |
|---|---|
| CZT HV Monitor | 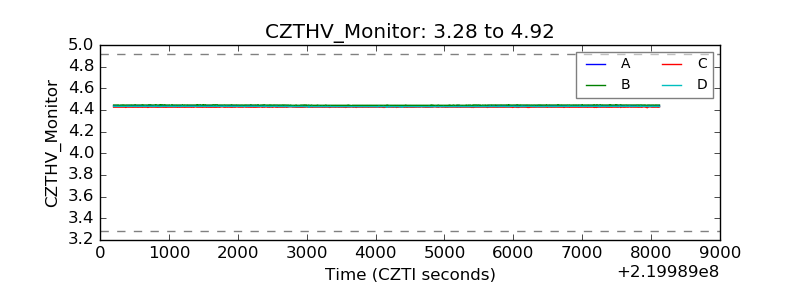 |
| D_VDD | 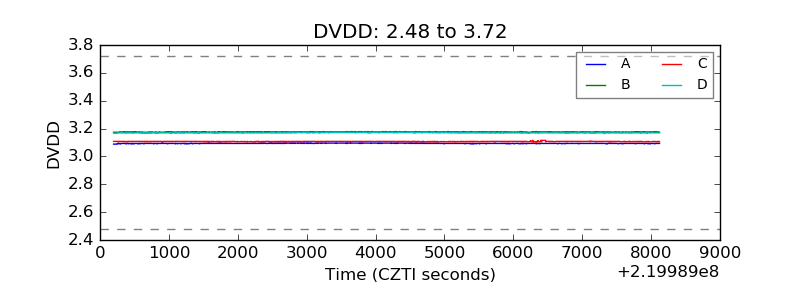 |
| Temperature 1 | 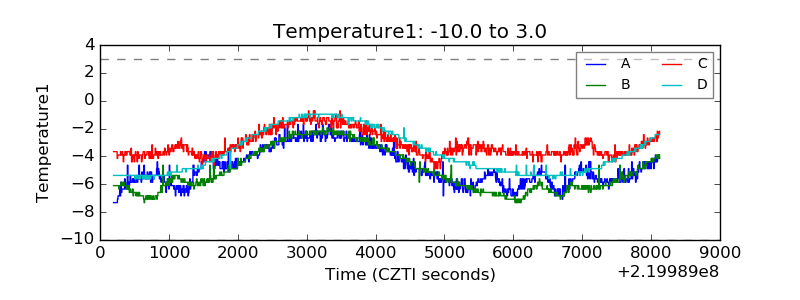 |
| Veto HV Monitor | 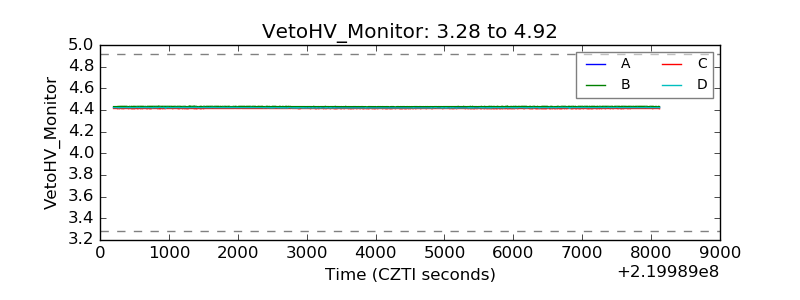 |
| Veto LLD | 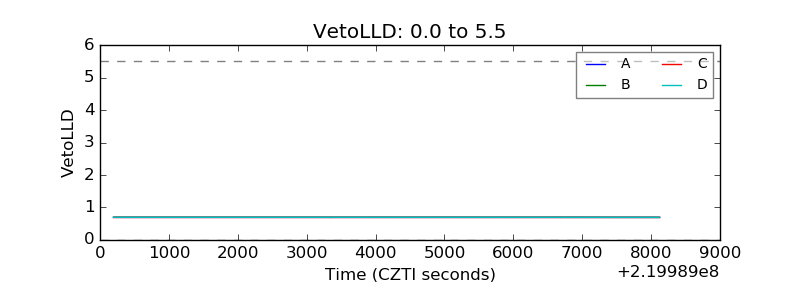 |
| Alpha Counter | 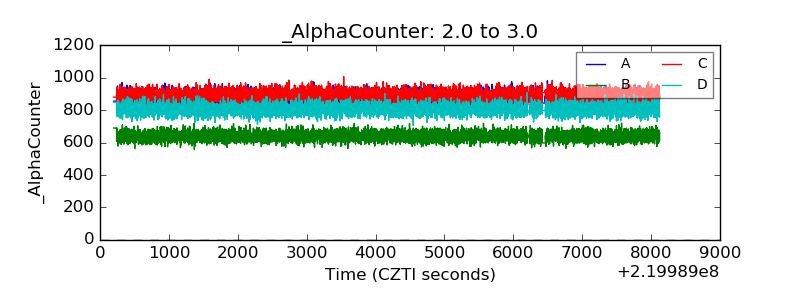 |
| _CPM_Rate | 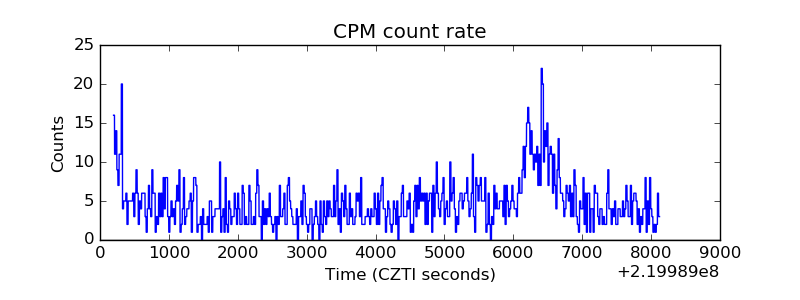 |
| CZT Counter | 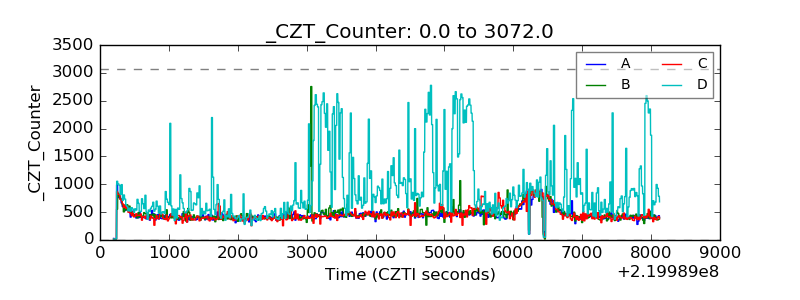 |
| +2.5 Volts monitor | 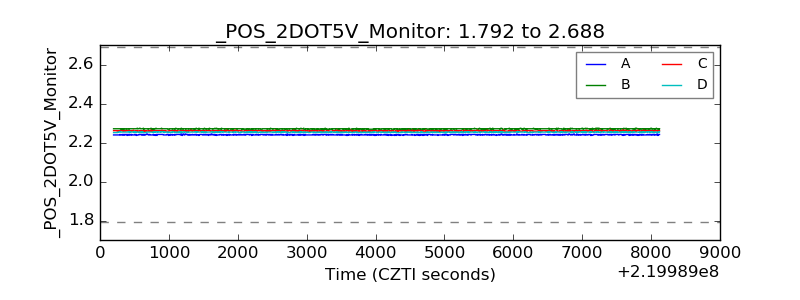 |
| +5 Volts monitor |  |
| _ROLL_ROT | 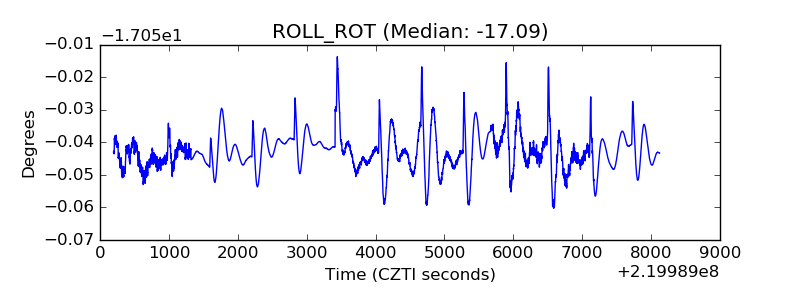 |
| _Roll_DEC | 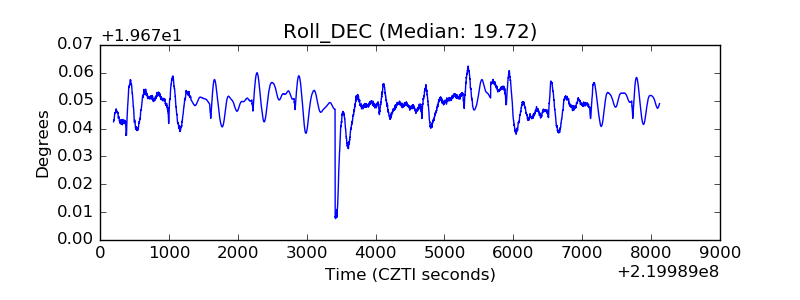 |
| _Roll_RA | 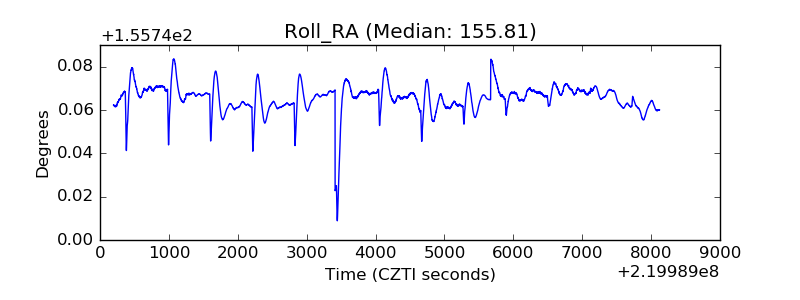 |
| Veto Counter | 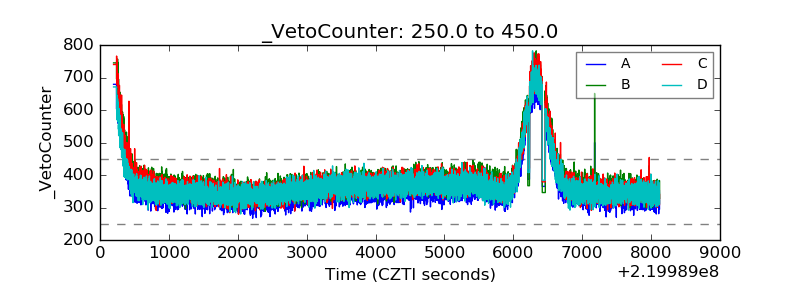 |